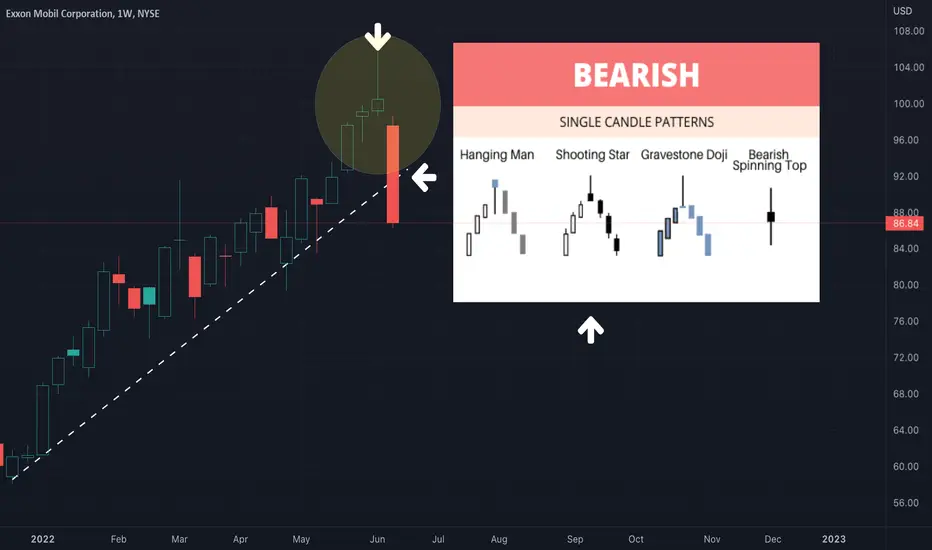
The weekly candles for the oil and gas company, ExxonMobil, look quite bearish. This could be the start of a major decline. There is a shooting star pattern forming on the weekly chart, while the oscillators are trending down and while the daily EMA exp ribbon and daily trend lines breaking down. Although anything can happen, it is looking like a major bearish reversal is occurring. It's sad that just last week all the "expert analysts" at CNBC were making strong bullish calls about energy stocks, citing "free cash flow" and numerous other reasons to buy them, all the while the charts are showing a topping pattern in energy and commodities. This is usually when tops form - when there is no bearish sentiment among anyone, and when strong hands are selling to weak hands. At least charts do not lie, and thanks to TradingView anyone can access them alongside a plethora of crowd-sourced scripts and indicators.
注释
To support my work:
patreon.com/SpyMasterTrades
To subscribe to my YouTube channel:
youtube.com/@SpyMasterTrades
To follow me on X:
twitter.com/SpyMasterTrades
To tip me (BTC wallet):
bc1qvh48429042mdwvdthwlufx072g3ftffcts2q03
patreon.com/SpyMasterTrades
To subscribe to my YouTube channel:
youtube.com/@SpyMasterTrades
To follow me on X:
twitter.com/SpyMasterTrades
To tip me (BTC wallet):
bc1qvh48429042mdwvdthwlufx072g3ftffcts2q03
免责声明
这些信息和出版物并非旨在提供,也不构成TradingView提供或认可的任何形式的财务、投资、交易或其他类型的建议或推荐。请阅读使用条款了解更多信息。