图表形态

黄金H1 – 横盘还是准备更大突破?🟡 XAUUSD – 日内聪明资金计划 | 作者:Ryan_TitanTrader (20/11)
📈 市场背景
黄金继续在紧密的盘整中移动,市场消化最新的头条新闻:
国债市场刚刚抹去了对12月降息的希望,现在甚至1月降息也成疑,因为最新的美联储会议纪要显示出鹰派语气。
这一变化在短期内加强了美元的强势,并对黄金的看涨动能施加压力,使价格被困在明确的流动性区域之间。
新闻的关键影响:
• 6个月期国债收益率回升至3.83%,符合鹰派预期。
• 降息押注消失 → 美元保持坚挺,限制黄金的上行空间。
• 机构在即将到来的美联储发言人之前,正在进行双向流动性清扫。
• 黄金目前徘徊在约$4,070的中性区域内,没有明显的溢价/折扣失衡。
在市场获得新的宏观催化剂之前,价格可能会在选择方向之前扫过区间边缘的流动性。
🔎 技术分析 (1H / SMC结构)
• 结构:在最近的CHoCH + BOS序列之后,价格保持在短期横盘分布中。
• 溢价卖出区:4145–4147,与未缓解的供应+买方流动性位于近期高点之上。
• 折扣买入区:4004–4002,位于最后的清洁需求内,之前的卖方清扫。
• 流动性地图:
→ 买方流动性:高于4145–4150(等高集群)。
→ 卖方流动性:低于4004–3997,早期多头头寸被清除。
🔴 卖出设置(溢价反应区)
• 入场:4145 – 4147
• 止损:4155
• 止盈:
→ 4085(小失衡)
→ 4045(区间中点)
→ 4004 – 4002(折扣需求)
📌 执行规则:等待流动性扫入区域+看跌CHoCH M5–M15后入场。
🟢 买入设置(折扣反应区)
• 入场:4004 – 4002
• 止损:3997
• 止盈:
→ 4040(短期区间高点)
→ 4075(效率填补)
→ 4140(溢价重测)
📌 仅在价格扫过4000–3997流动性口袋并显示出强劲的看涨位移时有效。
⚠️ 风险管理注意事项
• 预计随着市场在降息预期急剧下降后重新定位,波动性增加。
• 除非出现明确的结构突破,否则避免在4030–4080的震荡区间内交易。
• 在因国债收益率变动引起的美元突然飙升期间,减少风险规模。
• 随着每个流动性水平被突破,逐步跟踪止损。
📝 总结
由于鹰派的美联储会议纪要消除了对早期降息的希望,推动美元上涨并将黄金保持在溢价供应下方,黄金目前陷入了一个清晰的日内区间。
SMC结构偏向于在两端进行流动性清扫设置:
• 卖出区:4145–4147(溢价供应)
• 买入区:4004–4002(折扣积累)
预计经典的操纵 → 反应 → 延续模式,直到市场解决新的宏观压力。
📍 关注@Ryan_TitanTrader获取更多聪明资金更新。

欧元EUR趋势与基本交易策略周线复合:周动能反转看涨,在未来3-4周应保持整体上涨。(牛)
日线复合:周五价格到达超卖区,警告日线⾼点临近。
关键因素:欧元可能已经完成了 ABC 平移修正。需要日收盘价超过 10/28 的摆动⾼点来确认Wave-C,并且周线低点应该已经完成。
交易策略建议:若收盘价高于 11/13 的次级摆动高点收盘价,则应意味着修正完成,之后看涨趋势有望恢复并突破 9 月高点。
⚠ 短期交易者应以TradingBox信号系统为准!

Pin Bar 与回调的经典组合:简单却历久弥新的交易策略在交易世界中,人们往往喜欢把事情复杂化。事实上,简单才是关键。
Pin Bar(针形线)与 Pullback(回调) 的组合,就是那种经得起时间考验、简洁而高效的策略。
它并不是让你去追逐各种形态或指标,而是帮助你识别出市场明显的拒绝信号,并以结构化的方式重新回到趋势中。
Pin Bar 的真正含义
Pin Bar 是一根“拒绝”K线。
它表示市场曾试图朝某个方向推进,但最终失败并迅速反转。
长影线显示了拒绝,小实体表示走势未能延续,而影线的方向揭示哪一方输了这场战斗。
但不是所有 Pin Bar 都有意义。
出现在“无关区域”的 Pin Bar 只是噪音;
只有出现在关键价位、并与趋势结构一致时,才是值得关注的交易信号。
USD/CAD 日线图上的 Pin Bar 示例
过往表现并非未来结果的可靠指标。
Pullback:市场的“呼吸节奏”
回调是趋势中的自然修正。
它是市场休整的阶段,洗掉浮躁的交易者,同时给有纪律的交易者提供第二次入场机会。
在上升趋势中,回调是回落至支撑位;
在下降趋势中,则是反弹至阻力位。
这不是弱势,而是市场的节奏。
USD/CAD 日线图上的 Pullback 示例
过往表现并非未来结果的可靠指标。
为什么这个组合有效?
Pullback 提供了更理想的入场价格,
Pin Bar 显示出关键价位的拒绝,
而趋势本身提供方向性偏好。
当三者结合时,你同时拥有了结构、心理与时机的共振。
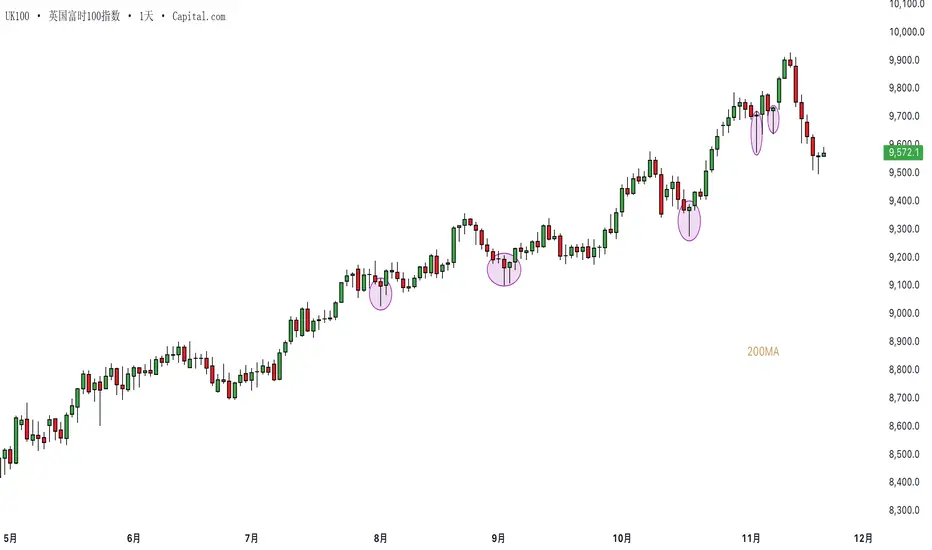
UK100 日线图:Pullbacks 与 Pin Bars
过往表现并非未来结果的可靠指标。
背景与共振的重要性
Pin Bar 的强度取决于它所处的背景。
在主要支撑位回调结束处出现的看涨 Pin Bar,其信号远强于盘整区中孤立的一根。
“共振(Confluence)”是提高成功率的关键。
当多个技术因素在同一区域重叠时,意味着更多交易者在关注并采取行动。
例如:50 日均线与水平支撑位重合,同时出现 Pin Bar 拒绝该区域——
这就是一个具有吸引力的高概率结构。
我们不需要所有条件完美契合,但必须确认拒绝是有意义且被市场认可的。
UK100 日线图:具有共振的 Pullbacks 与 Pin Bars
过往表现并非未来结果的可靠指标。
交易步骤指南
在更高周期上识别主要趋势
等待价格回调至合理位置
寻找在该区域出现的 Pin Bar
当 Pin Bar 收线后,顺势入场
将止损设置在影线之外
根据目标或风险回报比管理仓位
常见错误
逆势交易 Pin Bar
忽视背景与共振因素
K线尚未收盘就过早进场
止损过近,被正常波动扫出
三大关键要点
1️⃣ Pin Bar 显示拒绝
它揭示市场尝试与失败的痕迹,留下供需的足迹。
2️⃣ Pullback 提供时机
让你在价格回到价值区时入场,而不是在高位或低位追单。
3️⃣ 共振建立信心
当 Pin Bar 与回调在趋势与关键价位上重合时,信号更具可信度。
免责声明
本文内容仅供学习与参考,不构成投资建议,也未考虑任何投资者的个人财务状况或目标。
任何与过往表现相关的信息,都不构成未来结果的可靠指标。
社交媒体内容不适用于英国居民。
差价合约(CFD)与指数交易具有高杠杆风险。
85.24% 的零售投资账户在与本服务商进行差价合约交易时出现亏损。
在参与交易前,请确保你了解这些产品的运作方式,并确认自己能承受潜在亏损的高风险。

金汇得手:黄金震荡洗盘 晚间非农继续看区间震荡 美元指数昨天收大阳,今天关注100.2(100.6)-99.7区间。
黄金昨天走出过山车行情,日内震荡上涨,晚间急速拉升至4133附近受阻回落,再次回到原点,日线最终收十字星。早盘4080开盘就涨30美金,单看早盘走势,今天低多操作。但是结合昨天收线,今天倾向反弹空操作,所以暂时按照震荡思路。上方阻力早盘高点4110附近,还有一个是4120或昨天高点附近,不破可以小止损空。一旦站稳4133,还是继续看4150-4165甚至4180附近,触及再空。下方支撑日内低点附近,不破小止损多,有效下破,先看昨天低点4055甚至再去一次整数关口。
操作建议:先涨接近4120或昨天高点空,先跌接近日内低点多,其他位置参考上面分析。昨天我们早盘4054附近多,4065多,4082破位多,4078多,4106多,4133空。
原油昨天再次走出洗盘震荡行情,今天防止行情阴阳转换,建议接近昨天低点不破多,接近昨天高点不破空,早盘关注59.3-60区间。分析仅供参考,实盘为准。


黄金纽约时段策略11/19:将上涨至4162黄金每日计划 – SMC展望(11月20日)
框架:CHoCH – BOS – FVG – POI – 溢价/折扣模型
1. 市场背景
黄金在本周初大幅下跌后继续反弹。价格目前接近当前看涨波动的溢价区,并触及H1供应。市场显示:
买家仍在短期控制中
随着价格达到阻力,动能减弱
在进一步扩展之前,可能会出现修正性回调至折扣区
2. 结构概览(SMC逻辑)
🔻 整体市场结构
在4090–4100附近形成关键BOS → 确认短期看涨结构
后续CHoCH信号表明日内上升趋势的延续
价格正向上移动至上方FVG + 供应区(4160–4162)
🔸 订单流注释
在4140区域强烈反应 → 明显存在被动卖出限价吸收
4091–4089的需求POI表现异常良好 → 主要看涨缓解区
3. 交易区(POI)
✅ 买入区(折扣区)
4091 – 4089
需求 + 之前的CHoCH + fib 1.272 汇合
理想的低风险长线设置在折扣区内
建议止损:4087
买入情景:
价格回撤至POI → 显示看涨反应 → 长线至溢价。
❗️ 卖出区(溢价区)
激进卖出区:
4143 – 4145
止损:4147
最佳卖出区:
4160 – 4162
主要供应 + 不平衡 + fib 2.618 扩展
最高概率的反转
止损:4165
4. 交易情景
📌 主要情景(高概率)
价格回撤至4091–4089需求
在较低时间框架上寻找CHoCH/BOS确认
进入买入 → 目标4143 → 4160
→ 经典SMC模型:从折扣买入 → 从溢价卖出。
📌 替代情景
如果价格直接上涨至4143–4162而不回撤:
仅在形成明确的看跌CHoCH或强烈拒绝时进入卖出
目标:4100 → 4090
5. 日内偏向
→ 在折扣区看涨 – 在溢价区看跌。
根据订单流进行交易 → 不要在中间范围追逐价格。
6. 总结
买入:4091–4089(止损4087) → 目标:4140 – 4160
卖出:
• 4143–4145(止损4147)
• 4160–4162(止损4165)
在每个POI等待确认;避免中间范围进入。

-DamienCross · 2025-11-19 · XAUUSD/GOLD - 交易策略-DamienCross · 2025-11-19 · XAUUSD/GOLD - 交易策略
目前黄金以4050作为目前多空分水岭.
多单策略:
黄金现价在4050上方,思路方向看涨,
首要目标价位为4100附近(自行把握SL/TP)
若持续上行突破,激进者可向第二目标位4130(自行把握SL/TP)
空单策略:
黄金现价在4050下方,思路方向看跌,
首要目标价位为4020附近(自行把握SL/TP)
若持续下行破位,激进者可向第二目标位4000(自行把握SL/TP)
有任何单子被套需要咨询,请随时与我联系或留言解答.
—— ARMAMENT·TRADER
免责声明 ——
【个人策略/思路/观点-仅供参考-据此交易-风险自担】

BTC空头趋势未变,不能抄底当前盘面:日线级别仍然延续下跌趋势,昨日下跌多方出现放量买入信号,但后续没有持续放量买入,目前在上方两段空头结构延续的第1扩展区间震荡。
消息面:今日华尔街盘后,英伟达财报;未来美府劳动力数据公布;以IBIT为首的机构ETF仍然大量流出。
分析:当前价格在两段空头结构的支撑阻力夹缝中震荡,昨日多头需求放量没有延续,不符合机构操作规律,更像巨鲸或游资的独立买入行为,不构成结构反转或大幅反弹的买方推力,而下方88K如果跌破,价格将进入筹码稀疏区间,有暴跌至70K的风险。目前消息面没有利好,即便英伟达财报依然亮眼,但目前市场已经意识到AI硬件持续泡沫化的风险,短时间很难改变。客观上目前BTC定价权已被机构控制,即便个别巨鲸和游资持续看好加密货币并持续囤积,但总量和目前BTC的跌幅,基本年度利润回吐,个人认为客观上华尔街仍将BTC作为高风险投机产品和AI科技股的放大器和杠杆,当风险来临时机构首先考虑的就是抛售离场,而交易所作为二级市场却显示BTC的存量下降,大量流出,导致散户判断巨鲸吸筹,期待反转,跟进做多,持续接盘被收割。以上仅为个人的粗浅判断,不妥之处感谢小伙伴们批评指正。
建议:合约方面,上方空单继续持有,根据持仓情况下移止损,确保收益,继续博弈空头持续延续;下方反弹持多单的小伙伴建议止盈走掉避免行情波动被套;空手的小伙伴目前就不要开单了,等走出震荡区间后跟进开单(可能会在UTC+8明日凌晨英伟达财报后),但个人判断依然利空,如下破88K追空博弈持续下跌。现货目前仍然建议继续观察。


黄金策略 11/18:突破此点位黄金将进一步下跌📝 黄金交易计划 – 11月18日
1. 市场背景
价格在看跌BMS突破后围绕4030–4040波动。
主要结构:在更广泛的流动性寻求环境中进行修正性反弹。
预期:流动性扫荡 → 反应 → 方向性移动。
2. 关键交易区域(来自图表)
🔽 买入区域
主要买入区域
3982 – 3980
→ 止损:3977
强烈共振(趋势线 + OB + 支撑)。
深度买入区域
3927 – 3920(OB区域)
→ 止损低于3920
仅在价格扫过3980并继续走低时激活。
🔼 卖出区域
主要卖出区域
4056 – 4058
→ 止损:4061
强烈共振:FVG + 阻力 + 流动性扫荡区域。
卖出目标
目标1:4000
目标2:3980
目标3:3930(仅在重大新闻驱动的波动情况下)
3. 预期价格情景
情景1 – 最可能
🔹 价格重测趋势线 → 小幅反弹 → 推进至4056–4058
🔹 从该区域卖出 → 目标4000 → 3980
情景2 – 次要
🔹 价格先下跌 → 达到3982–3980
🔹 寻找看涨反应 → 买入 → 重测4040–4050
情景3 – 高波动性移动(新闻影响)
🔹 如果价格果断跌破3980 → 下跌至3927–3920
🔹 强烈买入区域 → 预期反转回到4000–4030
4. 新闻影响 – 11月18日
今天的高影响事件:
美联储发言人:沃勒、巴尔、巴尔金(晚上10:00–11:00)
→ 预计黄金将出现强烈波动。
特朗普总统讲话 – 早上6:00
美国住房开工率 – 晚上8:15
🔔 注意事项:
在重大讲话前避免大额仓位。
保持止损紧凑;黄金对美元新闻反应激烈。

(有梦分析)当前行情震荡下跌,多空关键位之下回调看空,或背靠下跌通道以高抛低吸为主,突破看多或下破看空为辅。当前行情震荡下跌,多空关键位之下回调看空,或背靠下跌通道以高抛低吸为主,突破看多或下破看空为辅。

(有梦分析)当前行情震荡下跌,多空关键位之下回调看空,或背靠下跌通道以高抛低吸为主,突破看多或下破看空为辅。当前行情震荡下跌,多空关键位之下回调看空,或背靠下跌通道以高抛低吸为主,突破看多或下破看空为辅。


(有梦分析)周三黄金计划,多空关键位之上偏多,当前行情震荡上涨,以回调看多为主,或背靠上涨通道高抛低吸,突破多下破空。周三黄金计划,多空关键位之上偏多,当前行情震荡上涨,以回调看多为主,或背靠上涨通道高抛低吸,突破多下破空。

11/19 ETH纽约夜盘分析1.今早亚洲开盘,价格快速下杀,日线上引线还未形成,在未有效突破日开站稳还是看空。
2.伦敦持续抛压后,在4HOB中线附近收线向上寻找高成交区域积累筹码。
3.向上重点关注测试日开的反应,向下注意12开的测试反应。
4.日内关键价格3121(日开) 3071(12开)3033(昨日POC)
5.整体行情震荡偏空,且晚间凌晨还有FOMC和NVDIA财报消息面,夜间打盘的朋友需要留意。

什么是比特币CME缺口?如何使用BTC缺口指标什么是比特币CME缺口?如何使用BTC缺口指标
CME(芝加哥商品交易所)期货市场中的“缺口”,是观察机构投资者动向的重要窗口之一,也是许多专业交易员密切关注的关键指标之一。
1️⃣ 什么是比特币CME缺口?
CME是机构投资者进入比特币市场的主要渠道之一。
然而,CME比特币期货市场在周末会休市(美国芝加哥时间周五下午至周日下午)。此外,每个工作日收盘后也有一小时的交易中断时间。
相比之下,我们熟悉的现货交易所(如Binance、OKX)是全天24小时不间断运行的。
这种差异导致了“缺口”的出现。尤其是在休市时间较长的周末,缺口通常更大。
看跌缺口(Bearish Gap):当CME市场开盘价低于前一收盘价时出现。这意味着比特币价格在休市期间于现货市场下跌。
看涨缺口(Bullish Gap):当CME市场开盘价高于前一收盘价时出现。这意味着比特币价格在休市期间于现货市场大幅上涨。
心理预期转变(Abrupt Psychological Shift):代表投资者情绪在周末期间出现极端倾向。
未成交订单区(Unfilled Order Blocks):缺口区域被视为潜在的未完成订单(买入/卖出压力)所在的区域。
缺口回补现象(Gap Fill Phenomenon):许多交易者相信“缺口终将被回补”这句话,并将其作为一种交易策略。这意味着价格有倾向向缺口反方向移动,以最终填补缺口区域。然而,这种现象并非“必然”,缺口是否会被立即或延后回补,需要结合多重分析判断。
2️⃣ 轻松找到CME缺口
指标 Bitcoin
CME gaps multi-timeframe auto finder
能够自动识别CME蜡烛图的缺口,并在图表上直观显示。
⚡指标功能与使用方法
多时间框检测(Multi-Timeframe Gap Detection):支持5分钟、15分钟、30分钟、1小时、4小时甚至1天K线!
它可以同时检测多个时间框内出现的CME缺口。不论你是短线交易者还是长线投资者,都可以根据交易风格查看对应缺口。
自动方框与标签显示(Automatic Box and Label Display):检测到的缺口区域会以矩形框显示在图表上。看涨缺口以绿色显示,看跌缺口以红色显示,一目了然。每个缺口的百分比大小也会标注在框上方。
高亮功能(Highlight Function):超过设定阈值(例如0.5%)的大缺口将以更醒目的颜色突出显示。“大缺口”通常对市场影响更大,需要重点关注。
图表价格同步(Chart Price Synchronization):不同交易所的现货价格可能与CME期货价格存在差异。该指标可通过“Chart_price”模式,将缺口框的价格自动调整为当前图表所处的价格水平。
启用此模式后,你可以更直观地在现货图表中观察缺口位置,并直接制定交易计划。
实时提醒(Real-time Alerts):当检测到新的CME缺口时可即时提醒。你还可以设置仅针对特定时间框缺口的通知。这在你无法实时盯盘(例如周末或工作日特定时段)时尤其有用。
3️⃣ 交易策略
💡缺口回补策略(Gap Fill Strategy):
出现看涨缺口时:如果价格突破缺口上方后回落进入缺口区域尝试回补,可在缺口底部附近考虑做多;若价格未能从缺口顶部反弹,可考虑做空。此外,也可在缺口尚未回补前,于上方阻力区布局空单。
出现看跌缺口时:如果价格跌破缺口下方后又回升进入缺口区域尝试回补,可在缺口顶部附近考虑做空;若价格未能从缺口底部继续下跌,可考虑做多。同样,也可在缺口尚未回补前,于下方支撑区布局多单。
💡作为支撑/阻力区域(Support/Resistance Areas):
旧的CME缺口区域在未来价格重新测试时,往往成为强支撑或阻力。
观察价格在触及看跌缺口顶部时是否遇阻下跌,或在触及看涨缺口底部时是否获得支撑反弹。
多时间框重叠的缺口区域往往具有更强的技术意义。
💡趋势确认与反转信号(Trend Confirmation and Reversal Signals):
若出现强势看跌缺口且未被及时回补,价格继续下跌,可能表示强劲的下行趋势开始或延续。
若出现强势看涨缺口且未被及时回补,价格继续上涨,可能表示强劲的上升趋势开始或延续。
你可以通过观察缺口后的价格走势判断市场动能,并结合趋势跟随或趋势反转策略。
例如:若出现看跌缺口,但数日内迅速被回补并突破缺口顶部,这可能是熊市结束的早期信号。
💡多时间框分析(Multi-Timeframe Analysis):
在寻找关键支撑/阻力位时,不仅要查看当前时间框的缺口,还要参考更高时间框(如4小时或日线)的缺口。
高时间框缺口通常代表市场更强的关注区。
在短周期交易中,应将高时间框的重要缺口位置纳入风险控制或入场/出场目标设定中。
短期缺口(5m、15m):多数幅度在1%以内,适用于短线波动、高杠杆剥头皮或日内交易。可用于快速进出场策略,但需防止震荡假信号。多数会在市场开盘后4小时内被回补。
中期缺口(1h、4h):可用于波段或持仓交易。其能否成为关键支撑/阻力,取决于缺口出现后的价格反应。
长期缺口(1d):可能成为市场趋势的转折点或长期关键支撑/阻力区域。若出现“大缺口”,需考虑市场总体方向可能发生变化。多数出现在周末休市时,有时缺口幅度超过3%。
工作日短期缺口,在4小时内被回补。
在周末出现 3.54% 的大幅缺口之后,强劲的上涨趋势持续发展。
4️⃣ 总结
“Bitcoin CME Gap Multi-Timeframe Auto Detector”指标是一款强大的工具,
帮助你在市场中不错过关键的价格波动节点。
但请注意,任何指标都不应盲目信任。
缺口可能不会完全回补,也可能在突破后立即反向运行。
不要仅依赖缺口回补逻辑,应结合其他技术指标共同分析,以提高胜率。
希望你能充分利用该指标提供的信息,
并将其与自身的分析方法(图表形态、辅助指标、宏观分析等)相结合,
构建更完善、更高效的交易策略。
📌如果这篇内容对你有帮助,请点赞或留言支持。
你的鼓励是我们持续创作优质分析与内容的动力。
关注后还可以第一时间接收最新发布的文章通知。


黄金H1 – 特朗普的美联储评论动摇市场情绪🟡 XAUUSD – 日内聪明资金计划 | 作者:Ryan_TitanTrader (19/11)
📈 市场背景
黄金在紧密的修正结构中交易,因为市场对唐纳德·特朗普考虑撤换美联储主席杰罗姆·鲍威尔的突发新闻做出反应。
这一消息为美联储政策预期注入了不确定性,导致美元短期波动,并将黄金置于关键决策区。
• 特朗普的评论增加了对潜在政策转变的猜测,这可能暂时削弱美元情绪。
• 然而,由于机构资金流继续进行流动性清扫,黄金仍被限制在优质供应区以下。
• 价格在关键的美联储相关讨论前徘徊在4080美元附近,保持流动性两侧活跃。
机构订单流显示在折扣范围内的受控积累,而优质区域仍由卖家防守。
🔎 技术分析(1H / SMC结构)
• 结构:价格在4150突破后的多次BOS事件后形成短期分配模式。
• 优质卖出区:4109–4111,与未缓解的供应和内部流动性口袋一致。
• 折扣买入区:4009–4007,位于一个干净的需求区块+先前的卖方清扫内。
• 流动性:
→ 买方流动性位于4111以上,形成等高集群。
→ 卖方流动性位于4007–4000之间,早期的多头头寸被清除。
🔴 卖出设置(优质反应区)
• 入场:4109 – 4111
• 止损:4119
• 止盈:
→ 4055(小幅低效)
→ 4028(BOS重测)
→ 4009–4007(折扣需求)
📌 仅在流动性扫入区域+M5–M15上出现看跌CHOCH后执行。
🟢 买入设置(折扣反应区)
• 入场:4009 – 4007
• 止损:4000
• 止盈:
→ 4040(短期区间高点)
→ 4075(低效反弹)
→ 4105/4110(优质重测)
📌 如果价格扫过4007并显示看涨位移则有效。
⚠️ 风险管理注意事项
• 预计交易者对特朗普关于美联储领导的评论反应会导致波动。
• 在4030–4080的震荡区没有明确结构突破时避免交易。
• 在美元情绪变化的冲动尖峰期间减少头寸规模。
• 一旦价格清除每个流动性口袋后,跟踪止损。
📝 总结
黄金受到特朗普关于替换美联储主席鲍威尔言论的不确定性影响严重。流动性在两个极端积累,在区间边缘提供干净的机会。
• 卖出区:4109–4111(优质供应)
• 买入区:4009–4007(折扣积累)
预计会出现操控→反应→延续模式,因为机构在当前结构的两侧进行操作。
📍 关注@Ryan_TitanTrader获取更多聪明资金更新。
🎁 每日计划的交易者在BIO中有礼物。
