趋势分析


比特币四年周期是否打破?因为我有几年不炒币了,所以操作分析就断了。因为我今年又入金了。所以操作建议又恢复了。
我今天想简单谈谈四年的周期是否被打破了。这次和牛市和上次有所不同。上次牛市是两次高峰测试顶点。这次是牛市延长了一年。按照道理来说,25年本应该是熊市,但是市场没有按照剧本下行,在新的情况下,反而创造了新高。
所以有不少朋友,认为比特币四年的周期已经被打破了。
对于这个看法,我是持有保留观点的。
25年的牛市的延续确实比较意外,但是和21年的双高峰本质上并没有区别,还是牛市的延续,机构资金在市场后续介入,本质上是对追高利润的一种追逐和延续。这些机构都是倾向于在牛市追高,在熊市他们并不会抄底,因为虽然抄底利润更大,但是这意味着更高的风险,他们是不会承受这种风险的。他们会更倾向于在上涨过程中追高。因为这更安全,无论下跌还是上涨,都是有惯性的。
机构资金介入和美国相关一系列法案通过是有直接相关性的,资金资金和meme剩余资金合流造成了25年的尾部牛市。
华尔街等老钱对于加密货币全部的归拢,其实是一个过程,我认为时间可能会长达数年,在这个过程中,美国的各种金融法案是会陆续出台的。但是整体过程是非常长的。美国是一个法案治国的国家。法案和资金的介入都要一个过程。
比特币从09年诞生以后,四年周期就没有变化过,对于一个从未改变过的周期,如果他要改变,不是一瞬间或者一个周期内就会改变的,她的改变会持续很长时间和几个周期一点一点的改变。和主力资金大规模的改变。在K线会呈现非常明显的变化,但是目前我还没有看到这种变化。
从技术形态上来讲,月K已经三个月连续收阴线,这实际上已经改变了K线和比特币的走势了。这意味着整体环境和人心的巨大变化。熊市不可阻挡的来了。四年周期不仅仅是行情行情的周期,更是人心的周期。人心会变,但是不会一天之内就变化。这需要一个过程。
所以整体来看,我认为四年周期已经变化的证据不足。

2026年1月18日黄金市场结构及后期可能走势目前结构是空头结构,但是从结构上看周五的一波下探实际上也只是把之前上涨的不平衡给平衡掉了,4小时macd实际处于高位本周,此次下跌的动能其实不大,4小时图实际上在高位盘整整理,大有继续向上的感觉,消息面也是利多,特朗普又搞格陵兰岛,开始加关税威胁,周一观察高点是否被突破,有没有出现反转结构,如果出现了则可在下方订单块试多。

Chumtrades XAUUSD H2|流动性扫完了吗?还是市场还想再往下?上周五,市场在 特朗普(Trump)关于 Kevin Hassett 的表态后出现明显波动。
特朗普表示,他更希望 Hassett 继续留在原有岗位,而不是出任新的角色。
👉 受此影响,金价快速下探并扫到前高(ATH)区域,约 4530–453X,随后 重新收于 456X 之上。
这也引出了当前的核心问题:
这一次是否已经完成对 BUY 端流动性的清洗,
还是市场仍计划测试更低的价位?
接下来一周,政治因素将成为影响金价走势的关键驱动。
📰 本周需要重点关注的政治因素
1. 特朗普 – 格陵兰
美国对 不支持格陵兰并入美国的国家征收 10% 关税
不排除 提高至 25%
期限无限,直到格陵兰成为美国的一部分
→ 在地缘政治不确定性上升的背景下,对金价构成支撑
→ 可能 直接影响周一开盘走势
→ 若价格对消息反应强烈,不建议在近端压力区做 SELL
2. 伊朗 – 抗议事件
需关注 特朗普是否再次直接介入
→ 潜在的 突发消息型波动风险
🟢 重点支撑区域
4530 – 4535
4515 – 4510
4480 – 4482
4462
4410 – 4407
🔴 重点压力区域
4618 – 4628
4648 – 4650
4655 – 4660
4698 – 4699
⚠️ 交易提示
价格区域仅用于 观察,并非触及即进场
462X 附近的 SELL 必须结合 消息与价格反应
若消息推动动能快速放大 → 选择观望,避免逆势交易
💬 本周思考的问题
市场是在 完成最后一轮流动性收集,
还是上周五的扫荡 已经结束,准备进入下一段行情?
📌 关注 Chumtrades,获取主动型市场分析、清晰的交易规划与风险管理思路。

美国和伊朗的战争加剧基本面
沙特阿拉伯、土耳其、卡塔尔、阿曼和埃及等国一直敦促白宫保持克制,并发出警告。
如果美国对伊朗政权发动袭击,可能会对伊朗的邻国造成损害和地区失控,包括导致全球油价上涨。然而供应与航运一旦受扰,风险溢价飙升,全球通胀/衰退风险上来,反而会伤害他们的长期财政与投资环境
特朗普对 8 个欧洲国家所有输美商品加征“额外”关税后,欧盟计划在特朗普关税威胁下终止与美国的贸易协议。
1/19周一长周末
1/22周四 21:30 美国至1月17日当周初请失业金人数(万人)
美国11月核心PCE物价指数年率
这周收线收在4596 之上,我依旧认为回踩看北。
在目前震荡区域:4620-4580区域内,跌下去低多要长拿了
开盘关注4600 有没有突破 突破不了回来4580不破等待信号进场
关键位:4642/4640-4630-4620-4600-4595-4580-4563/60-4550
⚠️仅个人看法


19-20日黄金做多计划上周五在消息面的加持下,价格在美盘极速向下清除了左侧的低阻力流动性池,随时抵达4H 看涨FVG 50%区域后又快速拉回到了1H OB+区域内。
周一期望价格高开,突破周五高点4621后形成结构反转,下方30M看涨OB就会生效,它将是一个摆动点OB,随后再耐心等待价格回到4575区域,在5M图表上观察价格是否会极速反转并创造新的OB+FVG,配合2022模型建立多头仓位,自行分阶段止盈,留尾仓推保护看历史新高。
周一价格如果高开后没有动力,再极速向下,不要追空,仍然关注
4575区域的反转机会。
日内短空机会在频道内更新。新手谨慎做空,耐心等待多头机会。
基于SMC流动性思考,仅做交流学习,请勿盲目跟单。新的一周,祝大家翻仓。

请不要继续坚持美股泡沫爆破的想法给同志们送上迟来的新年快乐!
去年年末标普最高点位是6986,还是没能突破7000点。估计近期还要会上破7000大关,毕竟上升三角实在是经典得非常老套。继续上破估计是大概率事件。
估计上破后的跟进速度不会太慢。川武大帝的美丽法案的减税福利在第一季就要到账了。
而且这年头,全民都得炒股。不然就是给通胀当义工。现在的z世代没几个会像父辈殷勤在企业打工至退休。炒股才是他们的出路。
现在自媒体的泛滥成灾,不可能学不会炒股。只要足够时间,核弹怎样做也能在youtube学到。更何况现在有AI。所以全民炒股的时代要来了。流入股市的钱可能是我们难以想象。
回想两三个月前,市场都在担心泡沫,估值,市盈率什么的。现在好像都什么没感觉了。担心这个那个其实只是因为担心指数位置太高而已。
指数过高自然要有卖盘。但是在股市里没有绝对,一切全是相对。所以我还是认为看图形最能看清楚真实的相对高低。
扒了一下过去几十年标普200周和50周的标准差。基本上能找到美股触顶的一个规律。虽然不能精准看出那一天触顶,但是能预警将要触顶。或者在触顶后,在小跌到自由落体之间的时期作出卖出预警。
从80年代开始看,第一点,标普触顶前,200周标准差在20%以上会与指数本身开始背离。就是说指数继续涨,或平走时,200周标准差基本是开始整体往下走。
第二点,当200周与50周标准差同步下跌,且50周标准差接近零线时,例如跌破3%左右。那时候基本上是顶部了。
第三点,当50周标准差触碰零线,橙色竖线表示出的时期,标普之后全是继续下跌,也基本上是继续大跌。
但其中一点要注意,1987年,2018年,以及2020年,200周和50周标准差是一并上涨,但啪一声就下跌。这是非结构性的黑鹅事件。2018年和2020年分别是关税1.0和疫情。而1987年,现在普遍认为是当时新的电子交易系统太快,太先进所致的闪崩。
这些都无解,不能从标准差判断。停,2025的关税2.0不该也是黑鹅吗?且看50周标准差,很早就已经和200周标准差,以及指数本身背离。然后2024年11月200周标准差开始与指数背离。
我的看法是标普本身一早就出现结构问题,而对等关税只是后来雨点太大,而让人忘记了先前的雷声。小弟不才在去年2月凭50周标准差看到不妙,并且侥幸逃了个顶。
然而到目前为止,这两组标准差没有给我任何的警号。相反,两三个月前我判断当时大几率是结构牛市起点。
所以,现在再一直认为这泡沫很大,而且就在眉睫,我觉得不太实际。人很容易被环境影响,但图形就是真实的量化结果。数据永远比人可靠,因为人很多时候会做违心的事。
回想我二十多年前一边脑子了讨厌周杰伦,但又不知道为何会花巨款买下他的范特西。当有人上午说科技泡沫,下午大手买入AMD。不用稀奇,这是潜藏在人内心的趋利性。
总结,我觉得美股没有到谈论顶部的时候,泡沫不泡沫就更不用谈。那2000年作参照,现在两组标准差和当时就很不一样。
但板块轮动的确存在,不过经验谈,科技股估计不久就赶上来。我觉得这是机构持仓组合的因素,难度他们会期待美国的工业股能帮助他们刷亮业绩吗?泡沫论渐渐冷却,再降降息,估计科技板块会追上来。
暂时是这些。没有犀牛,天鹅什么的,美股即便有些调整,整体上大概率没问题。问题在于往上空间有多少而已。

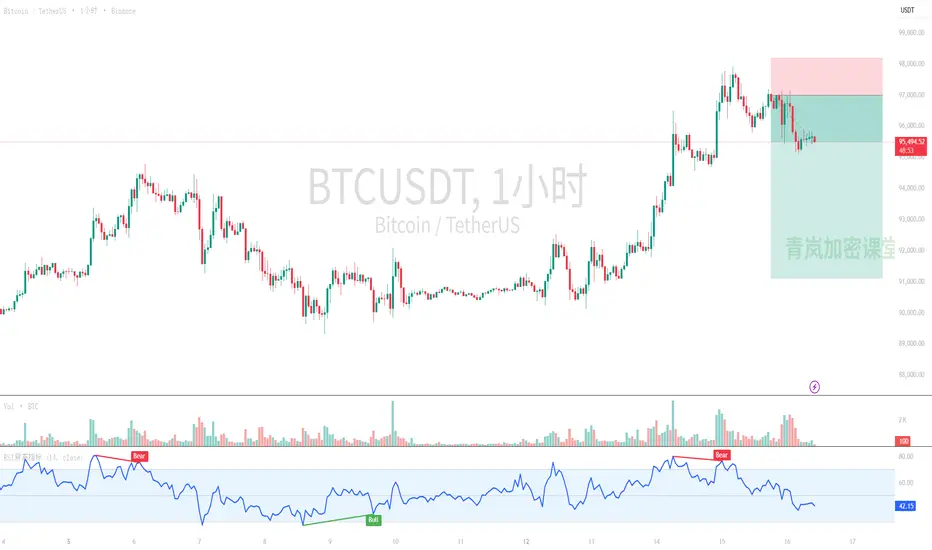
青岚加密课堂:2026年1月18日早间BTC行情分析欢迎来到青岚加密课堂,咱们今天对BTC 四个周期包括消息面进行分析:
咱们从技术面来详细看看各个周期的表现吧。
* 15分钟 K线图: 短线来看,情况不太妙哦。最新的几根K线都是红色的,价格持续向下。咱们看看均线(MA)就知道啦,MA5、MA10、MA20都呈现出空头排列,而且都向下发散,这明摆着是个短期下跌趋势。MACD指标呢,DIF和DEA都深陷零轴下方,并且还在继续往下走,MACD柱状图也是负值,而且越来越长,这说明短期的空头力量是相当强劲的。RSI指标也在35-40这个比较低的区间晃悠,虽然接近超卖,但还没看到明显的反弹迹象。所以呀,超短线操作,得非常谨慎,甚至考虑空单机会呢。
* 1小时 K线图: 比特币在短线尝试反弹了一下,但很快又撑不住了,继续走弱。你看,前几个小时MACD柱状图还转正了呢,可现在又变回负值了,而且DIF和DEA也开始向下发散,MA5也下穿了MA10。这表明多头力量在短期内没能站稳脚跟,空头又重新夺回了主动权。RSI也从50多回落到了40出头,说明买盘的动能明显不足。咱们得注意,小时图的反弹失败,可能会带来更深的短线回调哦。
* 4小时 K线图: 中期趋势这里,咱们要特别注意了。价格在经历了一段上涨后,最近开始出现回调压力。虽然咱们的MA5和MA10一度在MA20上方,但最新的数据来看,MA5和MA10的距离非常近,都在向下运行,而且都在MA20下方了。这可不是个好兆头,说明中期上涨动能正在减弱,甚至可能已经进入了盘整或者回调阶段。MACD的DIF和DEA虽然还在零轴上方,但你看,它俩也开始向下交叉了,柱状图也从正转负并持续扩大,预示着中期下跌的动能可能会加强。RSI指标在50-55区间向下,进一步确认了中期动能的衰减。
* 1日 K线图: 咱们把目光放长远一点,日线图的长期趋势还是很健康的。尽管最近几天价格有些回调,但总体来看,MA5、MA10、MA20依然保持着多头排列,并且都向上倾斜。这说明比特币还是处在一个非常强劲的长期上升通道里。MACD的DIF和DEA线都在零轴上方保持金叉向上,MACD柱状图也是正值,表明长期的多头力量依然主导市场。RSI指标虽然从高位稍微回落了一点,但仍然保持在60以上,处于强势区域,说明市场整体情绪还是偏乐观的。所以,长期看好比特币的大方向,这个回调更像是牛市中的一次健康调整。
好啦,技术面咱们看完了,咱们再结合一下消息面,做个综合判断和做单思路哈。
从消息面来看,有一个非常振奋人心的消息,那就是比特币ETF强势吸金14亿美元(新闻19、9),机构资金正在持续涌入,这可是长期看涨比特币的强大基本面支撑!连Coinbase的CEO都出来辟谣说白宫和加密行业关系没那么差(新闻8),也算是给市场吃了个定心丸。这都说明比特币的大方向是乐观的。
但是,咱们也看到了CryptoQuant的报告指出,“比特币需求回升但熊市未改”(新闻7),还有月底820亿美元的期权到期(新闻36),可能会带来短期的市场震荡。再加上Jefferies的策略师提到量子计算对长期比特币存储价值的潜在威胁(新闻26),这些都在提醒咱们,短期波动和潜在风险是存在的,不能盲目乐观。
而山寨币方面呢,像ZKP(零知识证明)技术被反复提及,什么6000倍、5000倍的潜力(新闻2, 5, 20, 34, 50),预售项目也层出不穷,比如Pepeto(新闻4, 12, 18, 22, 27)被早期DOGE/PEPE投资者看好,还有DOGE近期也飙升了25%(新闻16)。这说明市场上的风险偏好在上升,有部分资金正在寻求高倍回报的机会,从比特币流向了一些新的或有叙事的热点山寨币。但是呢,像SHIB出现了“死亡交叉”和期货资金流出(新闻23, 32, 37),ETH活跃用户破800万但价格停滞不前(新闻30),这些都说明山寨币市场也并非一片大好,而是分化非常严重的。
综合所有这些分析,咱们的预判和做单思路是这样的:
* 长期趋势(1日图):上涨。 尽管短期有回调,但日线级别的MA均线多头排列,MACD金叉上行,以及持续的ETF机构资金流入,都明确指向比特币的长期牛市格局。对于长期投资者,目前的回调可以被视为逢低吸纳的机会。
* 中期趋势(4小时图):震荡/回调。 4小时图的技术指标显示出多头动能减弱,有进入盘整或回调的迹象,特别是MACD死叉向下。这可能意味着在大的上涨趋势中,正在经历一个中期的调整期。
* 短期趋势(1小时、15分钟图):下跌。 最短期的走势非常疲软,均线空头排列,MACD持续下行,显示空头占据主导。
关键支撑位和阻力位:
* 上方阻力: 短期看,95200-95250是 immediate 的压力区。往上,95400-95500(1小时/4小时图的近期高点和MA20附近)会是较强的阻力。再往上,95800-96000是中期重要阻力。而咱们之前冲高的97000-97900区域,更是上方的强阻力。
* 下方支撑: 短期看,95050-95100是 immediate 的支撑。如果跌破,94800-94900(1小时图前低)是下一个观察点。更强的支撑在94500-94293(4小时图前低)。日线级别的MA10(大约93700附近)是一个非常关键的长期支撑。
可能出现的反转形态:
鉴于当前短期和中期都在回调,但长期是上涨的,咱们要关注几个点:
1. 短期止跌企稳: 在15分钟或1小时图上,如果价格能在94800-94900或94500区域形成双底、头肩底等底部反转形态,并伴随成交量放大,MACD出现金叉,那可能会是短线超跌反弹的信号。
2. RSI背离: 如果价格继续下跌,但RSI指标不再创新低,形成底背离,这往往是反弹的早期信号。
3. 大周期均线支撑: 如果价格回调到日线MA10(约93700),甚至日线MA20附近,并在这里获得支撑,走出阳线吞噬形态,那将是长期多头继续发力的表现。
做单思路呢,咱们可以这么来:
* 短线交易者: 鉴于15分钟和1小时图的短期弱势,咱们可以考虑逢高做空,目标看向94800-94900,甚至94500附近。但一定要快进快出,严格止损,毕竟大趋势是多头,这种短期空单风险相对较高。如果价格触及强支撑,并且出现止跌信号(如放量拉升、MACD金叉),也可以尝试小仓位抢个反弹。
* 中线交易者: 4小时图显示动能减弱,中期可能在调整。咱们可以暂时观望,不急于入场。等待价格在中期重要支撑位(例如94500-94293或者日线MA10附近)企稳,并且MACD、RSI等指标给出明确的看涨信号时,再考虑建仓或加仓。
* 长线投资者: 长期趋势依然是上涨的,机构资金在不断流入。对于长线持币者,目前的回调正是健康调整,可以在94500以下,特别是日线MA10(93700左右)甚至MA20附近,分批进行定投或抄底,为下一波上涨做好准备。
总的来说,咱们的市场就像这南方的天气,变化多端,短期阴雨,中期多云,但长期来看,阳光总会再来!
-------------------------
受限于图表篇幅和平台合规准则,行情分析有时效性,最新的分析已更新在我的青岚加密课堂:qinglan.org 或欢迎点击我的头像关注我,通过主页展示的渠道进行更多技术探讨。
最后送给大家一句交易金句:“面对市场的风浪,保持冷静的头脑,才能看清潮汐的方向,稳稳地抓住属于咱们的机会。”


黄金周线在4682供给与4420需求之间轮动🟡 XAUUSD – 每周智能资金计划 | 作者: Ryan_TitanTrader (17/01)
📈 市场背景
黄金在高时间框架上结构性看涨,但周线价格走势明显转向受控的智能资金轮换。在提供买方流动性进入高价之后,继续上扬已停滞。
本周的主要驱动力 — 美元波动性、美国收益率的重定价,以及在持续高通胀数据与地缘政治对冲流动下的美联储降息预期 — 正在创造诱导和流动性工程的理想条件,而非干净的趋势扩展。
由于风险情绪脆弱且头寸拥挤,黄金在极端情况下表现出典型行为:反转、假突破和均值回归,而不是冲动性的继续上扬。
🔎 技术框架 – 智能资金结构 (H4–H1)
当前阶段:
高时间框架的看涨偏向仍然有效,但内部结构显示在提供流动性后从高价中分配。
关键思路:
从高价供应中卖出反应,或耐心等待更深的回调进入高时间框架需求以重新建仓多头。
结构性备注:
• 高时间框架的突破确认看涨主导
• 买方流动性已在近期高位被吸收
• 清晰的轮换通道已形成
• 流动性短缺区域充当磁铁
• 折扣需求与之前的订单簿 + 通道支撑对齐
💧 流动性区域与关键水平
• 🔴 卖出黄金 4680 – 4682 | 止损 4690
• 🟢 订单簿买入黄金 4420 – 4418 | 止损 4410
🧠 机构流动性预期
流动性扫荡 → 多重结构转换 / 上下转换 → 突破 → 位移 → 订单簿 / 杰出流动性回测 → 扩展或更深的轮换
🎯 执行规则
🔴 卖出黄金 4680 – 4682 | 止损 4690
规则:
✔ 价格触及高价通道供应
✔ 买方流动性已在近期高位被吸收
✔ H1–M15 的看跌多重结构转换 / 上下转换
✔ 下行突破确认分配
✔ 通过看跌杰出流动性或供应订单簿入场
目标:
• 4620 — 内部反应
• 4560 — 流动性短缺
• 4480 — 更深的周线轮换
• 积极止损(分配策略)
🟢 订单簿买入黄金 4420 – 4418 | 止损 4410
规则:
✔ 刷新的每周折扣区域
✔ 强烈的重叠:高时间框架的订单簿 + 通道支撑
✔ M15–H1 的看涨多重结构转换 / 上下转换
✔ 伴随位移的冲动性突破
✔ 通过精细的看涨订单簿入场
目标:
• 4560 — 首次反应
• 4620 — 中区流动性
• 4680+ — 如果扩展恢复则继续
⚠️ 风险备注
• 高价区域 = 流动性陷阱
• 在宏观新闻中预期假突破
• 没有多重结构转换 + 突破不进入
• 在高时间框架极端处降低风险
📍 摘要
黄金在结构上看涨,但本周的关注点在于精准执行,而非预测:
• 高价可能从 4680–4682 提供智能资金卖出,或
• 在 4420–4418 的折扣区域可能重新建仓多头以准备下一个冲动性走势。
让流动性先移动。
让结构第二次确认。
智能资金掌控 — 耐心是有回报的。⚡️
📌 关注 @Ryan_TitanTrader 获取每周智能资金黄金解读。

黄金在4672供给与4560需求间波动🟡 XAUUSD – 日内智能资金计划 | 作者:Ryan_TitanTrader (16/01)
📈 市场背景
黄金在更高的时间框架上保持结构性看涨,但日内价格走势已转向受控的轮换。由于今日的热驱动因素——美元波动性、美国收益率波动以及持续的美联储降息预期——智能资金不再推动延续性。相反,流动性正围绕溢价和折扣区间进行安排。
在美国宏观头条和与通胀相关的预期即将公布之际,黄金在极端情况下的表现符合预期:诱导、止损狩猎和均值回归,而非冲动的趋势延伸。
🔎 技术框架 – 智能资金结构 (H1–M15)
当前阶段:
高时间框架看涨偏向保持不变,而日内结构在买方流动性被提取后显示出修正性轮换。
关键观点:
寻找来自溢价供应的分配或更深回撤至折扣需求以重新建仓买入。
结构性笔记:
• 高时间框架BOS确认看涨主导
• 买方流动性已被提取
• 价格在旋转,而非冲动扩展
• 内部FVG作为下行磁铁
• 折扣需求与之前的OB支撑对齐
💧 流动性区域和触发器
• 🔴 卖出黄金 4670 – 4672 | SL 4680
• 🟢 买入黄金 4561 – 4559 | SL 4551
🧠 机构流动性预期
流动性扫荡 → MSS / CHoCH → BOS → 位移 → OB/FVG回测 → 扩展
🎯 执行规则
🔴 卖出黄金 4670 – 4672 | SL 4680
规则:
✔ 价格触及溢价供应
✔ 高点以上的买方流动性被提取
✔ M5–M15上的看跌MSS / CHoCH
✔ 明确的下行BOS
✔ 通过看跌FVG或供应OB进入
目标:
• 4620 — 内部反应
• 4585 — 流动性池
• 积极止损(分配操作)
🟢 买入黄金 4561 – 4559 | SL 4551
规则:
✔ 进入折扣需求
✔ 与OB + FVG重合
✔ M5–M15上的看涨MSS / CHoCH
✔ 强劲的上行BOS并伴有位移
✔ 通过精炼的看涨OB进入
目标:
• 4620 — 首次反应
• 4670 — 内部流动性
• 4700+ — 如果扩展恢复则继续
⚠️ 风险笔记
• 溢价区间 = 流动性陷阱
• 预计在新闻波动期间会有假突破
• 未经MSS + BOS不可进入
• 接近极限时减少仓位
📍 总结
黄金从结构上看是看涨的,但今天关注的是执行,而不是预测:
• 溢价可能在4670–4672处提供智能资金卖出,或
• 在4561–4559的折扣可能会为下一个更高的涨幅重新建仓。
让流动性先行动。
让结构确认第二。
智能资金掌控——耐心有回报。⚡️
📌 关注 @Ryan_TitanTrader 获取每日智能资金黄金解析。

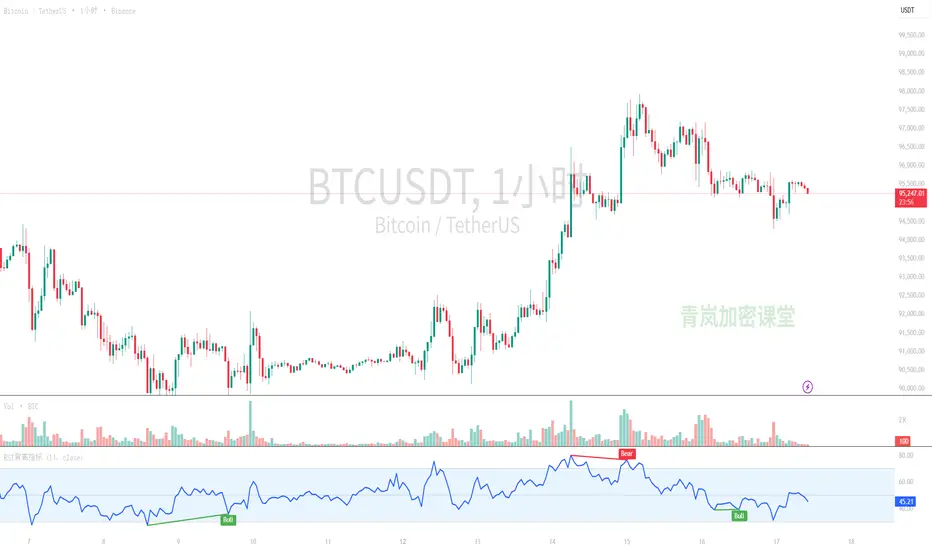
青岚加密课堂:2026年1月17日早间BTC行情分析欢迎来到青岚加密课堂,咱们今天对BTC 四个周期包括消息面进行分析:
从短周期看(15分钟K线)
最近趋势:从昨天晚上到今天早上,比特币在95700附近冲高后,就明显开始回落了。尤其是在今天凌晨1点多那会儿,有个明显的下跌,从95574直接跌到了94535附近,然后虽然有反弹,但力量不足,现在又在95200附近震荡下行。
MA均线排列:15分钟图上,短期的MA5、MA10已经死亡交叉了MA20,并且三条均线都向下发散,价格更是跑到了所有均线的下方,这可是很明显的空头排列哦,表明短期压力山大!
MACD/RSI:MACD指标在今天早上8点半左右形成了死亡交叉,DIF线在DEA线下方运行,绿柱子也在不断增长,这妥妥的就是短期的看跌信号。RSI呢,现在在42左右,离超卖区不远,但也说明多头力量很弱。
总结:短期来看,市场情绪偏悲观,处于下跌趋势中寻找支撑。
从中周期看(1小时K线)
最近趋势:1小时图上,从前天(1月15日)的97000上方高点下来,一直都在震荡走低。虽然中间也有小反弹,但都未能有效突破前高,每次反弹后又会再次探底。最近几个小时,价格基本维持在95000-95500的区间内波动。
MA均线排列:1小时图的MA均线也是呈现空头排列,MA5、MA10、MA20都向下拐头,价格被均线压制得很厉害。你看,现在K线就在这些均线下方,说明中期也处于一个回调或者说是震荡偏空的阶段。
MACD/RSI:MACD指标虽然在今天凌晨4点多那会儿短暂金叉,但DIF和DEA都还在零轴下方,这说明那只是一个下跌过程中的小反弹,整体空头趋势没有改变。现在MACD的绿柱子还在继续,RSI在45左右,动能不足。
总结:中期来看,市场正在经历一个回调震荡的阶段,上方阻力较大。
从长周期看(4小时K线)
最近趋势:4小时图的走势比短周期和中周期要复杂一些。从1月13日开始,比特币从91000附近开启了一波反弹,一度冲高到97000上方。但随后就出现了回落,近期的K线实体逐渐变小,并且出现了几次长上影线,说明上方卖压在增加。现在价格回到了95200左右,从高点下来已经有了不错的跌幅。
MA均线排列:MA5均线已经向下穿越了MA10和MA20,形成了死亡交叉。而且,价格也回到了所有短期均线下方。这说明反弹的动能已经衰竭,市场重新回到了调整或下跌趋势中。
MACD/RSI:MACD指标在1月16日凌晨也形成了死亡交叉,DIF线和DEA线虽然还在零轴附近,但DIF线正在快速向DEA线靠拢,绿柱子也开始出现了。RSI在53左右,从之前的强势区回落,这都是动能转弱的明确信号。
总结:长期来看,大方向依然在调整或探底过程中,目前的反弹已经结束,进入了新一轮下跌阶段。
从超长周期看(1日K线)
最近趋势:日线图显示,比特币在经历长期下跌后,近期有所反弹,但整体仍处于低位震荡格局。最近几天的K线都在回调,且上影线明显,说明反弹遭遇了较强的抛压。
MA均线排列:日线图上,MA5均线虽有上翘,但MA10和MA20等中长期均线仍呈空头排列或走平,价格在均线系统附近反复争夺,尚未形成稳固的多头格局。
MACD/RSI:日线MACD在低位有金叉迹象,但DIF和DEA线都还在零轴下方,红柱子虽有缩短,但整体动能依然偏弱。RSI在50左右徘徊,处于中性偏弱区域,说明市场做多信心不足。
总结:超长周期来看,整体市场仍处于熊市格局中的反弹或震荡筑底阶段,上方面临重重阻力。
消息面结合与综合判断
咱们的消息面啊,可以说是一个“冰火两重天”!
利好消息方面,有一些积极的信号:
【1】比特币需求超发行量6倍,ETF带来一定资金流入。这在熊市中提供了局部支撑。
【25】【31】白宫确认查获的比特币不会出售,将纳入国家储备。这在短期内减少了市场的一部分潜在抛压。
【37】比特币日线出现技术性反弹信号。这与日线图上的反弹阶段相呼应。
其他消息,如Anchorage Digital计划IPO、Solana的RWA突破10亿美元、新的加密项目预售等,表明加密生态在逆境中仍在寻求发展,但难以逆转大趋势。
但更多是需要注意的风险信号:
【45】有分析师警示比特币可能只是技术性反弹,认为投资者转向黄金,这提醒我们反弹的脆弱性和可能存在的下行风险。
【50】比特币交易量有所下降,这与K线图上观察到的反弹动能减弱是吻合的,表明追涨意愿不强。
【24】【43】【48】一些国家对加密货币的监管趋严,比如法国MiCA许可和韩国的APP下架风险,这构成了持续的监管压力,限制了市场的风险偏好。
整体而言,消息面难以提供推动市场进入新一轮牛市的强劲动力,更多是对下跌趋势的缓冲或弱反弹的刺激。
咱们的预判与做单思路
综合来看,咱们可以得出这样的判断:短期(15分钟、1小时)和中期(4小时)的比特币正处于反弹结束后的新一轮下跌或震荡下探阶段。长期(1日)来看,比特币整体仍处于熊市格局,任何反弹都可能是逢高减仓或做空的机会,真正的底部需要更长时间来确认。
做单思路,咱们得顺应主要趋势,谨慎操作:
短期交易员(剥头皮/日内):
目前价格在95247附近,短期偏弱。上方第一阻力位在95500-95600,这是15分钟和1小时均线的压力区。如果反弹到这里受阻,是较好的短空入场点,止损放在95800上方。
下方关键支撑位在94700-94500,这里是前几次下跌的低点。如果价格跌破此区域,可能加速下行,可顺势跟空或观望。
咱们要特别留意94200-93800这个区间,那是4小时图上一个重要的支撑区域,如果被有效跌破,可能打开更大的下跌空间。
中长期投资者:
熊市中的反弹是调整仓位的机会,而非追涨的理由。
如果价格反弹至96000-97000等强阻力区域,可考虑分批减仓或建立对冲空单。
如果市场继续下跌,不要轻易“抄底”。真正的底部结构需要时间来形成。耐心等待市场出现明确的、稳固的筑底信号(如长期横盘、量价背离等)再考虑分批布局。
可能的反转形态:
短期如果反弹无力,在95500-96000区域形成“头肩顶”或“M头”,并向下突破颈线,将是确认下跌趋势延续的信号。
反之,如果价格能强势突破并站稳97000以上,并伴随成交量持续放大,才可能扭转短期下跌趋势。但在日线级别的熊市背景下,这种可能性较小。
总结一下: 短线是下跌或震荡下行,咱们应以逢高做空或观望为主;长线是熊市,这次反弹结束后的下跌是市场寻找真正底部的过程。
记住咯,熊市里每一次反弹,都是为了套住追高的人,而不是让你盲目冲锋,真正的机会需要耐心等待市场走出明确的底部结构。
-------------------------
受限于图表篇幅和平台合规准则,行情分析有时效性,最新的分析已更新在我的青岚加密课堂:qinglan.org 或欢迎点击我的头像关注我,通过主页展示的渠道进行更多技术探讨。
2026年1月16号 BTC走势分析从大级别来看 目前已经突破了短期的前高94500 大方向上我依然看多 理由如下
从A点的下跌并没有走成驱动浪 从B点的上涨到A点已经形成了驱动浪 所以现在B点到A点可能是C浪(5浪)的第1个子浪 回调以后继续上涨 回调的目标位在94500的左右 94500 是三线共振的地方 是BA回调的0.5 是前期的高点 同样也是A点回调走双锯齿的最低目标位(双锯齿 WXY Y至少是W的0.9倍)


(有梦分析)白银多空关键位之上偏多,以回调看多为主,或背靠上涨通道高抛低吸为主,突破看多下破看空为辅,多空关键位之上偏多,以回调看多为主,或背靠上涨通道高抛低吸为主,突破看多下破看空为辅,每一次进场必须要有信号而且背靠关键位。

(有梦分析)周五黄金计划多空关键位之上偏多,当前行情区间震荡,以高抛低吸为主,突破看多下破看空为辅,周五黄金计划多空关键位之上偏多,当前行情区间震荡,以高抛低吸为主,突破看多下破看空为辅,每一次进场必须要有信号而且背靠关键位

地缘政治紧张局势推动黄金需求宏观与基本面背景
地缘政治风险升级、地区冲突持续以及政治不确定性上升,继续推动全球市场的避险情绪。
在这种环境下:
由于对安全的需求与政策灵活性的预期竞争,美元表现出混合反应。
在不确定性中,资本转向避险资产,黄金仍然得到结构性支持。
只要全球紧张局势未解决,黄金的下行走势可能是修正性的,而非趋势突破。
技术结构(H1)
黄金仍处于看涨市场结构中,已通过多次结构突破(BOS)得到确认。
当前的回调正在展开为堆叠的公平价值缺口(FVG)——这是上升趋势中的典型再平衡阶段。
目前没有确认的看跌结构突破。
关键价格区间
日内阻力位:4,581
上部FVG:4,569.369
中部FVG:4,545.716 – 4,535.432
深部FVG / 结构支撑:4,512.551
情景(如果 – 那么)
情景1 – 看涨再平衡
如果价格保持在4,535.432 – 4,512.551之上,预计买家将介入。
若恢复至4,581以上,将重新打开通往4,620+的路径。
情景2 – 更深的流动性扫荡
在看涨结构内,深入回调至4,512.551仍可接受。
只有明确的H1收盘低于4,512.551才会削弱看涨偏向。
总结
黄金对全球不确定性作出反应,而不仅仅是技术面。
只要地缘政治风险持续,逢低买入仍是主导思维。
避险资金流向有利于黄金。
结构定义了偏向。

欧元行情大局以及趋势分析从更高时间框架观察,欧元目前正处在一个有望在未来数月,甚至数年内维持整体多头结构的关键位置。无论从趋势通道、结构层级,还是周期节奏来看,欧元的中长期方向均明显偏多,上行潜力有可能显著高于 2020 年形成的阶段性高点。
需要强调的是,在多头推进过程中,价格不可能以单边方式持续上涨。期间大概率会出现多次持续数周,甚至数月级别的回调与整理,这些回撤更多体现为趋势内部的结构修正,而非趋势反转的信号。从大级别视角判断,任何阶段性下跌都应被视为长期多头趋势中的正常调整。
在关键结构上,只要价格始终维持在 2025 年 11 月低点之上,欧元的大级别多头格局便依然成立。该位置可视为当前长期趋势的核心防守区,一旦得到持续确认,后续上涨空间将具备进一步扩展的基础。
综合趋势结构、周期延展性与宏观背景判断,欧元的整体多头趋势预计至少可延续至 2026 年,且不排除在更长时间维度上继续向上演进的可能。整体而言,短期波动不改方向,欧元当前仍处在以时间换空间的中长期多头布局阶段。
免责声明: 其中的信息和发布内容不构成也不代表金融、投资、交易或其他类型的建议。

原油 CRUDE 趋势与基本交易策略周线复合:Mixed混合;尽管周线动能处于震荡状态,但下周只要略微收⾼,就能形成多头反转。
日线复合:在日线⾼点完成之前,原油仍应再保持 2–3 天的净多头⾛势。
关键因素:周五收盘价站上 12 月 23 日的次级摆动⾼点收盘价,这是周线低点已经完成的初步信号。若日线与周线收盘同时站上60.08,将确认⼀个周线低点已经形成。
交易策略建议:在日线收盘⾼于 60.08 之后,可采用做多交易策略。⽌损应设定为:不远于日线收盘跌破 55.99。
⚠ 短期交易者应以TradingBox信号系统为准!

青岚加密课堂:2026年1月16日早间BTC行情分析欢迎来到青岚加密课堂,咱们今天对BTC 四个周期包括消息面进行分析:
1. 技术面分析:短、中、长期趋势解读
短期(15分钟 & 1小时):回调压力明显,但有企稳迹象
趋势: 最近15分钟和1小时的K线图都显示,比特币从高点97000美元附近经历了一波比较明显的下跌。价格目前在95500美元附近震荡,整体是短线回调的趋势。
MA均线: 在这两个周期里,MA5、MA10、MA20已经呈现出明显的空头排列(短线均线在长线均线下方),说明短期卖压还是挺大的哦。
MACD: 15分钟图的MACD虽然DIF还在DEA下方,但柱子(MACD_bar)已经转正,这暗示着短线有企稳反弹的动能。不过,1小时图的MACD就没那么乐观了,DIF还在DEA下方,且柱子也是负值,并且MACD整体呈现死亡交叉后的下行趋势,表明空头力量依然占据主导。
RSI: 两个周期的RSI都在42-43附近,已经接近超卖区域了,这通常会带来一些技术性反弹。
中期(4小时):牛市中的健康回调
趋势: 咱们看看4小时图,虽然最近这几根K线也是回调的,但拉长到最近60根来看,比特币可是从90000美元附近一路涨到97000美元的。目前的下跌更像是一次上涨途中的健康回调。
MA均线: 价格跌破了MA5和MA10,但目前还在MA20上方,这说明中期趋势还没有完全走坏。MA20均线(大约在94949美元)现在成了非常关键的支撑位。
MACD: 4小时的MACD已经出现了死亡交叉,DIF在DEA下方,且柱子是负值。这进一步确认了中期市场的回调态势,空头动能正在释放。
RSI: RSI值在57附近,处于中性区域,还有一定的下跌空间。
长期(1日):稳固的牛市结构
趋势: 哇,日线图看起来就非常棒了!最近60根K线(从11月底开始),比特币一直保持着清晰的上涨通道,价格远高于所有短期、中期均线。目前的95500美元相对于日线级别的大趋势来说,只是一次小小的波动。
MA均线: MA5(94951美元)> MA10(92938美元)> MA20(91465美元),这是非常标准的多头排列,也是咱们常说的“黄金交叉”结构,预示着强劲的长期上涨动能。
MACD: 日线MACD的DIF和DEA都位于零轴上方,并且DIF还在DEA上方,柱子也是正值,这是一个非常明确的金叉和多头信号。尽管MACD柱子比前几天略有缩小,这可能表示上涨动能有所减缓,但整体结构依旧非常乐观。
RSI: RSI在63附近,虽然比较高,但还没进入超买区间,说明市场还有上涨的潜力。
2. 消息面结合分析
最近的消息面嘛,咱们看到市场情绪有点复杂哦。
利好方面: 有很多关于机构积极买入比特币,甚至通过短线空头清算将币价推向10万美元的消息(比如24、29条)。MicroStrategy(38条)的股价也因为比特币上涨而飙升,这都说明大资金对BTC的信心很足。阿根廷推出比特币Visa卡(41条),以及比特币作为机构对冲治理风险的工具(44条),这些都利于比特币的长期采用和价值认同。
利空/风险方面: 俄罗斯央行要求追踪跨境加密货币交易(2条),美国SEC对加密货币执法退缩以及Coinbase撤回对加密法案的支持(10、20、28条),这些都带来监管不确定性。一些山寨币项目(PEPE、SHIB等)的抛售压力和项目裁员(Sui主网宕机3条,Polygon裁员32条,X平台封禁InfoFi模式36、40条)也让市场笼罩一层阴影,可能影响整体风险偏好。
综合来看,宏观基本面和机构资金对BTC的看好是毋庸置疑的,10万美元的目标价也被反复提及。但短期的监管不确定性以及山寨币市场的波动,也给BTC带来一些回调压力。
3. 交易建议与总结
哎呀,青岚姐给你们总结一下,咱们比特币目前就是处于一个“短期调整,中期健康回调,长期依然强势看涨”的状态。
咱们的预判和做单思路是这样滴:
短期(15分钟/1小时): 目前是震荡偏空的,但由于RSI接近超卖,短线可能会有技术性反弹。
关键支撑位: 95000美元(心理关口,也是4小时MA20附近),再往下是94000美元。
关键阻力位: 95800-96000美元(短线反弹遇阻区),再往上是96500-97000美元。
交易建议: 短线交易员现在还是得小心点。如果反弹到95800-96000美元附近遇阻,可以尝试轻仓做空,止损放在96200上方。如果能在95000-95100美元附近得到有效支撑,且出现像小双底之类的反转形态,短线可以博一个反弹,但仓位一定要轻,止损带好哦。
中期(4小时): 正在进行一波健康回调,是给长线资金提供吸筹的机会。
关键支撑位: 95000美元(重要支撑),如果跌破,94000美元和92000美元(日线MA10附近)是更强的支撑。
关键阻力位: 97000美元(前期高点),突破这里才能继续冲刺10万美元。
交易建议: 中线交易员可以耐心等待回调到位。在95000美元或94000美元附近,密切关注K线形态和量能变化,如果出现强力买盘信号(比如大阳线吞没阴线,或双底结构),就是分批布局多单的好机会。目标可以看向97000美元甚至更高。如果94000美元被有效跌破,那就要警惕可能出现更深度的回调,咱们就要把止损设置好,或者等待更低的入场机会。
长期(1日): 毫无疑问的牛市,当前回调是入场良机。
交易建议: 对于长线投资者,现在这种回调就是“打折”时刻。可以在95000美元、94000美元,甚至更低的92000美元附近,分批进行定投或建仓,坚定持有多头。消息面机构的积极参与和10万美元的预测,都印证了日线级别的强劲走势。
可能出现的反转形态:
短期内,如果价格在95000附近形成W底(双底)或小的头肩底,可能会带来一波不错的反弹。但要真正反转4小时的下跌趋势,还需要更强大的买盘推动,并突破97000美元的关键阻力。
最后给咱们一句交易金句:
市场就像潮汐,有涨有落,咱们要学会的不是与潮汐对抗,而是驾驭它!
-------------------------
受限于图表篇幅和平台合规准则,行情分析有时效性,最新的分析已更新在我的青岚加密课堂:qinglan.org 或欢迎点击我的头像关注我,通过主页展示的渠道进行更多技术探讨。