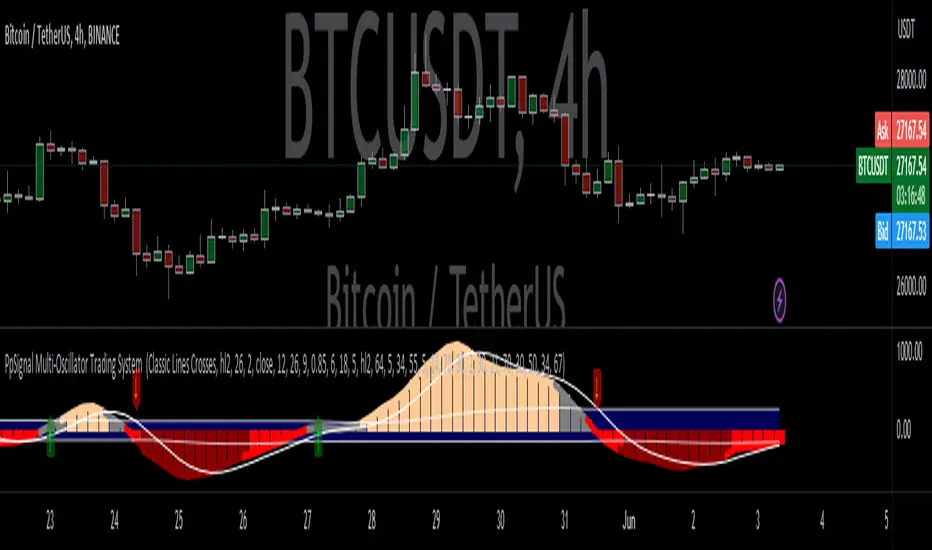
SSABU Indicator2
─────────────────────────────────────
3 Stochastic
1 RSI
1 ADX and DI
Use it if you need auxiliary indicators!
─────────────────────────────────────
스톡캐스틱 3개
RSI 1개
ADX and DI 1개
보조지표 갯수 모자란분들 사용하세요!
─────────────────────────────────────
✅ Other indicators to help you trade
✅ 매매에 도움되는 다른 보조지표
Basel major swing 2.2
ADX
NinetailsVulpix, but now only closing positions when they meet a take profit/stop loss target, and instead the middle red bars are used to reopen positions when in confluence the MA.
ADX & DIDeclaration:
This is a tradingview script written by feibilanceon of Agg.one .
This indicator is not public and for invitation only.
Features:
ADX and DI+ and DI- all in one indicator with a beautiful design!
Usage:
Just simply add this indicator to your chart!
Contributing:
You can report bugs or issues under this page.
Any advice would be helpful for improving this indicator's accuracy.

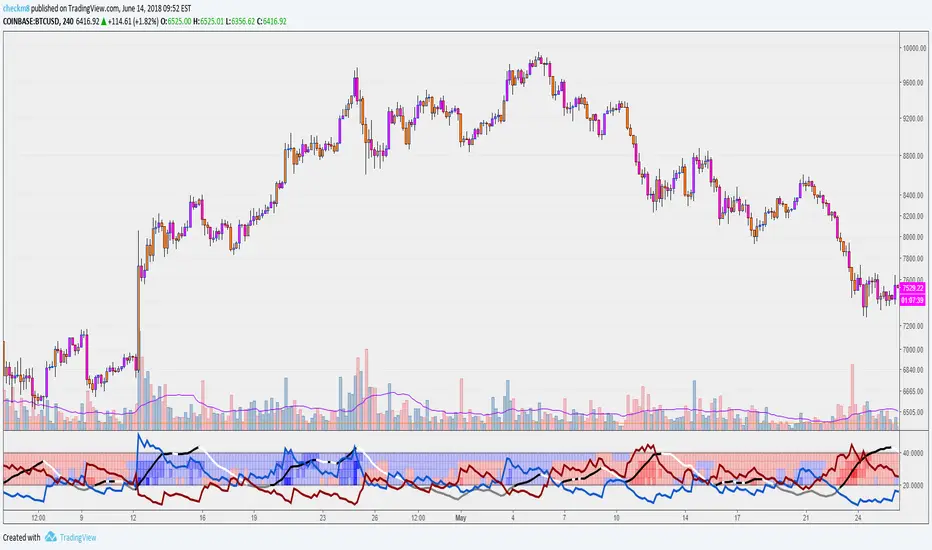
DMI Histogram & SRSI Crossover with ADX filteringUses DMI rendered as a histogram & overbought/sold SRSI crossovers to highlight areas of increased likelihood of reversal/signals.
This is the same as the DMI Histogram & SRSI found at the below link except that it uses ADX to filter trades and the DMI Thresholds are set to 0/-0 (optional if you want more aggressive filtering at a set threshold. Leave at zero if you only want to use ADX to filter).
Red dot above histogram - indicates overbought SRSI crossover occurred above the DMI threshold in an upward DMI and ADX > 25
Green dot below histogram - indicates oversold SRSI crossover occurred below the DMI threshold in a downward DMI and ADX > 25
Red plotted line is the ADX
DMI threshold can be adjusted to eliminate choppy low DMI crossovers (displayed as transparent red zone on the histogram). Set to 0 / -0 to display all SRSI crossovers for that DMI.
SRSI overbought/sold adjustable. Note : it has been offset to align with the histogram (-50 to 50 instead of the standard 0 to 100).
Other settings standard for SRSI etc.
Also ADX is displayed offset around the threshold and aligned with the horizontal 0 axis. So if you filter out trades where ADX < 25 then the ADX line will be plotted so values < 25 display below zero and vice versa. It makes it easier to visually identify the trend strength (when it passes over 0 it represents confirmed trend strength and the DMI/SRSI crossover signals will then display).
You can adjust the ADX threshold in the settings. Standard are usually 20 or 25(default).

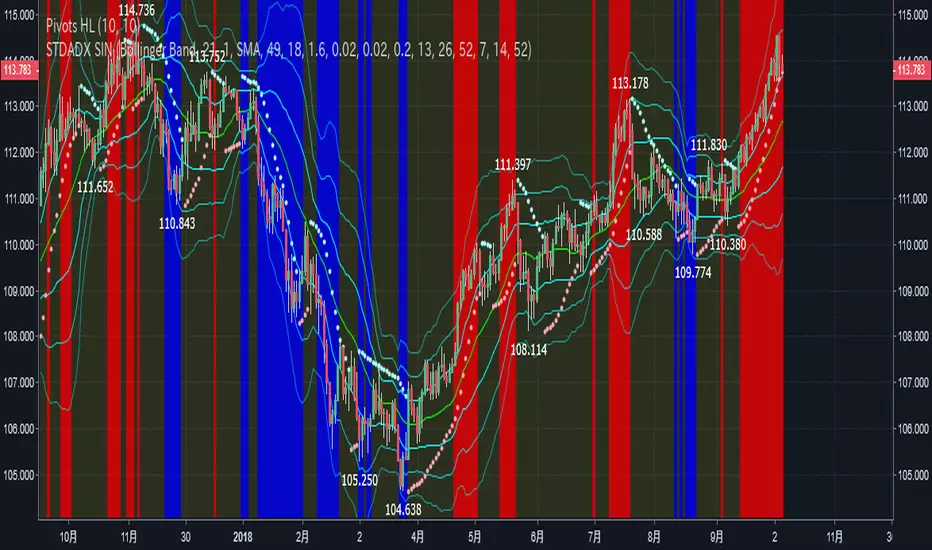
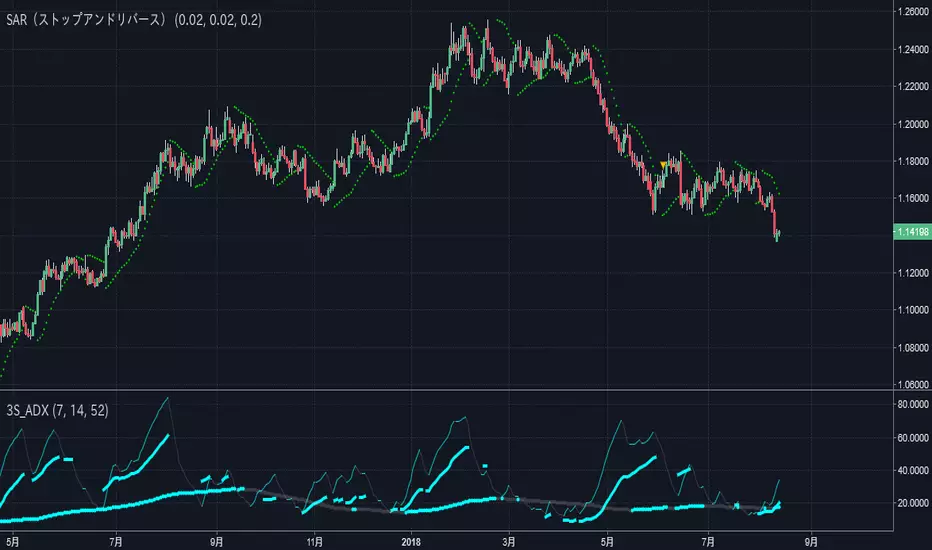
STD-ADX Trade Signal(TypeM Ver2.0)==日本語説明も併記 // Japanese discription is following ==
Draw the trend judgment on the chart by combining the " Triple Smoothed ADX ", " Triple Standard Deviation " and "Bollinger Band".
This script was created by adding logic to STD-ADX Trade Signal(Basic Ver1.0) and making adjustments.
The comparison between this script and STD-ADX Trade Signal(Basic Ver1.0) is as follows.
In addition, we can set alerts at the time of occurrence of each signal of buying trend, selling trend, profit fixing of each selling and buying.
Red = Up trend
Blue = Down trend
Yellow = Range
" Triple Smoothed ADX " and " Triple Standard Deviation " in combination with" Triple STD-ADX " is recommended.
========================================================
「 Triple Smoothed ADX 」と「 Triple Standard Deviation 」、「Bollinger Band」を組み合わせたトレンド判断をチャート上に描画します。
このスクリプトは「 STD-ADX Trade Signal(Basic Ver1.0) 」にロジックを追加、調整してできています。
STD-ADX Trade Signal(Basic Ver1.0) との比較は次の通りです。
また、買いトレンド、売りトレンド、売買それぞれの利益確定の各シグナルの発生時点でアラートを設定できるようにしています。
赤=上昇トレンド
青=下降トレンド
黄=レンジ
「 Triple Smoothed ADX 」と「 Triple Standard Deviation 」を組み合わせた「Triple STD-ADX」を併せて表示させることをおすすめします。
rojbin_strategy_5min-1h-v3[babeli]This strategy – made from the rojbin_strategy oscillator labeled “buy”, “sell” on the chart, helps trader decide more easily and more quickly on buying and selling .Rojbin oscillator, one of the special tools of the coinopi group, is using( Macdi CCI,ADX, MA, ATR) Detects the most accurate signals for users.
-->https://www.tradingview.com/x/fhG7rVS4/
-->https://www.tradingview.com/x/Qe3Uu3KC/
-->https://www.tradingview.com/x/TYgoUn3o/
-->https://www.tradingview.com/x/clgje7gi/
Rojbin Oscillator
-->https://www.tradingview.com/script/sGZbLtfx-Rojbin-Strategy-1D-babelii/
Average Directional Index-BuschiA simple modification of the built-in "Average Directional Index":
To identify wether there is an uptrend or a downtrend, the function color is conditional:
no trend: black
small uptrend (weak threshold): light green
big uptrend (strong threshold): green
small downtrend (weak threshold): light red
big downtrend (strong threshold): red

Average Directional Movement Index Rating ADXR by KIVANÇ fr3762Average Directional Movement Rating quantifies momentum change in the ADX . It is calculated by adding two values of ADX (the current value and a value n periods back), then dividing by two. This additional smoothing makes the ADXR slightly less responsive than ADX . The interpretation is the same as the ADX ; the higher the value, the stronger the trend.
The ADXR , being a smoothed version of ADX , and can be used similarly to the ADX in the three rule system discussed on the ADX section..
The ADXR is a measure of the spread between the Directional Indicators ( +DI and -DI ). When the ADXR is declining, it's not advised to use a trend following system. However, a rising ADXR signals that the dominant trend is likely to continue. A rising ADXR , with both the ADXR and DI+ above the D- indicates a strengthening bullish market. The scan syntax needed to represent this condition would be...
ADXR > DIMINUS AND DIPLUS > DIMINUS AND ADXR > ADXR .1
A rising ADXR , with both the ADXR and DI- above DI+ indicates a strengthening bearish trend . The scan syntax needed to represent this condition would be...
ADXR > DIPLUS AND DIMINUS > DIPLUS AND ADXR > ADXR .1
If the ADXR has been below both DI+ and DI- but has begun to rise a new market trend is emerging. The scan syntax needed to represent this condition would be...
ADXR < DIPLUS AND ADXR < DIMINUS AND ADXR > ADXR .1
IMPORTANT NOTICE: USERS CAN ADD ADX DI+ and DI- indicators by checking the box in the settings of the indicator.
Developed by J.Welles Wilder
ÖNEMLİ BİLGİ: KULLANICILAR ADX , DI- ve DI+ indikatörlerini de ayarlar bölümündeki kutucukları işaretleyerek sayfaya ekleyebilirler.


DMI ADX TREND 2.0 (edit by GeertVD)Edit of the popular script by @TraderR0BERT
New features:
- horizontal colored areas, indication weak/medium/strong trend
- vertical bars, signaling trend/momentum changes
- DI+ vs DI- contraction/expansion histogram (to measure the DI volatility)

ADXRainbowColorEMAThis is an EMA that color changes based on ADX.
When ADX is low, EMA color is in lime or aqua, if the value of ADX moves higher, It changes from aqua to yellow and then red.
You can change the settings like EMA period and the color, etc in the dialog window.
Usually, as the trend becomes stronger, the ADX values rises, so there is a possibility on a trend when it is yellow or red.
Especially, when changing from aqua to yellow and red, it is a necessity check because it is a possibility of change from range to trend.
これはADXに応じて色が変化するEMAです。
ADXが低いときは、EMAの色はライム(明るい緑)やアクア(水色)ですが、ADXの値が高くなると、アクアから黄色、そして赤に変化します。
EMAの期間や色などはダイアログウインドウで変更できます。
通常、トレンドが強いとき、ADXの値は上昇します。その為、ラインの色が黄色や赤の時は、トレンド状態の可能性があります。
特に、色が水色から黄色、そして赤に変化するときは、レンジ状態からトレンドへと移行した可能性があるので、要チェックです。

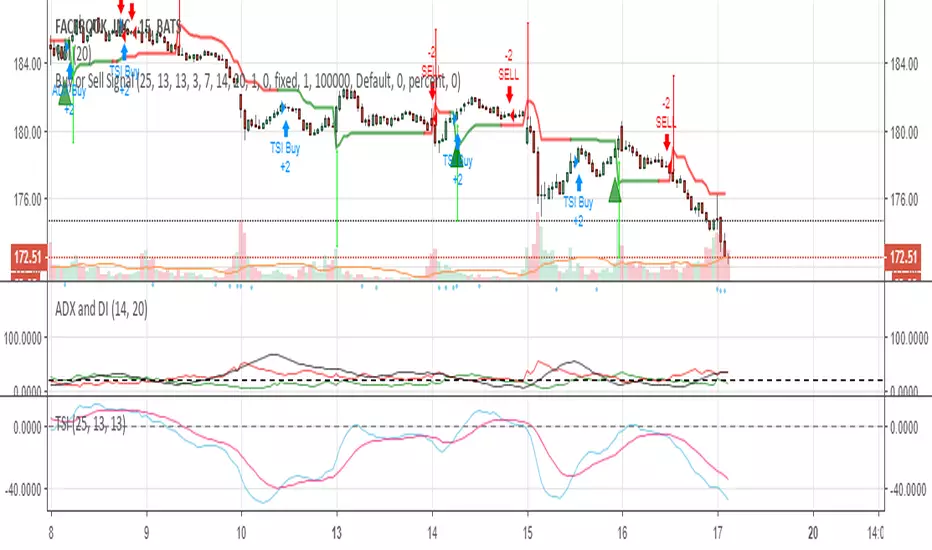
Buy or Sell Zone This Indicator Signals the Buy and Sells, there is no guessing just follow the alerts.

Triple Smoothed ADX==日本語説明も併記 // Japanese discription is following ==
■ Momentum index (Smoothed ADX triple display)
■ Effective assets: All
■Example of utilization
1) Trend generation is assumed at the timing when at least two lines including the blue thick line (14) are raised
2) Confirm the candlestick and if the price jumps out of the Bollinger band ± 1 σ, the trend toward that direction and recognition
3) If the closing price is confirmed within ± 1σ of the Bollinger band, close the position
■ Detailed explanation
Three Smoothed ADX with different parameters are displayed at the same time. As known as ADX included in DMI, it shows the strength of the trend.
It develops color in an upward phase to make it easy to recognize strengthening and weakening trends, and fades in a downward phase.
In addition, in accordance with the method of Wilder of the inventor in the calculation of ADX, a modified moving average (Smoothed Moving Average) is used instead of SMA.
Daily use is basic, but you can use it with the same parameters for other time feet.
The basic parameter (14) is set to a thick blue line for the most visibility.
Long-term parameters (52 * 26 is also acceptable) are indicated by blue circles as an auxiliary element for judging the rising margin of the basic line.
The short-term parameter (7) is displayed as a line as an auxiliary element for recognizing the peak out of the basic line in advance.
In some cases, changing the short term (7) to the very long term (100) allows you to recognize the major market price level once in several years.
Three periods The phrase "all lines" goes from "low position" to "rising together" is considered the strongest trend.
On the other hand, in the case where the short-term line rises backwards as the longer-term line goes down, it tends to end up with short-lived trends and failure to form trends.
Please note that there is no way to judge whether the trend suggested by this index rises or falls from this index, so it is necessary to confirm the main chart. (It is preferable to display parabolic SAR or Bollinger band)
■ Remarks
It is an index created assuming that it is used as Triple STD-ADX in combination with Triple Smoothed ADX(to be posted later).
■ About Triple STD-ADX
Triple Standard Deviation "and" Triple Smoothed ADX "are superimposed and displayed as" Screen (without scale) "to function as" Triple STD - ADX ".
The method of utilization is the same as Triple Standard Deviation and Triple Smoothed ADX, but by simultaneously displaying two momentum indicators with different calculation approaches with multiple parameters, we aim to mutually complement the cognitive power of trends.
STD (13, 26, 52, 100, 200) and ADX (7, 14, 26, 52, 100) correspond to reaction rates respectively.
By choosing different reaction rates you can expect to further increase reliability.
You can estimate the reliability of the trend most reliably in a situation where all six signals in total rise from low to high.
■Sample: STD-ADX Trade Signal
========================================================
モメンタム指標(Smoothed ADXの3連表示)
■ 有効アセット:すべて
■ 活用の一例
1)青の太線(14)を含む少なくとも2本のラインが上昇したタイミングでトレンド発生を想定
2)ローソク足を確認し、ボリンジャーバンド±1σの外に価格が飛び出している場合はその方向へのトレンドと認識
3)ボリンジャーバンド±1σ以内で終値が確定した場合にはポジションクローズ
■ 詳細説明
パラメーターの異なる3つのSmoothed ADXを同時に表示します。DMIに内包されるADXとして知られるように、トレンドの強度を示します。
トレンドの強化と弱化を認識しやすいように上昇局面で発色し、下降局面で退色します。
なお、ADXの計算において考案者ワイルダーの手法に倣い、SMAではなく修正移動平均(Smoothed Moving Average/ワイルダー移動平均)を使用しています。
活用は日足が基本ですが、他の時間足に対しても同一パラメーターで使用することができます。
基本パラメーター(14)は最も視認しやすいように青の太線にしています。
長期パラメーター(52※26も可)は基本線の上昇余力を判断するための補助要素として青色の丸点で表示しています。
短期パラメーター(7)は基本線のピークアウトを先行して認識するための補助要素としてラインで表示にしています。
場合によって、短期(7)を超長期(100)に変更することで数年に一度のレベルの大相場が認識できます。
3期間「全てのライン」が「低い位置」から「揃って上昇」する局面を最も強いトレンドと考えます。
一方、より長期のラインが低下する中、より短期のラインが逆行して上昇するケースでは、短命のトレンドやトレンド形成失敗に終わることが多くなります。
なお、本指標が示唆するトレンドが上昇か下降かは本指標からは判断する術はないため、必ずメインチャートを確認する必要があります。(パラボリックやボリンジャーバンドを表示すると好適)
■備考
先に掲載したTriple Standard Deviationと併用して、Triple STD-ADXとして使用することを想定して作成した指標です。
■Triple STD-ADXについて
「 Triple Standard Deviation 」と「Triple Smoothed ADX」を一方を「スクリーン(スケールなし)」として重ねて表示させることで「Triple STD-ADX」として機能します。
活用方法はTriple Standard DeviationやTriple Smoothed ADXと同じですが、算出アプローチの異なる2つのモメンタム指標を複数パラメーターで同時に表示させることで、トレンドの認識力を相互に補完する狙いがあります。
反応速度はそれぞれSTD(13,26,52,100,200)とADX(7,14,26,52,100)がほぼ対応します。
異なる反応速度を選択することで信頼度をさらに高めることを期待できます。
合計6本のシグナル全てが低い位置から揃って上昇する局面でトレンドの信頼性を最も高く見積もることができます。
ADX Overlap with MACD FilterIt’s a method/study to find trending stocks and cryptocurrencies using two different periods (14, 5) ADX Overlap with a MACD Filter. The MACD filter may or may not be used.
Green shadow implies Trending Uptrend
Red shadow implies Trending Downward
I am a disabled man. Therefore, I am not able to write in detail here today. More Details will follow as time permits. Please let me know if I am missing anything…
Legal Disclaimer: I am not bribed to write here and I am not seeking insider favors. I wrote here so I get replies from fellow viewers to educate myself and for my daily expenses. Hence, if anyone uses this post for making their decisions, I am not responsible for any failures incurred.
Safe Trading!
Kal Gandikota
PS: If you found this script interesting and edifying please follow and upvote.
PS2: Please kindly donate for my daily expenses (atleast as you would on streets) at the following addresses:
'BTC Wallet' - 1NeDC1GvpFa49DFLuT1v28ohFjqtoWXNQ5
ETH Wallet - 0x0450DCB7d4084c6cc6967584263cF6fBebA761D1
'BTS Wallet' - chip-maker
QTUM Wallet - QhqqV3WQV236Tz5ZbPceXXvU8aK2N4i78A
NEO Wallet - AUdiNJDW7boeUyYYNhX86p2T8eWwuELSGr
PS3: To open a cryptocurrency trading account at the brokerage where I trade most for now, please kindly use the following website(with referral code attached):
www.binance.com
PS4: For more information on ADX and MACD, please 'Google' or search here yourself.
Kal’s ADX Overlap with MACD FilterIt’s a method/study to find trending stocks/cryptocurrencies which uses two different periods (14, 5) ADX Overlap with a MACD Filter. The MACD filter may or may not be used.
More Details will follow as time permits. Please let me know if I am missing anything…..
Legal Disclaimer: I am not bribed to write here and I am not seeking insider favors. I wrote here so I get replies from fellow viewers to educate myself and for my daily expenses. Hence, if anyone uses this post for making their decisions, I am not responsible for any failures incurred.
Safe Trading!
Kal Gandikota
PS: If you found this script interesting and edifying please follow and upvote.
PS2: Please kindly donate for my daily expenses (atleast as you would on streets) at the following addresses:
'BTC Wallet' - 1NeDC1GvpFa49DFLuT1v28ohFjqtoWXNQ5
ETH Wallet - 0x0450DCB7d4084c6cc6967584263cF6fBebA761D1
'BTS Wallet' - chip-maker
QTUM Wallet - QhqqV3WQV236Tz5ZbPceXXvU8aK2N4i78A
NEO Wallet - AUdiNJDW7boeUyYYNhX86p2T8eWwuELSGr
PS3: To open a cryptocurrency trading account at the brokerage where I trade most for now, please kindly use the following website(with referral code attached):
www.binance.com
PS4: For more information on ADX and MACD, please 'Google' or search here on Tradingview

ADX coded with DIAn easier to read implementation of ADX and DI, with colour indicating direction of trend, oscillator indicating strength of trend, and below threshold shown with a lack of colour (black).

MTF ADX and DMI Grid with RSIHello and welcome to my latest revision of my ADX and DMI series.
This indicator features the Average Directional Index (ADX) and the Directional Moving Index (DMI), with a multi-timeframe (MTF) grid that shows you the dominant DMI on the select timeframes. There are four grid rows, allowing you to select four different timeframes to show in the study. In addition to this, the colors displayed in the grid will reflect RSI levels, when the RSIs on the select timeframes exceed 70 or 80, or fall below 30 or 20.
For example, if one of your select timeframes is 4h, the standard settings will display a blue block in the relative row of the grid if the +DMI is above the -DMI on the 4h timeframe. If the RSI exceeds 70, the shade of blue will become darker, and become even darker if the 4h RSI exceeds 80. This will apply for the inverse case, where if the -DMI is dominant, the grid will display a darker shade of red as the 4h RSI falls below 30 and 20.
The ADX is the line in the oscillator that changes between black, white, and gray. ADX will be black when it is rising, white when it is falling, and gray when it is below the key level value (default set to 20). When ADX is below 20, you can assume the dominant DMI is irrelevant as there is no real trend strength. You can change your set key value in the oscillator settings, as well as all the colors, and so on.
If you are not familiar with the ADX and DMI indicator, a useful guide can be found below:
1) An ADX reading below 20 signifies that there is no prevailing trend in play. This means that, regardless of DMI dominance, there is no real strength. This is a good measure for sideways price action.
2) If +DMI is above -DMI, this means that a bullish trend is in play, and vice versa (where a -DMI dominance shows a bearish trend in play). Make sure to pay attention to the value of ADX, as this will show the significance of DMI dominance.
3) The strongest possible position you can have is one where the DMIs have a crossover on an ADX that is perking or sloping upwards.
4) You should be exiting your positions at the peak of the ADX , shown by the color changes, as this is often the furthest extent of the dominant trend. Once the ADX tips, the trend weakens and is less likely to see continuation. NOTE: Divergences are possible, where the ADX may be falling, but the dominant trend sees continuation. This simply means that the dominant trend is weakening, but still going.
5) Speculating on DMI crossovers is dangerous, especially on larger timeframes. Be careful when doing so if you are not familiar with the calculations behind the DMIs and if you are not familiar with how movements on lower timeframes translate to larger timeframes.
Additional resources to learn about ADX & DMI:
1) seekingalpha.com
2) stockcharts.com
Previous versions:
1)
2)
Happy trading and feel free to reach out with any question, suggestions, or concerns!
PARSEC Bitcoin strategy for testing: SMA + ADX + Fisher transfStrategy using SMA, ADX and modified Fisher transform (I've made linear transformation on original Ehler's Fisher transform) and implemented into Bitcoin trading perspective.
Current strategy is optimized for Bitcoin.
General objectives is to add, remove indicators:
- to further improve the strategy for Bitcoin
- adjust the strategy to be feasible for wider range of cryptocurrencies (preferably for the top 2-5 or top 2-10 ones), without significantly decreasing the current profit factor and profit rates
Experienced technical analysts feel free to PM me if you want to test the strategy (at this stage up to 5 people's participation would be appreciated).
For those ones who significantly contribute, I will give life-long access to both the improved strategy and alerts.

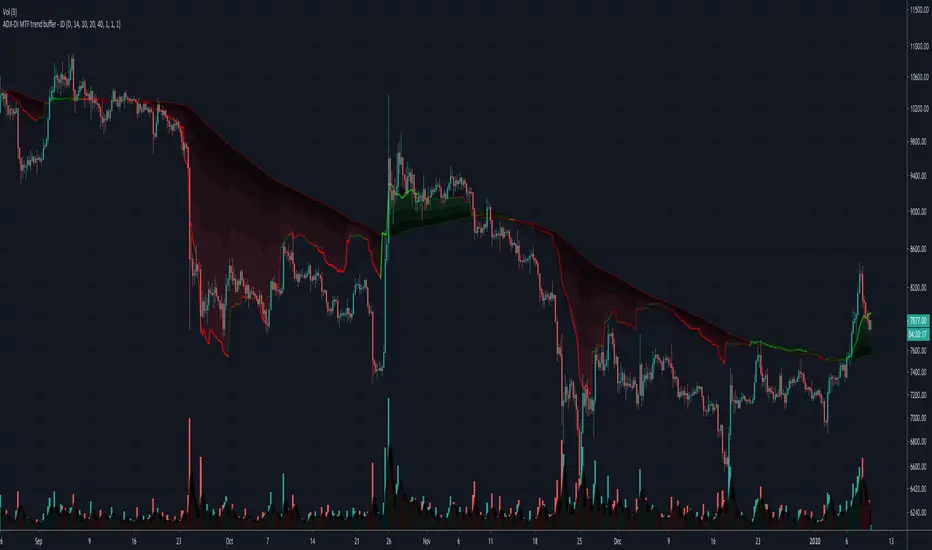
ADX-DI MTF trend buffer - JDThe indicator gives a multiplication of ADX and the DI+ and DI-values, color coded for bullish or bearish momentum
the indicator was optimised for use with HA-candles, but works with regular candles as well
and shows general market direction en divergence in a simpler visual way than the normal ADX-DI lines
a threshold mask can be shown or omitted as preferred
version 3. the indicator is now plotted relative to the 200 ema and can be seen as a "buffer" against price reversal
The timeframe of the indicator can be the current one or custom selected but gives better visual information if a longer timeframe than the current one is used.
The colors can be changed to fit with "Dark mode" or "Light mode"
a scaling option is available to downscale the trend indication relative to the price bars
JD
Linda Raschke's Holy GrailAnother script based on Linda Raschke's strategy with the same name from her book about swing trading.
Ppsignal ADXAdx con color de fondo.
Adx indicator with background color.
Bullish trend background lime and line yellow. Bearish trend background red lines red.