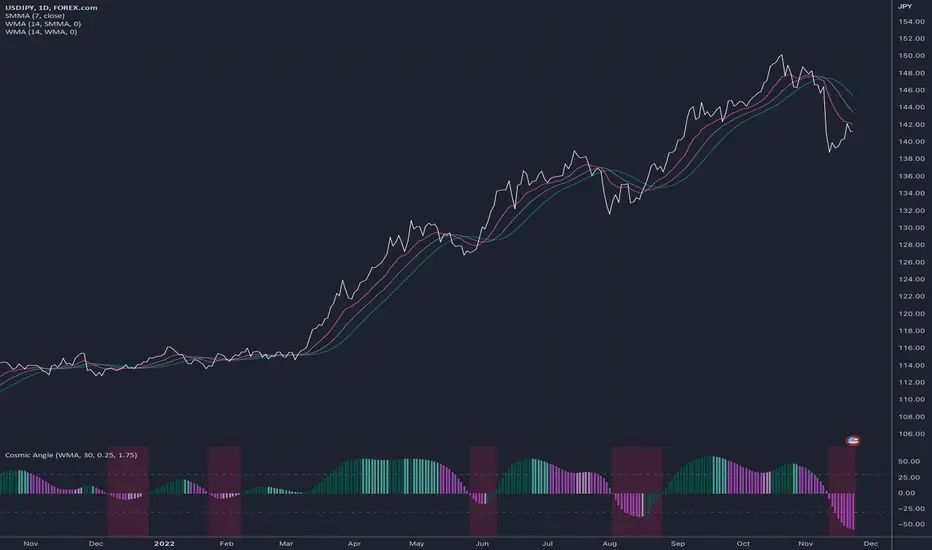
Cosmic AngleThis is a histogram that can display a moving average's angle and also show how volatile the change in angle is.
To use:
Add any moving average indicator to the chart
Click that indicator's More > Add Indicator on (MA)
Select the Cosmic Angle indicator
Adjust the Cosmic Angle 's Price To Bar Ratio value to reflect that of your chart's
Adjust the Cosmic Angle 's Threshold as per your liking (*1)
(*1) This setting affects the bar colors. It represents the minimum difference in degrees between the n and n-1 bars' angle to force a change of color.
Angles
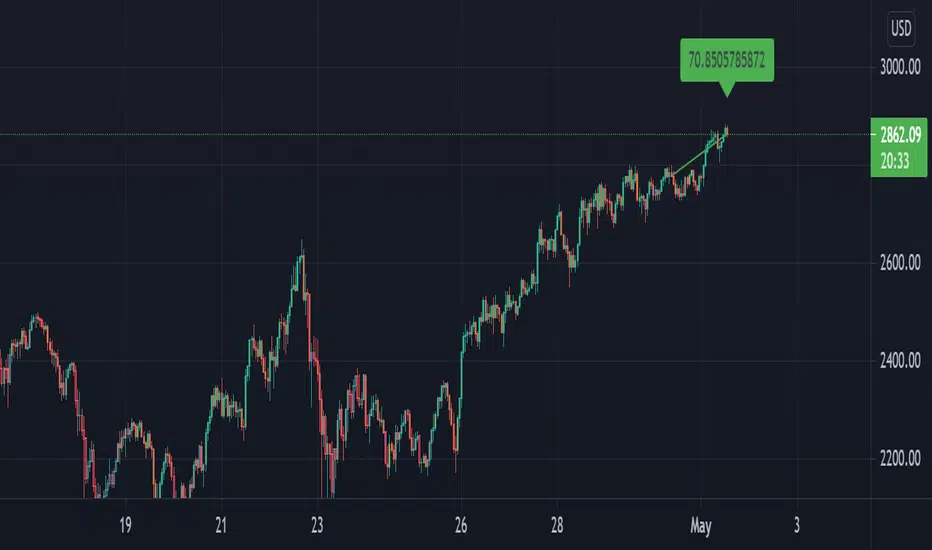
angle bar colors [LM]Hello guys,
I would like to introduce you angle bar colors indicator. It colors bars depending the angle of the bar x length back and current one
lime angle > 70 degrees
green 20 < angle < 70 degrees
orange 0 > angle <= 20 degrees
purple 0 > angle >= -20 degrees
red -20 > angle > -70 degrees
maroon angle < -70 degrees
Any suggestions are welcome
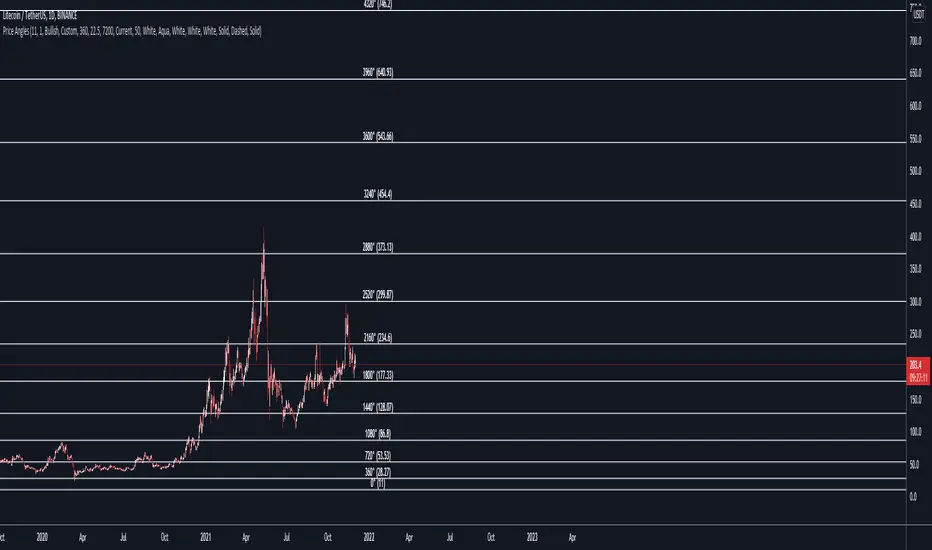
Price AnglesA script to draw Price Angles and Time Levels given Cycle start point, Cycle space (size), Cycle type ( Bullish / Bearish ), Cycle shape, Time levels space, Time levels count
Makes it easier for you to find where a cycle could end
All shapes are included (Circular, Straight Line, Triangular, Square, Pentagon, Hexagon, Heptagon, Octagon, Nonagon, Decagon)
Everything is customize-able, you can customize Angles text color and position, Main angles lines color and style, Secondary angles lines color and style and Time levels color and style
You can disable drawing Time levels as well
My Telegram :- @Kirolos_T
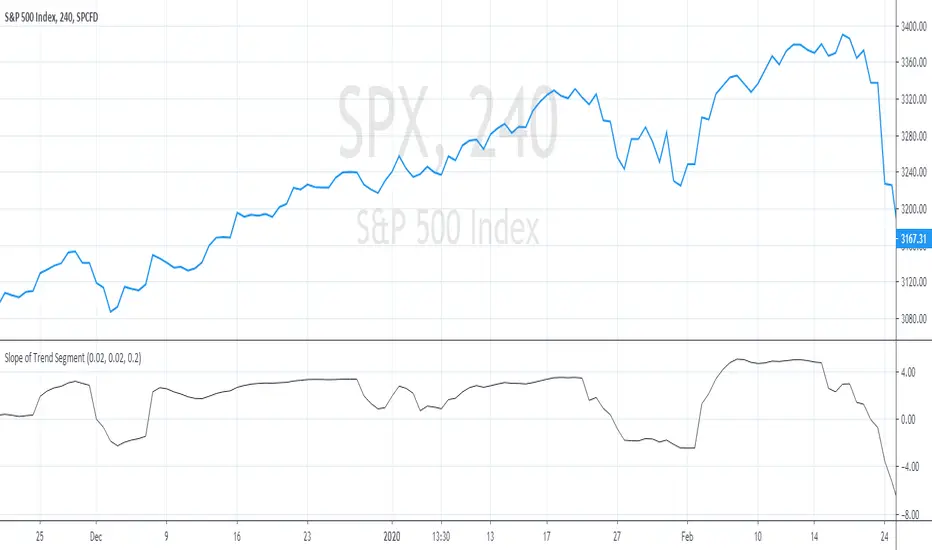
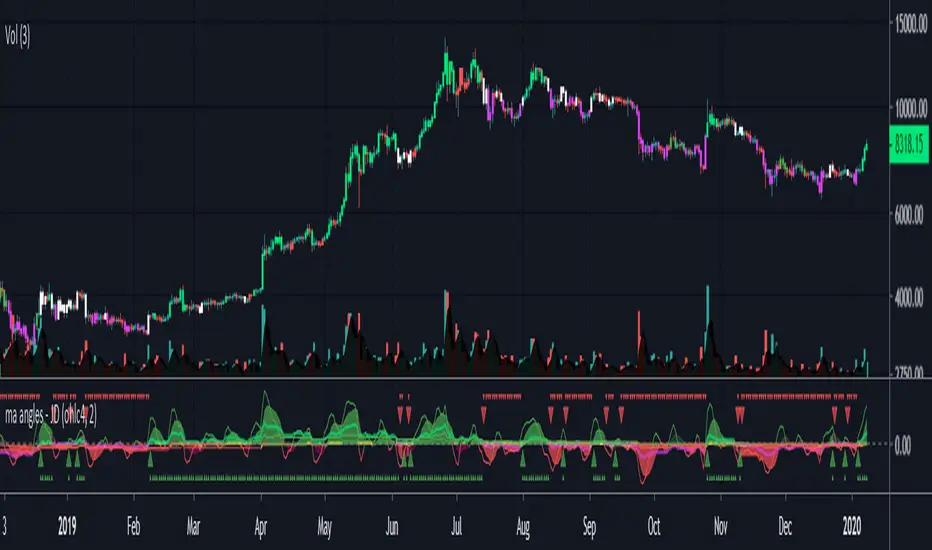
ma angles - JDthis indicator gives you the angles of different moving averages
this can give an indication of the momentum of a move increasing or decreasing
you can also set a threshold for a minimum angle to filter out "no trade" zones
JD.
#NotTradingAdvice #DYOR
I build these indicators for myself and provide them open source, to use for free to use and improve upon,
as I believe the best way to learn is toghether.
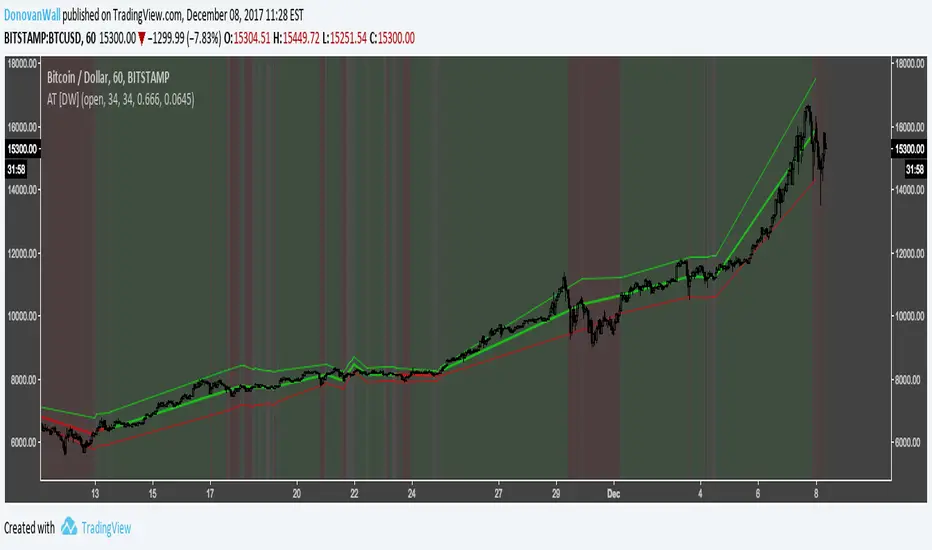
Angular Trend [DW]This is an experimental study designed to outline the trend of a security based on the average angular change of price.
New lines are drawn whenever the source's angle of change is equal to zero.