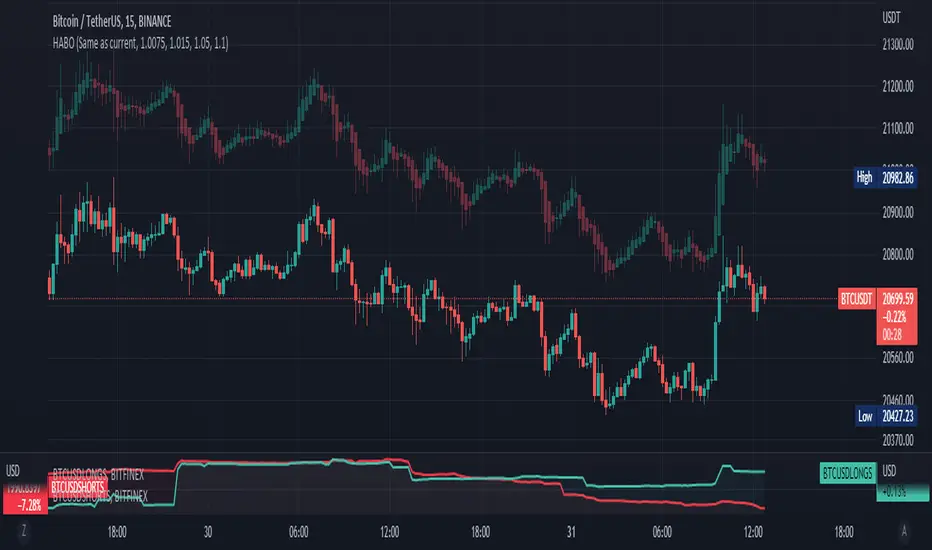
ARKA-Smoothed Z-ScoreThis Indicator is based on Mr. Dan Valcu ideas.
The author of this article is Veronica Valcu.
The z-score (z) for a data item x measures the distance (in standard deviations StdDev) and direction
of the item from its mean (U):
z = (x-StdDev) / U
A value of zero indicates that the data item x is equal to the mean U, while
positive or negative values show that the data item is above (x>U) or below
(x Values of +2 and -2 show that the data item is two standard deviations
above or below the chosen mean, respectively, and over 95.5% of all data
items are contained within these two horizontal references.
Based on the article and ideas about the z-score concept we can use it to get more confidence where we want to be sure this is an oversold or overbought zone.
The indicator draws two levels on 2 and -2. Z-Score color comes red when it goes above 2, and the color changes to green when it goes below the -2 level. The Z-Score color which value is between 2 & -2 is gray.
So far, this is the description of the indicator(ARKA-Z Score), which has been written separately and published for the public. In this indicator, we intend to smooth the value of Z-Score we get using moving averages.
Z-score applied to close prices is an irregular curve that can be smoothed by applying
moving averages. A simple three-day moving average has been applied to the z-score (20), and a simple five-day moving average is applied to the resulting average.
Long opportunities were initiated when the three-day simple moving average crossed above the five-day simple moving average of the three-day simple moving average. Short opportunities were initiated when the three-day simple moving average crossed below the five-day simple moving average of the three-day simple moving average.
Ashi

ARKA-Synergy Heikin Ashi & PriceThis Indicator is based on Mr. Dan Valcu ideas. In this indicator, trend points and possible return points in the Heikin Ashi chart are calculated based on their position.
Closing price in front of the middle point of the body of Heikin Ashi. So we can get more trend information from the Heikin Ashi chart. The basic idea behind combined charts is to be ready to act when a warning (0.5 or -0.5) is displayed during a trend.
The indicator has four column types:
UP: Uptrend(1)
DN: Downtrend(-1)
NW: Negative warning(0.5)
PW: Positive warning(-0.5)

ARKA-Z-ScoreThis Indicator is based on Mr. Dan Valcu ideas.
The author of this article is Veronica Valcu.
The z-score (z) for a data item x measures the distance (in standard deviations StdDev) and direction
of the item from its mean (U):
z = (x-StdDev) / U
A value of zero indicates that the data item x is equal to the mean U, while
positive or negative values show that the data item is above (x>U) or below
(x Values of +2 and -2 show that the data item is two standard deviations
above or below the chosen mean, respectively, and over 95.5% of all data
items are contained within these two horizontal references.
Based on the article and ideas about the z-score concept we can use it to get more confidence where we want to be sure this is an oversold or overbought zone.
The indicator draws two levels on 2 and -2. Z-Score color comes red when it goes above 2, and the color changes to green when it goes below the -2 level. The Z-Score color which value is between 2 & -2 is gray.

HARSI - The WHALE v2This strategy is credited to the "Heikin Ashi RSI Oscillator" By JayRogers.
The core of this strategy is "Heikin Ashi RSI Oscillator (HARSI)" By JayRogers, with multiple confirmation indicators. The buy signal is generated by HARSI when there is green HA, and there is a positive stochastic cross under the line OB line.
To confirm the buys signal, you can use one or all of the following:
- EMA: the buy confirmation is positive if the candle closes above the EMA.
- Volume Oscillator: the buy confirmation is positive if the volume value is above the zero line.
- ADX: the buy confirmation is positive if the D+ is above the D- and the D+ is above the threshold level.
- Vortex: the buy confirmation is positive if VI+ is above VI-.
You can enable the take profit, trailing stop loss (TSL), and stop lose (SL), if not, then the strategy will give a sell signal by itself when there is a negative stochastic cross above OB Extreme line.
Note, that the TSL arming value should be lower than the TSL %.
The strategy can give a different result based on your selection. However, the best timeframe is 4 hours without TP.

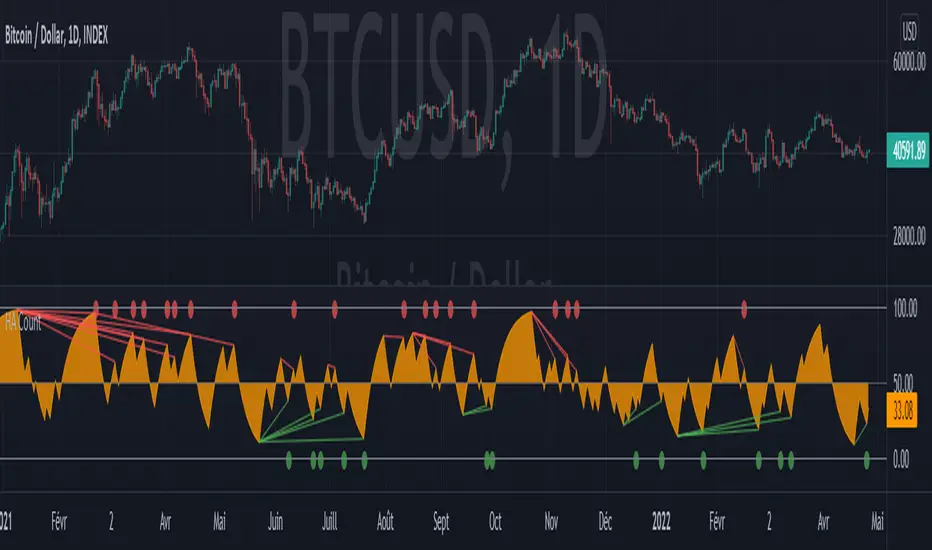
Heikin Ashi CountObjective:
This indicator aims to obtain an oscillator indicating the trend of a market by minimizing noise through the use of Heikin Ashi candles.
The idea is to make the oscillator tend towards 100 at each bullish Heikin Ashi candle, and inversely towards 0 when bearish.
The advantage is that this indicator has little noise compared to the RSI, but also little lag compared to the Schaff Trend Cycle, which are the two indicators that inspired me to create this one.
Usage:
As a general rule, below 15, HA Count indicates an oversell and above 85 an overbuy.
Setting the length for the candle count results in an indicator that is less sensitive when close to 1 and more sensitive when it is at 2 or higher.
Chosen as the default value, 1.15 seems to give the best indications, regardless of the market or time period.
Also it looks very similar to the values that the RSI could give set over 14 periods, so it can be used in the same way. Especially with regard to divergences.
---- FR ----
Objectif :
Cet indicateur vise à obtenir un oscillateur indicant la tendance d'un marché en minimisant le bruit grace à l'utilisation des bougies Heikin Ashi.
L'idée est de faire tendre l'oscillateur vers 100 à chaque bougie Heikin Ashi haussière, et inversement vers 0 lorsque baissière.
L'avantage est que cet indicateur a peu de bruit comparé au RSI, mais peu de lag aussi comparé au Schaff Trend Cycle, qui sont les deux indicateurs qui m'ont inspiré pour la création de celui-ci.
Utilisation :
En régle général, en dessous de 15 HA Count indique une sur-vente et au-dessus de 85 un sur-achat.
Le paramétrage de la longueur pour le comptage de bougie permet d'obtenir un indicateur moins sensible lorsque proche de 1 et plus sensible lorsqu'il est à 2 ou supérieur.
Choisie comme valeur par défaut, 1.15 semble donner les meilleures indications, peu importe le marché ou la période de temps.
En outre cela ressemble beaucoup aux valeurs que pourrait donner le RSI régler sur 14 périodes, ainsi il peut être utilisé de la même manière. Notamment pour ce qui est des divergences.
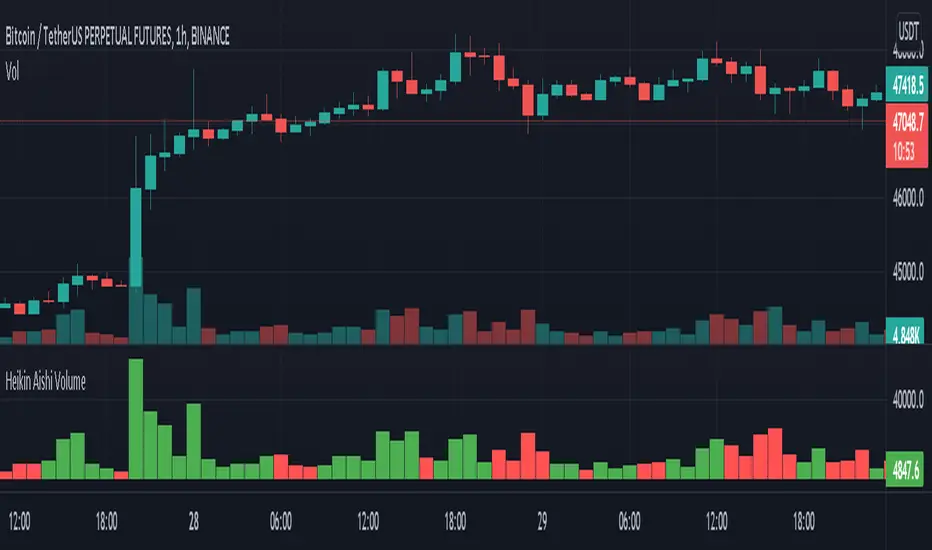
Heikin Aishi VolumeThis indicator plots the volume of each Heikin - Ashi bar...
As you all know the color of the volume depends on the open and close of the current and previous candle. So this indicator will give different color result when used on regular candles...
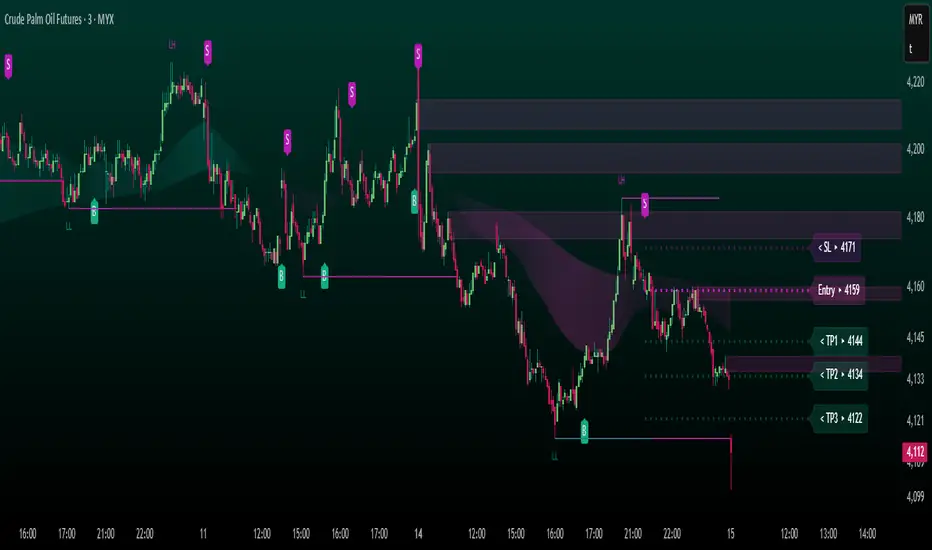
FUTURES ScalpV2 PROTECHFUTURES ScalpV2 PROTECH system
This indicator is built specifically for fast trading i.e. scalping/intraday in the commodity market or futures market. It uses an indicator instrument consisting of ATR TRAILING STOP (ATR), EXPONENTIAL MOVING AVERAGE, PIVOT POINT, and FIBONACCI.
Rebuild of Instrument & Parameter
This indicator is also an upgraded instrument that is sourced from the previous indicator, the COMPLETELY FCPO INDICATOR.
This R&D of course to make trading activities more effective, dynamic and to increase the confidence of traders in current trading activities. The indicator has been upgraded in terms of parameters as well as additional instruments. Among them are;
1. ATR Trailing Stop
2. Exponential Moving Average – fastMA/slowMA Length
3. Label@Entry Price/Stoploss/Takeprofit line
>The best timeframe is 3 minutes
>The take profit and stop loss rates are based on percentages. However
traders can change the percentage rate according to their respective
trading plans.
>existing percentage rates have been set(build-in) specifically for the FCPO
market. So you have to reset for other markets.
>The candle/bars have been colored to make it easier for traders to see price
trends whether in bullish or bearish conditions.
The original instrument has been retained but changed in terms of display & facelift features.
The original indicator (COMPLETELY FCPO INDICATOR) still remains in use and can used together. Hopefully with the combination of these indicators will make traders more successful in trading activities, especially in the futures market.
DISCLAIMER;
ALL NOTES AND INDICATING TOOLS ARE FOR EDUCATIONAL ONLY AND AS A FACILITATOR AND PREPARATION IN TRADING ACTIVITIES. ADMIN IS NOT RESPONSIBLE FOR ANY RISKS IN YOUR TRADING ACTIVITIES. TAKE AT YOUR OWN RISK.
FunTrader/Aieyee @2022
SuperJump Multi Time Frame Heiken Ashi ColorThis is my first public simple script.
It expresses the color of Heiken ashi Candle on a different time chart.
As you already know about it, If you change your chart directly to Heiken ashi, the value of candle changes.
For eaxmple, moving average lines change little by little from Non Heiken ashi Candle.
I was very uncomfortable with this.
If you use this, you can check the Heiken ashi color while using a Non Heiken ashi Candle.


Heikin-Ashi Candle ColoringThis script will change the color of normal candlesticks to the color that the corresponding Heikin-Ashi candles would have.
This allows to spot a trend or a trend reversal just by looking at candles, without using Heikin-Ashi candles, which distort the appearance of a typical chart.

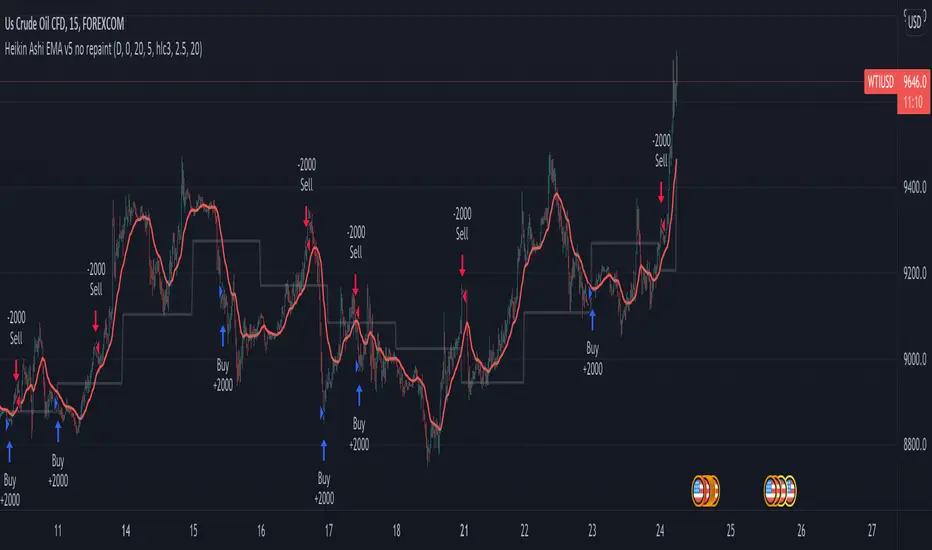
Heikin Ashi EMA v5 no repaint This script was inspired by the "Heikin/Kaufman Strategy" from marco valente built on v2.
The script was rebuilt on the v5 and most importantly removed the repaint function that was driving surrealistic backtesting inflated numbers.
This script is now fully functional and not repainting - At the time of testing worked efficiently 90% WR and 2x profit factor on CFD WTI OIL with a 15m time frame indexed on forex.com price.
You should utilize this script with caution, especially on high volatility cycles you can try plotting against a volatility relative index or stop.
I also strongly recommend understanding the fundamentals of WTI OIL to balance the indications of the strategy with fundamentals.
Thanks to Clovis Warlop and Nilesh Sharma for their contribution.
Cheers,
Gustavo Bramao
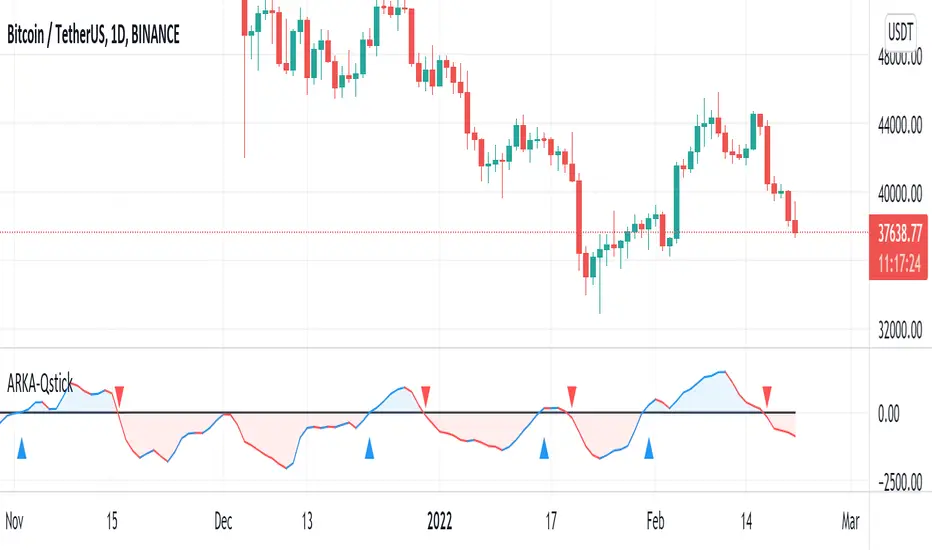
Qstick IndicatorThis indicator idea comes from Tushar Chande called Qstick.
Technical indicators quantify trend direction and strength in different ways.
One way is to use the difference between close and open for each bar and to sum it up over a period of time.
The formual is:
Qstick (period ) = Average ((close-open ), period )
In this indicator, we can choose how to calculate body by two famous chart types. The first and default indicator settings are based on Heiken Ashi chart, and the second is based on the Candlesticks chart.
If the resulting value is positive, the trend is considered up and shows with the blue color; otherwise,
the trend is considered down it shows with red color.
When Qstick value is greater than zero means that the majority of the last 'n' days(the default value is 8)
have been up, indicating that buying pressure has been increasing. Vice versa, when Qstick value is lower than zero means that the majority of the last 'n' days have been down, indicating that selling pressure has been increasing.
Crossing Qstick above Level Zero is used as bullish bias (long entry signal) because it is indicating
that buying pressure is increasing, while bearish bias (short entry signal) comes from the indicator
crossing down through zero. This indicator can be part of trading systems and we can use it to confirm our signals.
Also, We can active Alert checkpoint to show cross points and activate Alerts.
Candles HTF on Heikin Ashi ChartThis script enables calling and/or plotting of traditional Candles sources while loaded on Heikin Ashi charts.
Thanks to @PineCoders for rounding method: www.pinecoders.com
Thanks to @BeeHolder for method to regex normalize syminfo.tickerid.
NOTICE: While this script is meant to be utilized on Heikin Ashi charts it does NOT enable ability to backtest!
NOTICE: For more info on why non standard charts cannot be reliably backtested please see:
NOTICE: This is an example script and not meant to be used as an actual strategy. By using this script or any portion thereof, you acknowledge that you have read and understood that this is for research purposes only and I am not responsible for any financial losses you may incur by using this script!

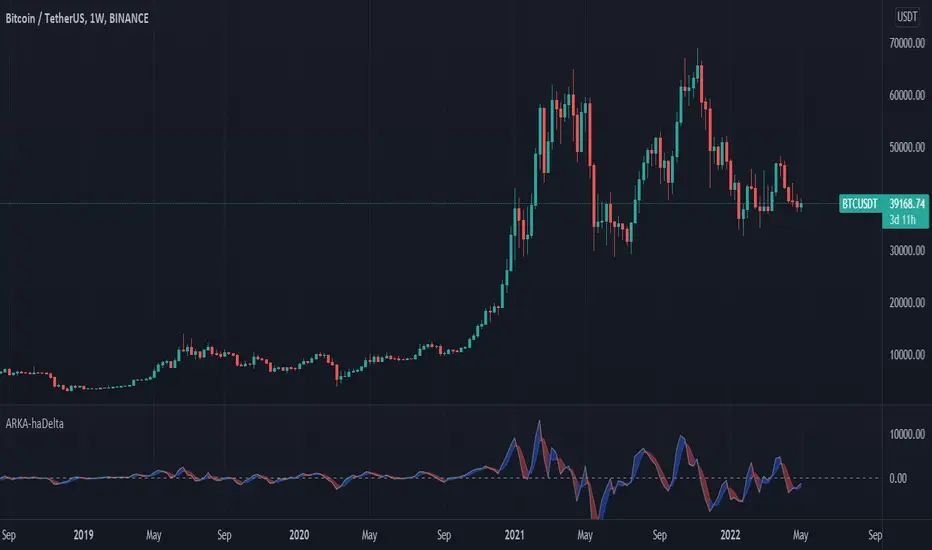
haDeltaThis Indicator is based on Mr. Dan Valcu ideas.
Bodies of candles(open-close) are the main component used to indicate and assess trend direction, strength, and reversals.
The indicator measures difference between Heikin Ashi close and open.
Measuring the height of candle bodies leads to extreme values that point to trend slowdowns. Thus quantifies Heikin Ashi to get earlier signals.
I used this indicator on Heiken Ashi charts but, it's possible to choose to calculate Body size based on Heiken Ashi or Candles.
haDelta can be smoothed with a simple moving average.
We see that crossings between the haDelta and SMA confirm trend
changes with an anticipated delay introduced by each average. Crossings between the indicator and its average are better
confirmations of trend changes.
When Delta crosses above SMA it is an uptrend.
When Delta crosses below SMA it is a downtrend.
Default haDelta smoothed value is by applying 3 periods SMA.
Also, it is possible to deactivate SMA and see just The Delta Values.
In this indicator can choose the MA period and type.
Smoothed Heiken AshiIt is a Heiken Ashi candle overlay. It has a selectable moving average before HA calculation and another after HA calculation, to smooth original Heiken Ashi candles.
It can be used:
Detecting Short/Long term trend direction
Dynamic support/resistance, not just a line, but it has a height
Trailing stop
Trend reversal detection, when price cross above/below Heiken Ashi candle
A lot of moving averages can be selected to adjust it to the selected market.
It uses my TAExt library, so you can use it in your strategies as well.

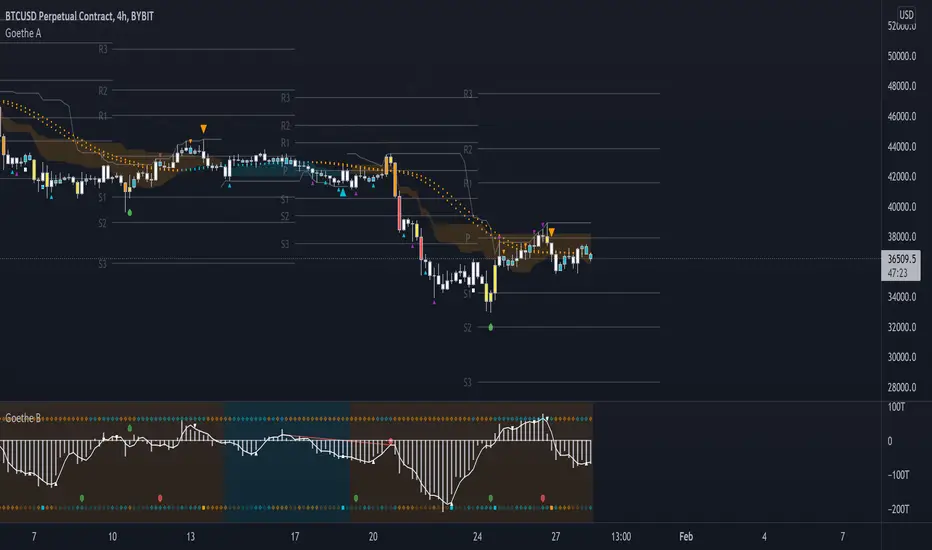
Goethe A - Multiple Leading Indicator PackageGoethe A is an Indicator Package that contains multiple leading and lagging indicators.
The background is that shows the local trend is calculated by either two Moving Averages or by a Kumo Cloud. By default the Kumo Cloud calculation is used.
What are those circles?
-These are OBV (or VPT, can be set in the options) Divergences. Red for Regular-Bearish. Orange for Hidden-Bearish. Green for Regular-Bullish. Aqua for Hidden-Bullish.
What this middle line?
-The middle line is calculated by a smoothed Heikin-Ashi indicator. I can be used as a dynamic zone of support and resistance. Many times this indicator is used as entry signal giver in trend following strategies.
What are those background lines?
-The background contains a simple Daily Pivots indicator. This indicator can be read as zones of Support and Resistance that updated based on the used timeframe.
What is this smaller thin grey line?
-This is a very simple Stoploss indicator based on Donchian Channels. The trade direction is based and calculated by the local trend (background color)
What are those small orange or aqua triangles?
- These are Pivots . They show when the OBV or wolfpack oscillators (or a double confirmation of both) might reverse, this is important to know because many times the price action follows this move.
What are those purple triangles?
- These are Pivots . They show when the PVT oscillator might reverse, this is important to know because many times the price action follows this move.
What are those big orange or aqua triangles?
- These are TSI (true strength indicator) entry signals . They are calculated by the TSI entry signal, the TSI oscillator treshold and in conjunction with the overall local trend (background color).
What are those white squares?
- These are Overbought or Oversold regions of the build-in RSI bands indicator. Every time the price crosses one of the RSI bands those squares are printed. Most of the time this happens after a move and indicates that this strong move has come to an end.
Most settings of the indicator package can be modified to your liking and based on your chosen strategy might have to be modified. Please keep in mind that this indicator is a tool and not a strategy, do not blindly trade signals, do your own research first! Use this indicator in conjunction with other indicators to get multiple confirmations.
Heikin Ashi Bar OverlayThis script shows Heikin Ashi bars on your chart with specified vertical offset
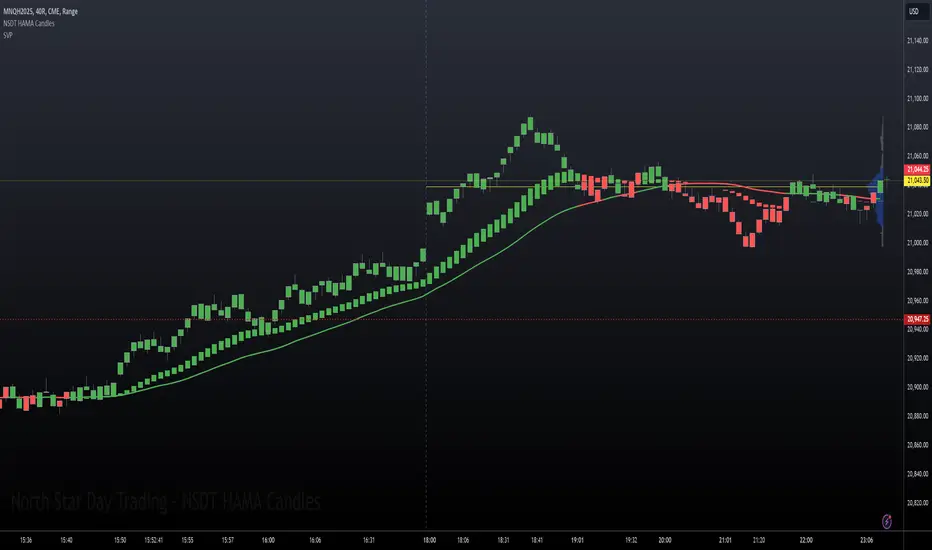
NSDT HAMA Candles STRATThis is a STRATEGY based on our popular HAMA Candles Indicator.
It is an "Always On" strategy, meaning it will stay in a Long position until the Short criteria shows up, and then it will close the Long position and immediately enter a Short position.
Since this is a strategy, we added a few more components. The most notable one is the grid at the top right that shows the statistics of whatever the current settings are. The user can change the MA lengths and see the potential results update in real time.
Since this is Always On and uses Moving Averages, we added an ADX setting to help filter our trades in a ranging/choppy market.
The settings will need to be adjusted to find the best fit for your instrument, chart time, and risk management plan.

Heikin Ashi Candles [Improved] - real closing priceHeikin Ashi Candles - with real closing price!, and with a Heikin Ashi based moving average!
One of the main functionality of Heikin Ashi is to provide a smoothed price to get clarity in trends. This script builds upon the Heikin Ashi Candlestick I published in 2020 that took the standard Heikin Ashi calculations and added the actual closing price.
The improved version adds a new smoothing calculation to give traders an even better way to display trends. In addition to that, a Heikin Ashi based moving average is added to guide you to take trades in the trend direction. The best part is the users have the ability to display both the real closing price and the Improved Heikin Ashi closing price.
With a few modifications within the smoothing settings, the users can get features like Candle Cloud that provides traders with functionalities like Ichimoku clouds.
Usage:
This indicator serves as a trend tool with enhanced features of the original Heikin Ashi calculations. The indicator help traders to take trades in the same direction of the trend. The new improved version gives traders a new better way to make use of all Heikin Ashi strategies that have been developed during the years. Apply the same methods with this new version.
Disclaimer: No financial advice, only for educational/entertainment purposes.
NSDT HAMA CandlesHAMA (Heiken-Ashi Moving Average) Candles are built using different moving average lengths for the open, high, low, and close. Those levels are then run through the Heiken-Ashi Candle formula to create a new hybrid candle on the chart. There is an additional Moving Average plotted as well for overall direction.
This may be used best for identifying trending markets. By referencing the HAMA Candle indicator, it may help guide you to stay in a trade a bit longer, or wait a bit longer before entering at the beginning of a potential trend.
We added a Gradient Color scheme option for a more colorful view of potential trend directional changes. The gradient code is taken from the Pinecoders Gradient Framework (Pro Advance/Decline Gradient example) at
There are three different Moving Average types to choose from. (EMA, SMA, WMA). All MA lengths can be modified. All colors can be modified. All options can be turned on or off.
This was previously an "invite-only" indicator, but we decided to publish it publicly and open source.
All for One Moving AverageThis is a collection of all the moving averages available. Some are built-in, a couple were tricky to source out.
Higher timeframes can be specified so you aren't limited to your chart setting.
Repainting has been disabled by default.
There is also an option to use Heikin Ashi candles as the input source rather than standard bars.
Hope that someone finds this useful.
If you'd like anything added please DM me and I'll include it!
Feel free to copy this into your own strategies/indicators.
~Dark

Heikin Ashi Candle Startegy for Long PositionThis strategy utilize Heikin-Ashi candlestick chart.
Heikin-Ashi technique is a Japanese candlestick-based technical trading tool that uses candlestick charts to represent and visualize market price data.
Heikin-Ashi candle is essentially taking an average of the movement.
There is a tendency with Heikin-Ashi for the candles to stay red during a downtrend and green during an uptrend.
This strategy only apply for long trading position.
The idea is trader will waiting 3 green candles for validation period (confirmation) before entering long position.
Different timeframe will result different result.
Number of validation period can be changed to see different result
This strategy has parameter for take profit percentage, trailing stop and stop loss.
User can set maximum active position to minimize risk and qty order.
This tool is useful for user who wants to backtest Heikin-Ashi trading strategy.
Script will emit alert when long position is opened and closed.
Warning of Backtesting
Backtesting is backward-looking. As the name implies, you are testing how something would have worked if you traded it perfectly in the past.
Past performance does not indicate future performance and you should not assume it does.
Backtesting assumes you never miss-fire, that you get in and out at the exactly perfect moment each time.
Backtesting assumes you have perfect liquidity, and your limit orders fill at a specific, pre-defined price every time (either the open, close, low, high, or some average of these).
Disclaimer
Do your own research and consider fundamental price of asset.
The indicators provided on this script is for educational purposes only.
Author does not offer advisory or brokerage services, nor does it recommend or advise users to buy or sell particular stocks or securities.
Please examined script and give feedback for further improvement.
Script are open to public, everyone see and clone source code or just apply to chart. Please make comment for improvement.

Ichimoku w/Heikin-Ashi Ichimoku w/Heikin-Ashi displays the Heikin-Ashi and leading lagging span of Ichimoku Kinko Hyo.
If you change to Heikin-Ashi as it is, the basis of the calculation of Ichimoku will also use the Heikin-Ashi, so after displaying the Heikin-Ashi independently, then the calculation uses the original candlestick.
Initially, two candlesticks are displayed so that you can switch between candlesticks and Heikin-Ashi. If you uncheck the standard candlesticks check box to hide them, only Heikin-Ashi will be displayed.
In addition, the lagging span is displayed as the leading lagging span in order to align the viewpoint to one current place.
一目均衡表の遅行スパンを先行させ、平均足を表示させる指標です。
標準のまま平均足に変更すると均衡表の計算のベースも平均足を使ってしまうため、平均足を独立して表示させた上で計算は元のローソク足を使用しています。
ローソク足と平均足を切り替えられるように、最初は2つのローソク足が表示されますが、標準のローソク足のチェックボックスを外して非表示とすれば平均足のみの表示となります。
また視点を現在の1箇所に揃えるために遅行スパンを先行遅行スパンとして表示しています。
