Hash Ratings EngineHash Ratings Engine - Technical Consensus Strategy
A systematic trading strategy that harnesses TradingView's Technical Ratings to generate high-conviction entries with institutional-grade risk management.
What It Does
This strategy aggregates the consensus of 26+ technical indicators (RSI, MACD, Stochastics, multiple Moving Averages, etc.) into a single actionable signal. When enough indicators align bullish or bearish, the engine triggers an entry. Built-in trend filtering and ATR-based exits keep you on the right side of the market.
Key Features
Trend Filter - Only takes longs in uptrends, shorts in downtrends. This single filter typically improves results by 20-40% by avoiding counter-trend trades.
ATR-Based Risk Management - Stop loss and trailing stops adapt to current market volatility. Tight stops in calm markets, wider stops in volatile conditions.
Cooldown System - After a losing trade, the strategy waits before re-entering. This prevents the consecutive loss streaks that destroy accounts.
Clean Visuals - Fluorescent entry/exit signals with price level references. See exactly where you got in and out.
Settings Guide
Indicator Timeframe: Leave blank for current chart. Use higher timeframe for fewer, higher-quality signals.
Rating Source: "All" for balanced approach. "MAs" for trend-following. "Oscillators" for mean-reversion.
Entry Thresholds
Strong Signal Threshold: Higher = fewer trades but better conviction. Start at 0.5, test 0.4-0.6.
Risk Management
ATR Period: 12 is responsive, 14 is standard, 20+ is smoother.
Stop Loss: 2-3x ATR for tight stops, 3.5-4x for moderate, 5x+ for wide.
Trail Activation: How far price must move in profit before trailing begins.
Trail Offset: How closely the trail follows price.
Trend Filter
EMA Length: 150 works well on 4H charts. Use 100 for lower timeframes, 200 for daily.
Trade Timing
Cooldown: Keep enabled. 5 bars is a good starting point.
Best Practices
Start with default settings and backtest on your preferred instrument. Adjust the Strong Signal Threshold first - this has the biggest impact on trade frequency. Then tune the EMA length to match your timeframe. Finally, optimize the ATR multipliers for your risk tolerance.
Works on any liquid market - crypto, forex, stocks, futures. Higher timeframes (4H, Daily) tend to produce cleaner signals than lower timeframes.
Disclaimer
Past performance does not guarantee future results. Always backtest thoroughly and use proper position sizing. This strategy is for educational purposes - trade at your own risk.
Automated


STRATEGY 1 │ Red Dragon │ Model 1 │ [Titans_Invest]The Red Dragon Model 1 is a fully automated trading strategy designed to operate BTC/USDT.P on the 4-hour chart with precision, stability, and consistency. It was built to deliver reliable behavior even during strong market movements, maintaining operational discipline and avoiding abrupt variations that could interfere with the trader’s decision-making.
Its core is based on a professionally engineered logical structure that combines trend filters, confirmation criteria, and balanced risk management. Every component was designed to work in an integrated way, eliminating noise, avoiding unnecessary trades, and protecting capital in critical moments. There are no secret mechanisms or hidden logic: everything is built to be objective, clean, and efficient.
Even though it is based on professional quantitative engineering, Red Dragon Model 1 remains extremely simple to operate. All logic is clearly displayed and fully accessible within TradingView itself, making it easy to understand for both beginners and experienced traders. The structure is organized so that any user can quickly view entry conditions, exit criteria, additional filters, adjustable parameters, and the full mechanics behind the strategy’s behavior.
In addition, the architecture was built to minimize unnecessary complexity. Parameters are straightforward, intuitive, and operate in a balanced way without requiring deep adjustments or advanced knowledge. Traders have full freedom to analyze the strategy, understand the logic, and make personal adaptations if desired—always with total transparency inside TradingView.
The strategy was also designed to deliver consistent operational behavior over the long term. Its confirmation criteria reduce impulsive trades; its filters isolate noise; and its overall logic prioritizes high-quality entries in structured market movements. The goal is to provide a stable, clear, and repeatable flow—essential characteristics for any medium-term quantitative approach.
Combining clarity, professional structure, and ease of use, Red Dragon Model 1 offers a solid foundation both for users who want a ready-to-use automated strategy and for those looking to study quantitative models in greater depth.
This entire project was built with extreme dedication, backed by more than 14,000 hours of hands-on experience in Pine Script, continuously refining patterns, techniques, and structures until reaching its current level of maturity. Every line of code reflects this long process of improvement, resulting in a strategy that unites professional engineering, transparency, accessibility, and reliable execution.
🔶 MAIN FEATURES
• Fully automated and robust: Operates without manual intervention, ideal for traders seeking consistency and stability. It delivers reliable performance even in volatile markets thanks to the solid quantitative engineering behind the system.
• Multiple layers of confirmation: Combines 10 key technical indicators with 15 adaptive filters to avoid false signals. It only triggers entries when all trend, market strength, and contextual criteria align.
• Configurable and adaptable filters: Each of the 15 filters can be enabled, disabled, or adjusted by the user, allowing the creation of personalized statistical models for different assets and timeframes. This flexibility gives full freedom to optimize the strategy according to individual preferences.
• Clear and accessible logic: All entry and exit conditions are explicitly shown within the TradingView parameters. The strategy has no hidden components—any user can quickly analyze and understand each part of the system.
• Integrated exclusive tools: Includes complete backtest tables (desktop and mobile versions) with annualized statistics, along with real-time entry conditions displayed directly on the chart. These tools help monitor the strategy across devices and track performance and risk metrics.
• No repaint: All signals are static and do not change after being plotted. This ensures the trader can trust every entry shown without worrying about indicators rewriting past values.
🔷 ENTRY CONDITIONS & RISK MANAGEMENT
Red Dragon Model 1 triggers buy (long) or sell (short) signals only when all configured conditions are satisfied. For example:
• Volume:
• The system only trades when current volume exceeds the volume moving average multiplied by a user-defined factor, indicating meaningful market participation.
• RSI:
• Confirms bullish bias when RSI crosses above its moving average, and bearish bias when crossing below.
• ADX:
• Enters long when +DI is above –DI with ADX above a defined threshold, indicating directional strength to the upside (and the opposite conditions for shorts).
• Other indicators (MACD, SAR, Ichimoku, Support/Resistance, etc.)
Each one must confirm the expected direction before a final signal is allowed.
When all bullish criteria are met simultaneously, the system enters Long; when all criteria indicate a bearish environment, the system enters Short.
In addition, the strategy uses fixed Take Profit and Stop Loss targets for risk control:
Currently: TP around 1.5% and SL around 2.0% per trade, ensuring consistent and transparent risk management on every position.
⚙️ INDICATORS
__________________________________________________________
1) 🔊 Volume: Avoids trading on flat charts.
2) 🍟 MACD: Tracks momentum through moving averages.
3) 🧲 RSI: Indicates overbought or oversold conditions.
4) 🅰️ ADX: Measures trend strength and potential entry points.
5) 🥊 SAR: Identifies changes in price direction.
6) ☁️ Cloud: Accurately detects changes in market trends.
7) 🌡️ R/F: Improves trend visualization and helps avoid pitfalls.
8) 📐 S/R: Fixed support and resistance levels.
9)╭╯MA: Moving Averages.
10) 🔮 LR: Forecasting using Linear Regression.
__________________________________________________________
🟢 ENTRY CONDITIONS 🔴
__________________________________________________________
IF all conditions are 🟢 = 📈 Long
IF all conditions are 🔴 = 📉 Short
__________________________________________________________
🚨 CURRENT TRIGGER SIGNAL 🚨
__________________________________________________________
🔊 Volume
🟢 LONG = (volume) > (MA_volume) * (Volume Mult)
🔴 SHORT = (volume) > (MA_volume) * (Volume Mult)
🧲 RSI
🟢 LONG = (RSI) > (RSI_MA)
🔴 SHORT = (RSI) < (RSI_MA)
🟢 ALL ENTRY CONDITIONS AVAILABLE 🔴
__________________________________________________________
🔊 Volume
🟢 LONG = (volume) > (MA_volume) * (Volume Mult)
🔴 SHORT = (volume) > (MA_volume) * (Volume Mult)
🔊 Volume
🟢 LONG = (volume) > (MA_volume) * (Volume Mult) and (close) > (open)
🔴 SHORT = (volume) > (MA_volume) * (Volume Mult) and (close) < (open)
🍟 MACD
🟢 LONG = (MACD) > (Signal Smoothing)
🔴 SHORT = (MACD) < (Signal Smoothing)
🧲 RSI
🟢 LONG = (RSI) < (Upper)
🔴 SHORT = (RSI) > (Lower)
🧲 RSI
🟢 LONG = (RSI) > (RSI_MA)
🔴 SHORT = (RSI) < (RSI_MA)
🅰️ ADX
🟢 LONG = (+DI) > (-DI) and (ADX) > (Treshold)
🔴 SHORT = (+DI) < (-DI) and (ADX) > (Treshold)
🥊 SAR
🟢 LONG = (close) > (SAR)
🔴 SHORT = (close) < (SAR)
☁️ Cloud
🟢 LONG = (Cloud A) > (Cloud B)
🔴 SHORT = (Cloud A) < (Cloud B)
☁️ Cloud
🟢 LONG = (Kama) > (Kama )
🔴 SHORT = (Kama) < (Kama )
🌡️ R/F
🟢 LONG = (high) > (UP Range) and (upward) > (0)
🔴 SHORT = (low) < (DOWN Range) and (downward) > (0)
🌡️ R/F
🟢 LONG = (high) > (UP Range)
🔴 SHORT = (low) < (DOWN Range)
📐 S/R
🟢 LONG = (close) > (Resistance)
🔴 SHORT = (close) < (Support)
╭╯MA2️⃣
🟢 LONG = (Cyan Bar MA2️⃣)
🔴 SHORT = (Red Bar MA2️⃣)
╭╯MA2️⃣
🟢 LONG = (close) > (MA2️⃣)
🔴 SHORT = (close) < (MA2️⃣)
╭╯MA2️⃣
🟢 LONG = (Positive MA2️⃣)
🔴 SHORT = (Negative MA2️⃣)
__________________________________________________________
🎯 TP / SL 🛑
__________________________________________________________
🎯 TP: 1.5 %
🛑 SL: 2.0 %
__________________________________________________________
🪄 UNIQUE FEATURES OF THIS STRATEGY
____________________________________
1) 𝄜 Table Backtest for Mobile.
2) 𝄜 Table Backtest for Computer.
3) 𝄜 Table Backtest for Computer & Annual Performance.
4) 𝄜 Live Entry Conditions.
1) 𝄜 Table Backtest for Mobile.
2) 𝄜 Table Backtest for Computer.
3) 𝄜 Table Backtest for Computer & Annual Performance.
4) 𝄜 Live Entry Conditions.
_____________________________
𝄜 BACKTEST / PERFORMANCE 𝄜
_____________________________
• Net Profit: +634.47%, Maximum Drawdown: -18.44%.
🪙 PAIR / TIMEFRAME ⏳
🪙 PAIR: BINANCE:BTCUSDT.P
⏳ TIME: 4 hours (240m)
✅ ON ☑️ OFF
✅ LONG
✅ SHORT
🎯 TP / SL 🛑
🎯 TP: 1.5 (%)
🛑 SL: 2.0 (%)
⚙️ CAPITAL MANAGEMENT
💸 Initial Capital: 10000 $ (TradingView)
💲 Order Size: 10 % (Of Equity)
🚀 Leverage: 10 x (Exchange)
💩 Commission: 0.03 % (Exchange)
📆 BACKTEST
🗓️ Start: Setember 24, 2019
🗓️ End: November 21, 2025
🗓️ Days: 2250
🗓️ Yers: 6.17
🗓️ Bars: 13502
📊 PERFORMANCE
💲 Net Profit: + 63446.89 $
🟢 Net Profit: + 634.47 %
💲 DrawDown Maximum: - 10727.48 $
🔴 DrawDown Maximum: - 18.44 %
🟢 Total Closed Trades: 1042
🟡 Percent Profitable: 63.92 %
🟡 Profit Factor: 1.247
💲 Avg Trade: + 60.89 $
⏱️ Avg # Bars in Trades
🕯️ Avg # Bars: 4
⏳ Avg # Hrs: 15
✔️ Trades Winning: 666
❌ Trades Losing: 376
✔️ Maximum Consecutive Wins: 11
❌ Maximum Consecutive Losses: 7
📺 Live Performance : br.tradingview.com
• Use this strategy on the recommended pair and timeframe above to replicate the tested results.
• Feel free to experiment and explore other settings, assets, and timeframes.

EMA Cross + RSI + ADX - Autotrade Strategy V2Overview
A versatile trend-following strategy combining EMA 9/21 crossovers with RSI momentum filtering and optional ADX trend strength confirmation. Designed for both cryptocurrency and traditional futures/options markets with built-in stop loss management and automated position reversals.
Key Features
Multi-Market Compatibility: Works on both crypto futures (Bitcoin, Ethereum) and traditional markets (NIFTY, Bank NIFTY, S&P 500 futures, equity options)
Triple Confirmation System: EMA crossover + RSI filter + ADX strength (optional)
Automated Risk Management: 2% stop loss with wick-touch detection
Position Auto-Reversal: Opposite signals automatically close and reverse positions
Webhook Ready: Six distinct alert messages for automation (Entry Buy/Sell, Close Long/Short, SL Hit Long/Short)
Performance Metrics
NIFTY Futures (15min): 50%+ win rate with ADX filter OFF
Crypto Markets: Requires extensive backtesting before live deployment
Optimal Timeframes: 15-minute to 1-hour charts (patience required for higher timeframes)
Strategy Logic
Entry Signals:
LONG: EMA 9 crosses above EMA 21 + RSI > 55 + ADX > 20 (if enabled)
SHORT: EMA 9 crosses below EMA 21 + RSI < 45 + ADX > 20 (if enabled)
Exit Signals:
Opposite EMA crossover (auto-closes current position)
Stop loss hit at 2% from entry price (tracks candle wicks)
Technical Indicators:
Fast EMA: 9-period (short-term trend)
Slow EMA: 21-period (primary trend)
RSI: 14-period with 55/45 thresholds (momentum confirmation)
ADX: 14-period with 20 threshold (trend strength filter - optional)
Market-Specific Settings
Traditional Markets (NIFTY, Bank NIFTY, S&P Futures, Options)
Recommended Settings:
ADX Filter: Turn OFF (less choppy, cleaner trends)
Timeframe: 15-minute chart
Win Rate: 50%+ on NIFTY Futures
Why No ADX: Traditional markets have more institutional participation and smoother price action, making ADX unnecessary
Cryptocurrency Markets (BTC, ETH, Altcoins)
Recommended Settings:
ADX Filter: Turn ON (ADX > 20)
Timeframe: 15-minute to 1-hour
Extensive backtesting required before live trading
Why ADX: Crypto markets are highly volatile and prone to false breakouts; ADX filters low-quality chop
Best Practices
✅ Backtest thoroughly on your specific instrument and timeframe
✅ Use larger timeframes (1H, 4H) for higher quality signals and better risk/reward
✅ Adjust RSI thresholds based on market volatility (try 52/48 for more signals, 60/40 for fewer but stronger)
✅ Monitor ADX effectiveness - disable for traditional markets, enable for crypto
✅ Proper position sizing - adjust default_qty_value based on your capital and instrument price
✅ Paper trade first - test for 2-4 weeks before risking real capital
Risk Management
Fixed 2% stop loss per trade (adjustable)
Stop loss tracks candle wicks for accurate execution
Positions auto-reverse on opposite signals (no manual intervention needed)
0.075% commission built into backtest (adjust for your broker)
Customization Options
All parameters are adjustable via inputs:
EMA periods (default: 9/21)
RSI length and thresholds (default: 14-period, 55/45 levels)
ADX length and threshold (default: 14-period, 20 threshold)
Stop loss percentage (default: 2%)
Webhook Automation
This strategy includes six distinct alert messages for automated trading:
"Entry Buy" - Long position opened
"Entry Sell" - Short position opened
"Close Long" - Long position closed on opposite crossover
"Close Short" - Short position closed on opposite crossover
"SL Hit Long" - Long stop loss triggered
"SL Hit Short" - Short stop loss triggered
Compatible with Delta Exchange, Binance Futures, 3Commas, Alertatron, and other webhook platforms.
Important Notes
⚠️ Crypto markets require extensive backtesting - volatility patterns differ significantly from traditional markets
⚠️ Higher timeframes = better results - 15min works but 1H/4H provide cleaner signals
⚠️ ADX toggle is critical - OFF for traditional markets, ON for crypto
⚠️ Not financial advice - always conduct your own research and use proper risk management
⚠️ Past performance ≠ future results - backtest results may not reflect live trading conditions
Disclaimer
This strategy is for educational and informational purposes only. Trading futures and options involves substantial risk of loss. Always backtest thoroughly, start with paper trading, and never risk more than you can afford to lose. The author assumes no responsibility for any trading losses incurred using this strategy.

Weekend Hunter Ultimate v6.2 Weekend Hunter Ultimate v6.2 - Automated Crypto Weekend Trading System
OVERVIEW:
Specialized trading strategy designed for cryptocurrency weekend markets (Saturday-Sunday) when institutional traders are typically offline and market dynamics differ significantly from weekdays. Optimized for 15-minute timeframe execution with multi-timeframe confluence analysis.
KEY FEATURES:
- Weekend-Only Trading: Automatically activates during configurable weekend hours
- Dynamic Leverage: 5-20x leverage adjusted based on market safety and signal confidence
- Multi-Timeframe Analysis: Combines 4H trend, 1H momentum, and 15M execution
- 10 Pre-configured Crypto Pairs: BTC, ETH, LINK, XRP, DOGE, SOL, AVAX, PEPE, TON, POL
- Position & Risk Management: Max 4 concurrent positions, -30% account protection
- Smart Trailing Stops: Protects profits when approaching targets
RISK MANAGEMENT:
- Maximum daily loss: 5% (configurable)
- Maximum weekend loss: 15% (configurable)
- Per-position risk: Capped at 120-156 USDT
- Emergency stops for flash crashes (8% moves)
- Consecutive loss protection (4 losses = pause)
TECHNICAL INDICATORS:
- CVD (Cumulative Volume Delta) divergence detection
- ATR-based dynamic stop loss and take profit
- RSI, MACD, Bollinger Bands confluence
- Volume surge confirmation (1.5x average)
- Weekend liquidity adjustments
INTEGRATION:
- Designed for Bybit Futures (0.075% taker fee)
- WunderTrading webhook compatibility via JSON alerts
- Minimum position size: 120 USDT (Bybit requirement)
- Initial capital: $500 recommended
TARGET METRICS:
- Win rate target: 65%
- Average win: 5.5%
- Average loss: 1.8%
- Risk-reward ratio: ~3:1
IMPORTANT DISCLAIMERS:
- Past performance does not guarantee future results
- Leveraged trading carries substantial risk of loss
- Weekend crypto markets have 13% of normal liquidity
- Not suitable for traders who cannot afford to lose their entire investment
- Requires continuous monitoring and adjustment
USAGE:
1. Apply to 15-minute charts only
2. Configure weekend hours for your timezone
3. Set up webhook alerts for automation
4. Monitor performance table in top-right corner
5. Adjust parameters based on your risk tolerance
This is an experimental strategy for educational purposes. Always test with small amounts first and never invest more than you can afford to lose completely.

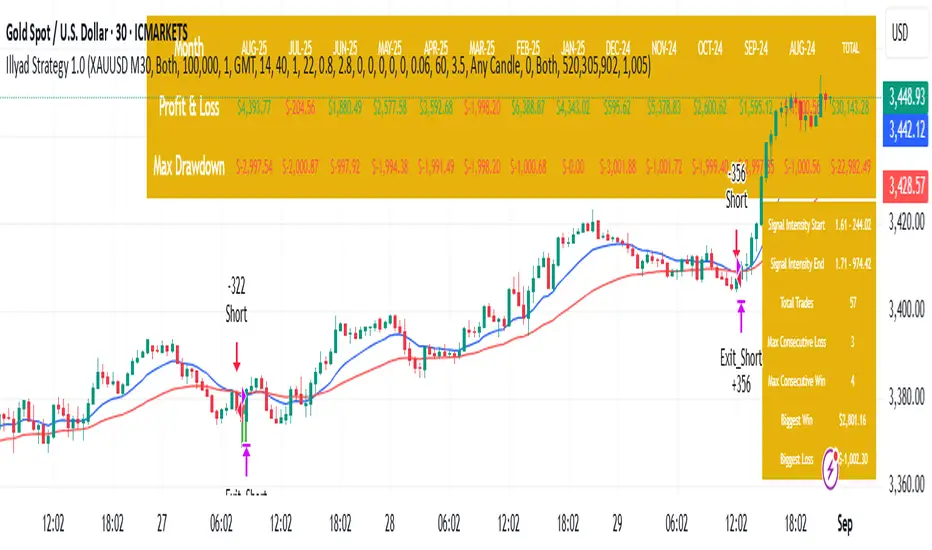
Optimised XAU/USD (Gold, IC Markets, 30m)The Illyad Strategy 1.0 optimised for XAU/USD (Gold) on the 30-minute timeframe (IC Markets feed).
📊 Backtest Results (Jan 2024 – Aug 2025):
✅ Total P&L: +30,143.28 USD (+30.14%)
📉 Max Drawdown: 3.60% (3,945.84 USD)
🔁 Total Trades: 57
📈 Win Rate: 42.11% (24/57 trades)
⚖️ Profit Factor: 1.91
This setup shows steady performance and low drawdown on Gold — ideal for traders wanting to capture volatility while maintaining consistency.
🔧 Optimisation Notes:
Works best on the 30m timeframe.
Each instrument (forex, indices, commodities, stocks) has unique behaviour.
To maximise results, always optimise the parameters per symbol — e.g., Gold requires a different configuration than GBP/USD or NASDAQ.
💡 Best Use Cases:
Prop firm challenges & scaling funded accounts.
Long-term compounding with low risk.
Automated execution via TradingView alerts → MT5 for hands-free trading.
⚠️ Disclaimer:
This strategy is for educational purposes only. Past results do not guarantee future performance. Always backtest and forward-test before going live.
📲 Next Steps:
This example demonstrates the Gold (XAU/USD) optimisation. The Illyad Strategy can be tuned for any forex pair, index, or commodity with proper optimisation.
👉 Visit my profile for full automation solutions.
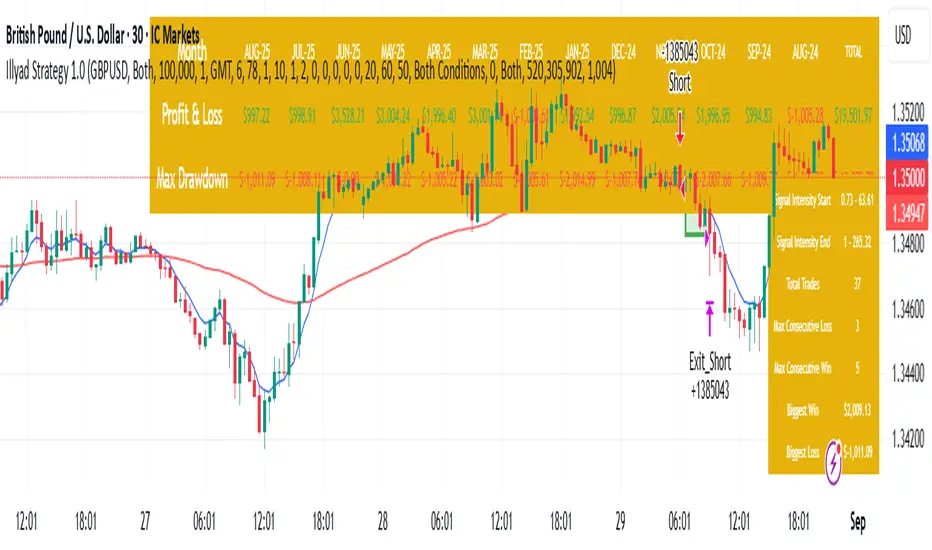
Optimised GBP/USD (IC Markets, 30m)This is the Illyad Strategy 1.0 optimised for GBP/USD on the 30-minute timeframe (IC Markets feed).
📊 Backtest Results (Jan 2024 – Aug 2025):
✅ Total P&L: +19,501.97 USD (+19.50%)
📉 Max Drawdown: 3.57% (3,607.64 USD)
🔁 Total Trades: 37
📈 Win Rate: 51.35% (19/37 trades)
⚖️ Profit Factor: 2.08
This version shows steady profitability with controlled drawdown, making it highly effective for prop firm evaluations and scaling accounts.
🔧 Optimisation Notes:
Works best on the 30-minute timeframe.
Each symbol behaves differently — always optimise the algo per instrument (e.g. GBP/USD vs EUR/GBP vs Gold).
Parameters such as moving averages, risk, and SL/TP ratios can be tuned to maximise performance.
💡 Best Use Cases:
Prop firm challenges (FTMO, AquaFunded, MyForexFunds, etc.).
Scaling funded capital by trading multiple accounts simultaneously.
Full automation via TradingView alerts → MT5 integration.
⚠️ Disclaimer:
This script is for educational purposes only. Past results do not guarantee future performance. Always backtest and forward-test on demo before going live.
📲 Next Steps:
This setup demonstrates the GBP/USD optimisation. The Illyad Strategy can be adjusted to perform across any forex pair, index, or stock with proper optimisation.
👉 Check my profile for full automation solutions.
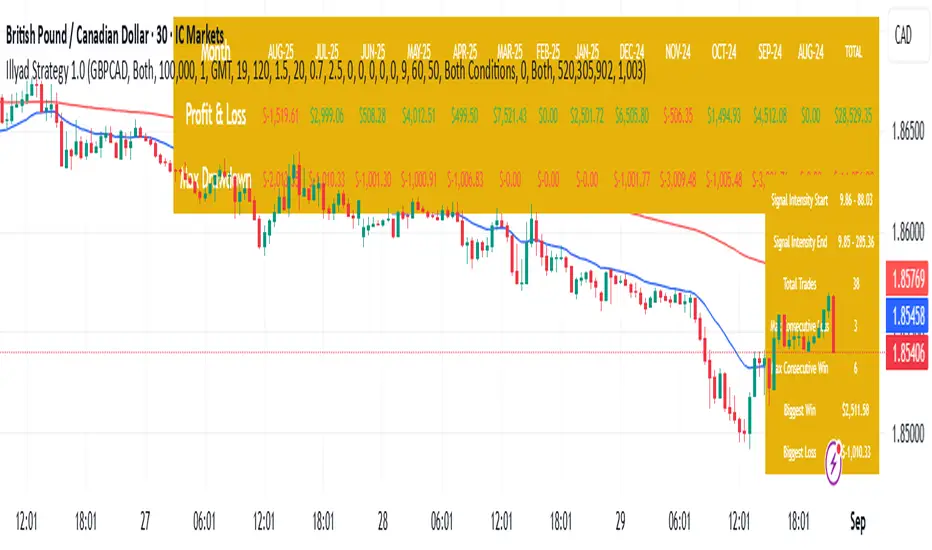
Optimised GBP/CAD (IC Markets, 30m) - Automated TradingHere’s the Illyad Strategy 1.0 optimised for GBP/CAD on the 30-minute timeframe (IC Markets feed).
📊 Backtest Results (Jan 2024 – Aug 2025):
✅ Total P&L: +28,529.35 CAD (+28.53%)
📉 Max Drawdown: 3.61% (3,822.27 CAD)
🔁 Total Trades: 38
📈 Win Rate: 50.00% (19/38 trades)
⚖️ Profit Factor: 2.49
This setup shows strong performance with low drawdown, making it well-suited for prop firm trading and long-term portfolio compounding.
🔧 Optimisation Notes:
Works best on the 30-minute timeframe.
Each symbol has unique volatility and structure. To maximise results, you must optimise the algo per symbol (e.g., GBP/CAD vs EUR/USD vs NASDAQ).
Parameters such as moving averages, signal intensity, and SL/TP levels should be tuned to the instrument.
💡 Best Use Cases:
Prop firm challenges (FTMO, AquaFunded, MyForexFunds alternatives).
Running across multiple accounts simultaneously for compounding.
Automated execution via TradingView alerts → MT5 integration.
⚠️ Disclaimer:
This script is provided for educational purposes only. Past results do not guarantee future performance. Always backtest and forward-test on demo before live trading.
📲 Next Steps:
This version demonstrates the GBP/CAD optimisation. The Illyad Strategy can be tuned to work on any symbol (forex, indices, or stocks).
👉 Visit my profile for full automation solutions (TradingView → MT5)
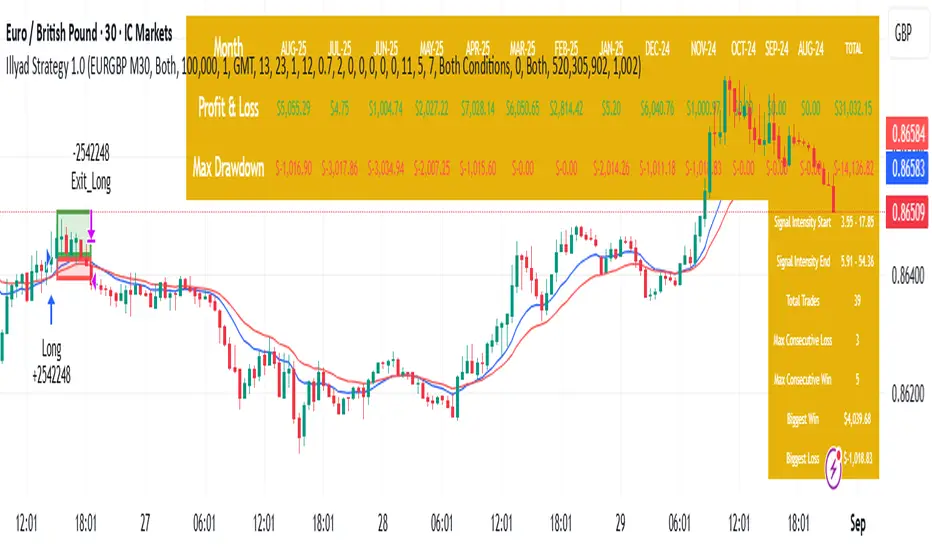
Optimised EURGBP (IC Markets, 30m)Illyad Strategy 1.0 – Optimised EURGBP (IC Markets, 30m)
Description:
This is the Illyad Strategy 1.0 optimised for EURGBP on the 30-minute timeframe (IC Markets feed).
📊 Results (Jan 2024 – Aug 2025):
✅ Total P&L: +£31,032.15 (+31.03%)
📉 Max Drawdown: 2.86% (£3,576.85)
🔁 Total Trades: 39
📈 Win Rate: 58.97%
⚖️ Profit Factor: 2.92
This strategy focuses on controlled drawdown + consistent growth, making it ideal for prop trading challenges and long-term account compounding.
🔧 Optimisation:
Works best on the 30m timeframe.
Each symbol behaves differently — for maximum performance, you should optimise the parameters (MAs, SL/TP, intensity) to the instrument you want to trade.
Example: The EURGBP setup shown here differs from what you’d use on NASDAQ, XAUUSD, or stocks like Tesla.
💡 Best Use Cases:
Passing and scaling prop firm accounts (FTMO, AquaFunded, etc.).
Automated alerts → MT5 integration (hands-free trading).
Consistent, rule-based trading without emotion.
⚠️ Disclaimer:
This script is for educational purposes only. Past results don’t guarantee future performance. Always backtest and forward-test on demo before live trading.
📲 Next Steps:
This version shows the EURGBP optimisation. If you want to run it on other pairs, indices, or stocks → simply optimise parameters for that symbol.
👉 For full automation (TradingView → MT5 execution), check my profile for details.
Signalgo Strategy ISignalgo Strategy I: Technical Overview
Signalgo Strategy I is a systematically engineered TradingView strategy script designed to automate, test, and manage trend-following trades using multi-timeframe price/volume logic, volatility-based targets, and multi-layered exit management. This summary covers its operational structure, user inputs, entry and exit methodology, unique technical features, and practical application.
Core Logic and Workflow
Multi-Timeframe Data Synthesis
User-Defined Timeframe: The user chooses a timeframe (e.g., 1H, 4H, 1D, etc.), on which all strategy signals are based.
Cross-Timeframe Inputs: The strategy imports closing price, volume, and Average True Range (ATR) for the selected interval, independently from the chart’s native timeframe, enabling robust multi-timeframe analysis.
Price Change & Volume Ratio: It calculates the percent change of price per bar and computes a volume ratio by comparing current volume to its 20-bar moving average—enabling detection of true “event” moves vs. normal market noise.
Hype Filtering
Anti-Hype Mechanism: An entry is automatically filtered out if abnormal high volume occurs without corresponding price movement, commonly observed during manipulation or announcement periods. This helps isolate genuine market-driven momentum.
User Inputs
Select Timeframe: Choose which interval drives signal generation.
Backtest Start Date: Specify from which date historical signals are included in the strategy (for precise backtests).
Take-Profit/Stop-Loss Configuration: Internally, risk levels are set as multiples of ATR and allow for three discrete profit targets.
Entry Logic
Trade Signal Criteria:
Price change magnitude in the current bar must exceed a fixed sensitivity threshold.
Volume for the bar must be significantly elevated compared to average, indicating meaningful participation.
Anti-hype check must not be triggered.
Bullish/Bearish Determination: If all conditions are met and price change direction is positive, a long signal triggers. If negative, a short signal triggers.
Signal Debouncing: Ensures a signal triggers only when a new condition emerges, avoiding duplicate entries on flat or choppy bars.
State Management: The script tracks whether an active long or short is open to avoid overlapping entries and to facilitate clean reversals.
Exit Strategy
Take-Profits: Three distinct profit targets (TP1, TP2, TP3) are calculated as fixed multiples of the ATR-based stop loss, adapting dynamically to volatility.
Reversals: If a buy signal appears while a short is open (or vice versa), the existing trade is closed and reversed in a single step.
Time-Based Exit: If, 49 bars after entry, the trade is in-profit but hasn’t reached TP1, it exits to avoid stagnation risk.
Adverse Move Exit: The position is force-closed if it suffers a 10% reversal from entry, acting as a catastrophic stop.
Visual Feedback: Each TP/SL/exit is plotted as a clear, color-coded line on the chart; no hidden logic is used.
Alerts: Built-in TradingView alert conditions allow automated notification for both entries and strategic exits.
Distinguishing Features vs. Traditional MA Strategies
Event-Based, Not Just Slope-Based: While classic moving average strategies enter trades on MA crossovers or slope changes, Signalgo Strategy I demands high-magnitude price and volume confirmation on the chosen timeframe.
Volume Filtering: Very few MA strategies independently filter for meaningful volume spikes.
Real Market Event Focus: The anti-hype filter differentiates organic market trends from manipulated “high-volume, no-move” sessions.
Three-Layer Exit Logic: Instead of a single trailing stop or fixed RR, this script manages three profit targets, time-based closures, and hard adverse thresholds.
Multi-Timeframe, Not Chart-Dependent: The “main” analytical interval can be set independently from the current chart, allowing for in-depth cross-timeframe backtests and system runs.
Reversal Handling: Automatic handling of signal reversals closes and flips positions precisely, reducing slippage and manual error.
Persistent State Tracking: Maintains variables tracking entry price, trade status, and target/stop levels independently of chart context.
Trading Application
Strategy Sandbox: Designed for robust backtesting, allowing users to simulate performance across historical data for any major asset or interval.
Active Risk Management: Trades are consistently managed for both fixed interval “stall” and significant loss, not just via trailing stops or fixed-day closes.
Alert Driven: Can power algorithmic trading bots or notify discretionary traders the moment a qualifying market event occurs.

Mutanabby_AI | Algo Pro Strategy# Mutanabby_AI | Algo Pro Strategy: Advanced Candlestick Pattern Trading System
## Strategy Overview
The Mutanabby_AI Algo Pro Strategy represents a systematic approach to automated trading based on advanced candlestick pattern recognition and multi-layered technical filtering. This strategy transforms traditional engulfing pattern analysis into a comprehensive trading system with sophisticated risk management and flexible position sizing capabilities.
The strategy operates on a long-only basis, entering positions when bullish engulfing patterns meet specific technical criteria and exiting when bearish engulfing patterns indicate potential trend reversals. The system incorporates multiple confirmation layers to enhance signal reliability while providing comprehensive customization options for different trading approaches and risk management preferences.
## Core Algorithm Architecture
The strategy foundation relies on bullish and bearish engulfing candlestick pattern recognition enhanced through technical analysis filtering mechanisms. Entry signals require simultaneous satisfaction of four distinct criteria: confirmed bullish engulfing pattern formation, candle stability analysis indicating decisive price action, RSI momentum confirmation below specified thresholds, and price decline verification over adjustable lookback periods.
The candle stability index measures the ratio between candlestick body size and total range including wicks, ensuring only well-formed patterns with clear directional conviction generate trading signals. This filtering mechanism eliminates indecisive market conditions where pattern reliability diminishes significantly.
RSI integration provides momentum confirmation by requiring oversold conditions before entry signal generation, ensuring alignment between pattern formation and underlying momentum characteristics. The RSI threshold remains fully adjustable to accommodate different market conditions and volatility environments.
Price decline verification examines whether current prices have decreased over a specified period, confirming that bullish engulfing patterns occur after meaningful downward movement rather than during sideways consolidation phases. This requirement enhances the probability of successful reversal pattern completion.
## Advanced Position Management System
The strategy incorporates dual position sizing methodologies to accommodate different account sizes and risk management approaches. Percentage-based position sizing calculates trade quantities as equity percentages, enabling consistent risk exposure across varying account balances and market conditions. This approach proves particularly valuable for systematic trading approaches and portfolio management applications.
Fixed quantity sizing provides precise control over trade sizes independent of account equity fluctuations, offering predictable position management for specific trading strategies or when implementing precise risk allocation models. The system enables seamless switching between sizing methods through simple configuration adjustments.
Position quantity calculations integrate seamlessly with TradingView's strategy testing framework, ensuring accurate backtesting results and realistic performance evaluation across different market conditions and time periods. The implementation maintains consistency between historical testing and live trading applications.
## Comprehensive Risk Management Framework
The strategy features dual stop loss methodologies addressing different risk management philosophies and market analysis approaches. Entry price-based stop losses calculate stop levels as fixed percentages below entry prices, providing predictable risk exposure and consistent risk-reward ratio maintenance across all trades.
The percentage-based stop loss system enables precise risk control by limiting maximum loss per trade to predetermined levels regardless of market volatility or entry timing. This approach proves essential for systematic trading strategies requiring consistent risk parameters and capital preservation during adverse market conditions.
Lowest low-based stop losses identify recent price support levels by analyzing minimum prices over adjustable lookback periods, placing stops below these technical levels with additional buffer percentages. This methodology aligns stop placement with market structure rather than arbitrary percentage calculations, potentially improving stop loss effectiveness during normal market fluctuations.
The lookback period adjustment enables optimization for different timeframes and market characteristics, with shorter periods providing tighter stops for active trading and longer periods offering broader stops suitable for position trading approaches. Buffer percentage additions ensure stops remain below obvious support levels where other market participants might place similar orders.
## Visual Customization and Interface Design
The strategy provides comprehensive visual customization through eight predefined color schemes designed for different chart backgrounds and personal preferences. Color scheme options include Classic bright green and red combinations, Ocean themes featuring blue and orange contrasts, Sunset combinations using gold and crimson, and Neon schemes providing high visibility through bright color selections.
Professional color schemes such as Forest, Royal, and Fire themes offer sophisticated alternatives suitable for business presentations and professional trading environments. The Custom color scheme enables precise color selection through individual color picker controls, maintaining maximum flexibility for specific visual requirements.
Label styling options accommodate different chart analysis preferences through text bubble, triangle, and arrow display formats. Size adjustments range from tiny through huge settings, ensuring appropriate visual scaling across different screen resolutions and chart configurations. Text color customization maintains readability across various chart themes and background selections.
## Signal Quality Enhancement Features
The strategy incorporates signal filtering mechanisms designed to eliminate repetitive signal generation during choppy market conditions. The disable repeating signals option prevents consecutive identical signals until opposing conditions occur, reducing overtrading during consolidation phases and improving overall signal quality.
Signal confirmation requirements ensure all technical criteria align before trade execution, reducing false signal occurrence while maintaining reasonable trading frequency for active strategies. The multi-layered approach balances signal quality against opportunity frequency through adjustable parameter optimization.
Entry and exit visualization provides clear trade identification through customizable labels positioned at relevant price levels. Stop loss visualization displays active risk levels through colored line plots, ensuring complete transparency regarding current risk management parameters during live trading operations.
## Implementation Guidelines and Optimization
The strategy performs effectively across multiple timeframes with optimal results typically occurring on intermediate timeframes ranging from fifteen minutes through four hours. Higher timeframes provide more reliable pattern formation and reduced false signal occurrence, while lower timeframes increase trading frequency at the expense of some signal reliability.
Parameter optimization should focus on RSI threshold adjustments based on market volatility characteristics and candlestick pattern timeframe analysis. Higher RSI thresholds generate fewer but potentially higher quality signals, while lower thresholds increase signal frequency with corresponding reliability considerations.
Stop loss method selection depends on trading style preferences and market analysis philosophy. Entry price-based stops suit systematic approaches requiring consistent risk parameters, while lowest low-based stops align with technical analysis methodologies emphasizing market structure recognition.
## Performance Considerations and Risk Disclosure
The strategy operates exclusively on long positions, making it unsuitable for bear market conditions or extended downtrend periods. Users should consider market environment analysis and broader trend assessment before implementing the strategy during adverse market conditions.
Candlestick pattern reliability varies significantly across different market conditions, with higher reliability typically occurring during trending markets compared to ranging or volatile conditions. Strategy performance may deteriorate during periods of reduced pattern effectiveness or increased market noise.
Risk management through stop loss implementation remains essential for capital preservation during adverse market movements. The strategy does not guarantee profitable outcomes and requires proper position sizing and risk management to prevent significant capital loss during unfavorable trading periods.
## Technical Specifications
The strategy utilizes standard TradingView Pine Script functions ensuring compatibility across all supported instruments and timeframes. Default configuration employs 14-period RSI calculations, adjustable candle stability thresholds, and customizable price decline verification periods optimized for general market conditions.
Initial capital settings default to $10,000 with percentage-based equity allocation, though users can adjust these parameters based on account size and risk tolerance requirements. The strategy maintains detailed trade logs and performance metrics through TradingView's integrated backtesting framework.
Alert integration enables real-time notification of entry and exit signals, stop loss executions, and other significant trading events. The comprehensive alert system supports automated trading applications and manual trade management approaches through detailed signal information provision.
## Conclusion
The Mutanabby_AI Algo Pro Strategy provides a systematic framework for candlestick pattern trading with comprehensive risk management and position sizing flexibility. The strategy's strength lies in its multi-layered confirmation approach and sophisticated customization options, enabling adaptation to various trading styles and market conditions.
Successful implementation requires understanding of candlestick pattern analysis principles and appropriate parameter optimization for specific market characteristics. The strategy serves traders seeking automated execution of proven technical analysis techniques while maintaining comprehensive control over risk management and position sizing methodologies.

Dynamic DCA Envelope – Beta V1.1Dynamic DCA Envelope-Beta V1.1 is a preview version of a Dollar-Cost Averaging (DCA) strategy designed for trending or volatile markets.
-Long Positions Only
-Intended for Cryptocurrency, but can be used in any market
-1 and 4 hour timeframe
-Average Commissions 0.1%-0.3% per trade (Cryptocurrency)
What it does:
This strategy identifies buying opportunities when price closes below a dynamic envelope (based on EMA). After 3 consecutive closes below the lower envelope, the system arms a buy condition. A DCA buy-in is triggered when price bounces by a configurable percentage from the trailing low. The strategy supports up to 3 buy-ins, each equally sized, and closes the entire position at a fixed take profit or stop loss.
How it works:
-Entry logic is based on price deviation from an EMA envelope
-Waits for 3 closes below the envelope to detect weakness
-Uses bounce percentage from the lowest point to trigger each buy
-Includes cooldown logic between buys to avoid clustering
-All positions are closed when TP or SL is hit
How to use it:
-Use on trending assets with volatility (e.g., crypto, tech stocks)
-Adjust inputs to match asset behavior:
-EMA Length
-Envelope Offset %
-Bounce % (Trailing DCA)
-Take Profit / Stop Loss
-View strategy performance in the Strategy Tester tab
What’s unique:
Unlike most DCA scripts that immediately average down, this version includes:
-Trigger logic requiring multiple closes below trend
-Bounce-based entry to avoid catching a falling knife
-Cooldown resets to prevent overtrading
-A true entry–wait–buy–reset loop mimicking disciplined execution
*This is a beta version intended as a preview. A full Pro version is in development, which includes:
-SmartScaling logic
-Trailing take profit
-Multi-symbol scanning
-Backtest range limits
-Risk-adjusted filtering

RSI Full Forecast [Titans_Invest]RSI Full Forecast
Get ready to experience the ultimate evolution of RSI-based indicators – the RSI Full Forecast, a boosted and even smarter version of the already powerful: RSI Forecast
Now featuring over 40 additional entry conditions (forecasts), this indicator redefines the way you view the market.
AI-Powered RSI Forecasting:
Using advanced linear regression with the least squares method – a solid foundation for machine learning - the RSI Full Forecast enables you to predict future RSI behavior with impressive accuracy.
But that’s not all: this new version also lets you monitor future crossovers between the RSI and the MA RSI, delivering early and strategic signals that go far beyond traditional analysis.
You’ll be able to monitor future crossovers up to 20 bars ahead, giving you an even broader and more precise view of market movements.
See the Future, Now:
• Track upcoming RSI & RSI MA crossovers in advance.
• Identify potential reversal zones before price reacts.
• Uncover statistical behavior patterns that would normally go unnoticed.
40+ Intelligent Conditions:
The new layer of conditions is designed to detect multiple high-probability scenarios based on historical patterns and predictive modeling. Each additional forecast is a window into the price's future, powered by robust mathematics and advanced algorithmic logic.
Full Customization:
All parameters can be tailored to fit your strategy – from smoothing periods to prediction sensitivity. You have complete control to turn raw data into smart decisions.
Innovative, Accurate, Unique:
This isn’t just an upgrade. It’s a quantum leap in technical analysis.
RSI Full Forecast is the first of its kind: an indicator that blends statistical analysis, machine learning, and visual design to create a true real-time predictive system.
⯁ SCIENTIFIC BASIS LINEAR REGRESSION
Linear Regression is a fundamental method of statistics and machine learning, used to model the relationship between a dependent variable y and one or more independent variables 𝑥.
The general formula for a simple linear regression is given by:
y = β₀ + β₁x + ε
β₁ = Σ((xᵢ - x̄)(yᵢ - ȳ)) / Σ((xᵢ - x̄)²)
β₀ = ȳ - β₁x̄
Where:
y = is the predicted variable (e.g. future value of RSI)
x = is the explanatory variable (e.g. time or bar index)
β0 = is the intercept (value of 𝑦 when 𝑥 = 0)
𝛽1 = is the slope of the line (rate of change)
ε = is the random error term
The goal is to estimate the coefficients 𝛽0 and 𝛽1 so as to minimize the sum of the squared errors — the so-called Random Error Method Least Squares.
⯁ LEAST SQUARES ESTIMATION
To minimize the error between predicted and observed values, we use the following formulas:
β₁ = /
β₀ = ȳ - β₁x̄
Where:
∑ = sum
x̄ = mean of x
ȳ = mean of y
x_i, y_i = individual values of the variables.
Where:
x_i and y_i are the means of the independent and dependent variables, respectively.
i ranges from 1 to n, the number of observations.
These equations guarantee the best linear unbiased estimator, according to the Gauss-Markov theorem, assuming homoscedasticity and linearity.
⯁ LINEAR REGRESSION IN MACHINE LEARNING
Linear regression is one of the cornerstones of supervised learning. Its simplicity and ability to generate accurate quantitative predictions make it essential in AI systems, predictive algorithms, time series analysis, and automated trading strategies.
By applying this model to the RSI, you are literally putting artificial intelligence at the heart of a classic indicator, bringing a new dimension to technical analysis.
⯁ VISUAL INTERPRETATION
Imagine an RSI time series like this:
Time →
RSI →
The regression line will smooth these values and extend them n periods into the future, creating a predicted trajectory based on the historical moment. This line becomes the predicted RSI, which can be crossed with the actual RSI to generate more intelligent signals.
⯁ SUMMARY OF SCIENTIFIC CONCEPTS USED
Linear Regression Models the relationship between variables using a straight line.
Least Squares Minimizes the sum of squared errors between prediction and reality.
Time Series Forecasting Estimates future values based on historical data.
Supervised Learning Trains models to predict outputs from known inputs.
Statistical Smoothing Reduces noise and reveals underlying trends.
⯁ WHY THIS INDICATOR IS REVOLUTIONARY
Scientifically-based: Based on statistical theory and mathematical inference.
Unprecedented: First public RSI with least squares predictive modeling.
Intelligent: Built with machine learning logic.
Practical: Generates forward-thinking signals.
Customizable: Flexible for any trading strategy.
⯁ CONCLUSION
By combining RSI with linear regression, this indicator allows a trader to predict market momentum, not just follow it.
RSI Full Forecast is not just an indicator — it is a scientific breakthrough in technical analysis technology.
⯁ Example of simple linear regression, which has one independent variable:
⯁ In linear regression, observations ( red ) are considered to be the result of random deviations ( green ) from an underlying relationship ( blue ) between a dependent variable ( y ) and an independent variable ( x ).
⯁ Visualizing heteroscedasticity in a scatterplot against 100 random fitted values using Matlab:
⯁ The data sets in the Anscombe's quartet are designed to have approximately the same linear regression line (as well as nearly identical means, standard deviations, and correlations) but are graphically very different. This illustrates the pitfalls of relying solely on a fitted model to understand the relationship between variables.
⯁ The result of fitting a set of data points with a quadratic function:
_________________________________________________
🔮 Linear Regression: PineScript Technical Parameters 🔮
_________________________________________________
Forecast Types:
• Flat: Assumes prices will remain the same.
• Linreg: Makes a 'Linear Regression' forecast for n periods.
Technical Information:
ta.linreg (built-in function)
Linear regression curve. A line that best fits the specified prices over a user-defined time period. It is calculated using the least squares method. The result of this function is calculated using the formula: linreg = intercept + slope * (length - 1 - offset), where intercept and slope are the values calculated using the least squares method on the source series.
Syntax:
• Function: ta.linreg()
Parameters:
• source: Source price series.
• length: Number of bars (period).
• offset: Offset.
• return: Linear regression curve.
This function has been cleverly applied to the RSI, making it capable of projecting future values based on past statistical trends.
______________________________________________________
______________________________________________________
⯁ WHAT IS THE RSI❓
The Relative Strength Index (RSI) is a technical analysis indicator developed by J. Welles Wilder. It measures the magnitude of recent price movements to evaluate overbought or oversold conditions in a market. The RSI is an oscillator that ranges from 0 to 100 and is commonly used to identify potential reversal points, as well as the strength of a trend.
⯁ HOW TO USE THE RSI❓
The RSI is calculated based on average gains and losses over a specified period (usually 14 periods). It is plotted on a scale from 0 to 100 and includes three main zones:
• Overbought: When the RSI is above 70, indicating that the asset may be overbought.
• Oversold: When the RSI is below 30, indicating that the asset may be oversold.
• Neutral Zone: Between 30 and 70, where there is no clear signal of overbought or oversold conditions.
______________________________________________________
______________________________________________________
⯁ ENTRY CONDITIONS
The conditions below are fully flexible and allow for complete customization of the signal.
______________________________________________________
______________________________________________________
🔹 CONDITIONS TO BUY 📈
______________________________________________________
• Signal Validity: The signal will remain valid for X bars .
• Signal Sequence: Configurable as AND or OR .
📈 RSI Conditions:
🔹 RSI > Upper
🔹 RSI < Upper
🔹 RSI > Lower
🔹 RSI < Lower
🔹 RSI > Middle
🔹 RSI < Middle
🔹 RSI > MA
🔹 RSI < MA
📈 MA Conditions:
🔹 MA > Upper
🔹 MA < Upper
🔹 MA > Lower
🔹 MA < Lower
📈 Crossovers:
🔹 RSI (Crossover) Upper
🔹 RSI (Crossunder) Upper
🔹 RSI (Crossover) Lower
🔹 RSI (Crossunder) Lower
🔹 RSI (Crossover) Middle
🔹 RSI (Crossunder) Middle
🔹 RSI (Crossover) MA
🔹 RSI (Crossunder) MA
🔹 MA (Crossover) Upper
🔹 MA (Crossunder) Upper
🔹 MA (Crossover) Lower
🔹 MA (Crossunder) Lower
📈 RSI Divergences:
🔹 RSI Divergence Bull
🔹 RSI Divergence Bear
📈 RSI Forecast:
🔹 RSI (Crossover) MA Forecast
🔹 RSI (Crossunder) MA Forecast
🔹 RSI Forecast 1 > MA Forecast 1
🔹 RSI Forecast 1 < MA Forecast 1
🔹 RSI Forecast 2 > MA Forecast 2
🔹 RSI Forecast 2 < MA Forecast 2
🔹 RSI Forecast 3 > MA Forecast 3
🔹 RSI Forecast 3 < MA Forecast 3
🔹 RSI Forecast 4 > MA Forecast 4
🔹 RSI Forecast 4 < MA Forecast 4
🔹 RSI Forecast 5 > MA Forecast 5
🔹 RSI Forecast 5 < MA Forecast 5
🔹 RSI Forecast 6 > MA Forecast 6
🔹 RSI Forecast 6 < MA Forecast 6
🔹 RSI Forecast 7 > MA Forecast 7
🔹 RSI Forecast 7 < MA Forecast 7
🔹 RSI Forecast 8 > MA Forecast 8
🔹 RSI Forecast 8 < MA Forecast 8
🔹 RSI Forecast 9 > MA Forecast 9
🔹 RSI Forecast 9 < MA Forecast 9
🔹 RSI Forecast 10 > MA Forecast 10
🔹 RSI Forecast 10 < MA Forecast 10
🔹 RSI Forecast 11 > MA Forecast 11
🔹 RSI Forecast 11 < MA Forecast 11
🔹 RSI Forecast 12 > MA Forecast 12
🔹 RSI Forecast 12 < MA Forecast 12
🔹 RSI Forecast 13 > MA Forecast 13
🔹 RSI Forecast 13 < MA Forecast 13
🔹 RSI Forecast 14 > MA Forecast 14
🔹 RSI Forecast 14 < MA Forecast 14
🔹 RSI Forecast 15 > MA Forecast 15
🔹 RSI Forecast 15 < MA Forecast 15
🔹 RSI Forecast 16 > MA Forecast 16
🔹 RSI Forecast 16 < MA Forecast 16
🔹 RSI Forecast 17 > MA Forecast 17
🔹 RSI Forecast 17 < MA Forecast 17
🔹 RSI Forecast 18 > MA Forecast 18
🔹 RSI Forecast 18 < MA Forecast 18
🔹 RSI Forecast 19 > MA Forecast 19
🔹 RSI Forecast 19 < MA Forecast 19
🔹 RSI Forecast 20 > MA Forecast 20
🔹 RSI Forecast 20 < MA Forecast 20
______________________________________________________
______________________________________________________
🔸 CONDITIONS TO SELL 📉
______________________________________________________
• Signal Validity: The signal will remain valid for X bars .
• Signal Sequence: Configurable as AND or OR .
📉 RSI Conditions:
🔸 RSI > Upper
🔸 RSI < Upper
🔸 RSI > Lower
🔸 RSI < Lower
🔸 RSI > Middle
🔸 RSI < Middle
🔸 RSI > MA
🔸 RSI < MA
📉 MA Conditions:
🔸 MA > Upper
🔸 MA < Upper
🔸 MA > Lower
🔸 MA < Lower
📉 Crossovers:
🔸 RSI (Crossover) Upper
🔸 RSI (Crossunder) Upper
🔸 RSI (Crossover) Lower
🔸 RSI (Crossunder) Lower
🔸 RSI (Crossover) Middle
🔸 RSI (Crossunder) Middle
🔸 RSI (Crossover) MA
🔸 RSI (Crossunder) MA
🔸 MA (Crossover) Upper
🔸 MA (Crossunder) Upper
🔸 MA (Crossover) Lower
🔸 MA (Crossunder) Lower
📉 RSI Divergences:
🔸 RSI Divergence Bull
🔸 RSI Divergence Bear
📉 RSI Forecast:
🔸 RSI (Crossover) MA Forecast
🔸 RSI (Crossunder) MA Forecast
🔸 RSI Forecast 1 > MA Forecast 1
🔸 RSI Forecast 1 < MA Forecast 1
🔸 RSI Forecast 2 > MA Forecast 2
🔸 RSI Forecast 2 < MA Forecast 2
🔸 RSI Forecast 3 > MA Forecast 3
🔸 RSI Forecast 3 < MA Forecast 3
🔸 RSI Forecast 4 > MA Forecast 4
🔸 RSI Forecast 4 < MA Forecast 4
🔸 RSI Forecast 5 > MA Forecast 5
🔸 RSI Forecast 5 < MA Forecast 5
🔸 RSI Forecast 6 > MA Forecast 6
🔸 RSI Forecast 6 < MA Forecast 6
🔸 RSI Forecast 7 > MA Forecast 7
🔸 RSI Forecast 7 < MA Forecast 7
🔸 RSI Forecast 8 > MA Forecast 8
🔸 RSI Forecast 8 < MA Forecast 8
🔸 RSI Forecast 9 > MA Forecast 9
🔸 RSI Forecast 9 < MA Forecast 9
🔸 RSI Forecast 10 > MA Forecast 10
🔸 RSI Forecast 10 < MA Forecast 10
🔸 RSI Forecast 11 > MA Forecast 11
🔸 RSI Forecast 11 < MA Forecast 11
🔸 RSI Forecast 12 > MA Forecast 12
🔸 RSI Forecast 12 < MA Forecast 12
🔸 RSI Forecast 13 > MA Forecast 13
🔸 RSI Forecast 13 < MA Forecast 13
🔸 RSI Forecast 14 > MA Forecast 14
🔸 RSI Forecast 14 < MA Forecast 14
🔸 RSI Forecast 15 > MA Forecast 15
🔸 RSI Forecast 15 < MA Forecast 15
🔸 RSI Forecast 16 > MA Forecast 16
🔸 RSI Forecast 16 < MA Forecast 16
🔸 RSI Forecast 17 > MA Forecast 17
🔸 RSI Forecast 17 < MA Forecast 17
🔸 RSI Forecast 18 > MA Forecast 18
🔸 RSI Forecast 18 < MA Forecast 18
🔸 RSI Forecast 19 > MA Forecast 19
🔸 RSI Forecast 19 < MA Forecast 19
🔸 RSI Forecast 20 > MA Forecast 20
🔸 RSI Forecast 20 < MA Forecast 20
______________________________________________________
______________________________________________________
🤖 AUTOMATION 🤖
• You can automate the BUY and SELL signals of this indicator.
______________________________________________________
______________________________________________________
⯁ UNIQUE FEATURES
______________________________________________________
Linear Regression: (Forecast)
Signal Validity: The signal will remain valid for X bars
Signal Sequence: Configurable as AND/OR
Condition Table: BUY/SELL
Condition Labels: BUY/SELL
Plot Labels in the Graph Above: BUY/SELL
Automate and Monitor Signals/Alerts: BUY/SELL
Linear Regression (Forecast)
Signal Validity: The signal will remain valid for X bars
Signal Sequence: Configurable as AND/OR
Condition Table: BUY/SELL
Condition Labels: BUY/SELL
Plot Labels in the Graph Above: BUY/SELL
Automate and Monitor Signals/Alerts: BUY/SELL
______________________________________________________
📜 SCRIPT : RSI Full Forecast
🎴 Art by : @Titans_Invest & @DiFlip
👨💻 Dev by : @Titans_Invest & @DiFlip
🎑 Titans Invest — The Wizards Without Gloves 🧤
✨ Enjoy!
______________________________________________________
o Mission 🗺
• Inspire Traders to manifest Magic in the Market.
o Vision 𐓏
• To elevate collective Energy 𐓷𐓏

Auto Fibonacci Level Indicator - El Patron=======================================================================
Auto Fibonacci Level Indicator - El Patron
=======================================================================
Description:
This indicator automatically calculates and plots Fibonacci levels based on
the highest high and lowest low of a specified lookback period from a user-
selectable timeframe. It supports a Reverse Fibonacci option to swap the
calculation (i.e. drawing levels from the swing high to the swing low) and
provides intrabar updates using the lookahead feature. Customize the color
for each Fibonacci level to suit your trading style.
Inputs:
- Time Frame:
Choose from "60" (1H), "240" (4H), or "D" (Daily) to retrieve data for
the Fibonacci calculations.
- Lookback Period:
The number of bars (in the selected timeframe) to consider for
determining the highest high and lowest low.
- Reverse Fibonacci:
Check this box to reverse the Fibonacci calculation from the usual low-
to-high to a high-to-low perspective.
- Color Inputs:
Customize the colors for each Fibonacci level, including levels such as
0, 0.11, 0.114, ... , 1.618.
Usage:
1. Apply the indicator to any chart.
2. In the settings panel, adjust the Time Frame, Lookback Period, and
Reverse Fibonacci options as desired.
3. The Fibonacci levels will be plotted as horizontal lines on your chart.
4. Intrabar updates are enabled via the lookahead parameter; note that this
may result in repainting.
Notes:
- When using intrabar lookahead, the levels update during the formation of
the current bar which might cause historical values to change (repainting).
- The indicator can pull data from a different timeframe than the chart's,
which is useful for multi-timeframe analysis.
Author: Turker Balkar - El Patron
Version: 1.0

PineConnectorLibrary "PineConnector"
This library is a comprehensive alert webhook text generator for PineConnector. It contains every possible alert syntax variation from the documentation, along with some debugging functions.
To use it, just import the library (eg. "import ZenAndTheArtOfTrading/PineConnector/1 as pc") and use pc.buy(licenseID) to send an alert off to PineConnector - assuming all your webhooks etc are set up correctly.
View the PineConnector documentation for more information on how to send the commands you're looking to send (all of this library's function names match the documentation).
all()
Usage: pc.buy(pc_id, freq=pc.all())
Returns: "all"
once_per_bar()
Usage: pc.buy(pc_id, freq=pc.once_per_bar())
Returns: "once_per_bar"
once_per_bar_close()
Usage: pc.buy(pc_id, freq=pc.once_per_bar_close())
Returns: "once_per_bar_close"
na0(value)
Checks if given value is either 'na' or 0. Useful for streamlining scripts with float user setting inputs which default values to 0 since na is unavailable as a user input default.
Parameters:
value (float) : The value to check
Returns: True if the given value is 0 or na
getDecimals()
Calculates how many decimals are on the quote price of the current market.
Returns: The current decimal places on the market quote price
truncate(number, decimals)
Truncates the given number. Required params: mumber.
Parameters:
number (float) : Number to truncate
decimals (int) : Decimal places to cut down to
Returns: The input number, but as a string truncated to X decimals
getPipSize(multiplier)
Calculates the pip size of the current market.
Parameters:
multiplier (int) : The mintick point multiplier (1 by default, 10 for FX/Crypto/CFD but can be used to override when certain markets require)
Returns: The pip size for the current market
toWhole(number)
Converts pips into whole numbers. Required params: number.
Parameters:
number (float) : The pip number to convert into a whole number
Returns: The converted number
toPips(number)
Converts whole numbers back into pips. Required params: number.
Parameters:
number (float) : The whole number to convert into pips
Returns: The converted number
debug(txt, tooltip, displayLabel)
Prints to console and generates a debug label with the given text. Required params: txt.
Parameters:
txt (string) : Text to display
tooltip (string) : Tooltip to display (optional)
displayLabel (bool) : Turns on/off chart label (default: off)
Returns: Nothing
order(licenseID, command, symbol, parameters, accfilter, comment, secret, freq, debug)
Generates an alert string. Required params: licenseID, command.
Parameters:
licenseID (string) : Your PC license ID
command (string) : Command to send
symbol (string) : The symbol to trigger this order on
parameters (string) : Other optional parameters to include
accfilter (float) : Optional minimum account balance filter
comment (string) : Optional comment (maximum 20 characters)
secret (string) : Optional secret key (must be enabled in dashboard)
freq (string) : Alert frequency. Default = "all", options = "once_per_bar", "once_per_bar_close" and "none"
debug (bool) : Turns on/off debug label
Returns: An alert string with valid PC syntax based on supplied parameters
market_order(licenseID, buy, risk, sl, tp, betrigger, beoffset, spread, trailtrig, traildist, trailstep, atrtimeframe, atrperiod, atrmultiplier, atrshift, atrtrigger, symbol, accfilter, comment, secret, freq, debug)
Generates a market entry alert with relevant syntax commands. Required params: licenseID, buy, risk.
Parameters:
licenseID (string) : Your PC license ID
buy (bool) : true=buy/long, false=sell/short
risk (float) : Risk quantity (according to EA settings)
sl (float) : Stop loss distance in pips or price
tp (float) : Take profit distance in pips or price
betrigger (float) : Breakeven will be activated after the position gains this number of pips
beoffset (float) : Offset from entry price. This is the amount of pips you'd like to protect
spread (float) : Enter the position only if the spread is equal or less than the specified value in pips
trailtrig (float) : Trailing stop-loss will be activated after a trade gains this number of pips
traildist (float) : Distance of the trailing stop-loss from current price
trailstep (float) : Moves trailing stop-loss once price moves to favourable by a specified number of pips
atrtimeframe (int) : ATR Trailing Stop timeframe, only updates once per bar close. Options: 1, 5, 15, 30, 60, 240, 1440
atrperiod (int) : ATR averaging period
atrmultiplier (float) : Multiple of ATR to utilise in the new SL computation, default = 1
atrshift (int) : Relative shift of price information, 0 uses latest candle, 1 uses second last, etc. Default = 0
atrtrigger (int) : Activate the trigger of ATR Trailing after market moves favourably by a number of pips. Default = 0 (instant)
symbol (string) : The symbol to trigger this order on (defaults to current symbol)
accfilter (float) : Optional minimum account balance filter
comment (string) : Optional comment (maximum 20 characters)
secret (string) : Optional secret key (must be enabled in dashboard)
freq (string) : Alert frequency. Default = "all", options = "once_per_bar", "once_per_bar_close" and "none"
debug (bool) : Turns on/off debug label
Returns: A market order alert string with valid PC syntax based on supplied parameters
buy(licenseID, risk, sl, tp, betrigger, beoffset, spread, trailtrig, traildist, trailstep, atrtimeframe, atrperiod, atrmultiplier, atrshift, atrtrigger, symbol, accfilter, comment, secret, freq, debug)
Generates a market buy alert with relevant syntax commands. Required params: licenseID, risk.
Parameters:
licenseID (string) : Your PC license ID
risk (float) : Risk quantity (according to EA settings)
sl (float) : Stop loss distance in pips or price
tp (float) : Take profit distance in pips or price
betrigger (float) : Breakeven will be activated after the position gains this number of pips
beoffset (float) : Offset from entry price. This is the amount of pips you'd like to protect
spread (float) : Enter the position only if the spread is equal or less than the specified value in pips
trailtrig (float) : Trailing stop-loss will be activated after a trade gains this number of pips
traildist (float) : Distance of the trailing stop-loss from current price
trailstep (float) : Moves trailing stop-loss once price moves to favourable by a specified number of pips
atrtimeframe (int) : ATR Trailing Stop timeframe, only updates once per bar close. Options: 1, 5, 15, 30, 60, 240, 1440
atrperiod (int) : ATR averaging period
atrmultiplier (float) : Multiple of ATR to utilise in the new SL computation, default = 1
atrshift (int) : Relative shift of price information, 0 uses latest candle, 1 uses second last, etc. Default = 0
atrtrigger (int) : Activate the trigger of ATR Trailing after market moves favourably by a number of pips. Default = 0 (instant)
symbol (string) : The symbol to trigger this order on (defaults to current symbol)
accfilter (float) : Optional minimum account balance filter
comment (string) : Optional comment (maximum 20 characters)
secret (string) : Optional secret key (must be enabled in dashboard)
freq (string) : Alert frequency. Default = "all", options = "once_per_bar", "once_per_bar_close" and "none"
debug (bool) : Turns on/off debug label
Returns: A market order alert string with valid PC syntax based on supplied parameters
sell(licenseID, risk, sl, tp, betrigger, beoffset, spread, trailtrig, traildist, trailstep, atrtimeframe, atrperiod, atrmultiplier, atrshift, atrtrigger, symbol, accfilter, comment, secret, freq, debug)
Generates a market sell alert with relevant syntax commands. Required params: licenseID, risk.
Parameters:
licenseID (string) : Your PC license ID
risk (float) : Risk quantity (according to EA settings)
sl (float) : Stop loss distance in pips or price
tp (float) : Take profit distance in pips or price
betrigger (float) : Breakeven will be activated after the position gains this number of pips
beoffset (float) : Offset from entry price. This is the amount of pips you'd like to protect
spread (float) : Enter the position only if the spread is equal or less than the specified value in pips
trailtrig (float) : Trailing stop-loss will be activated after a trade gains this number of pips
traildist (float) : Distance of the trailing stop-loss from current price
trailstep (float) : Moves trailing stop-loss once price moves to favourable by a specified number of pips
atrtimeframe (int) : ATR Trailing Stop timeframe, only updates once per bar close. Options: 1, 5, 15, 30, 60, 240, 1440
atrperiod (int) : ATR averaging period
atrmultiplier (float) : Multiple of ATR to utilise in the new SL computation, default = 1
atrshift (int) : Relative shift of price information, 0 uses latest candle, 1 uses second last, etc. Default = 0
atrtrigger (int) : Activate the trigger of ATR Trailing after market moves favourably by a number of pips. Default = 0 (instant)
symbol (string) : The symbol to trigger this order on (defaults to current symbol)
accfilter (float) : Optional minimum account balance filter
comment (string) : Optional comment (maximum 20 characters)
secret (string) : Optional secret key (must be enabled in dashboard)
freq (string) : Alert frequency. Default = "all", options = "once_per_bar", "once_per_bar_close" and "none"
debug (bool) : Turns on/off debug label
Returns: A market order alert string with valid PC syntax based on supplied parameters
closeall(licenseID, comment, secret, freq, debug)
Closes all open trades at market regardless of symbol. Required params: licenseID.
Parameters:
licenseID (string) : Your PC license ID
comment (string) : Optional comment to include (max 20 characters)
secret (string) : Optional secret key (must be enabled in dashboard)
freq (string) : Alert frequency. Default = "all", options = "once_per_bar", "once_per_bar_close" and "none"
debug (bool) : Turns on/off debug label
Returns: The required alert syntax as a string
closealleaoff(licenseID, comment, secret, freq, debug)
Closes all open trades at market regardless of symbol, and turns the EA off. Required params: licenseID.
Parameters:
licenseID (string) : Your PC license ID
comment (string) : Optional comment to include (max 20 characters)
secret (string) : Optional secret key (must be enabled in dashboard)
freq (string) : Alert frequency. Default = "all", options = "once_per_bar", "once_per_bar_close" and "none"
debug (bool) : Turns on/off debug label
Returns: The required alert syntax as a string
closelong(licenseID, symbol, comment, secret, freq, debug)
Closes all long trades at market for the given symbol. Required params: licenseID.
Parameters:
licenseID (string) : Your PC license ID
symbol (string) : Symbol to act on (defaults to current symbol)
comment (string) : Optional comment to include (max 20 characters)
secret (string) : Optional secret key (must be enabled in dashboard)
freq (string) : Alert frequency. Default = "all", options = "once_per_bar", "once_per_bar_close" and "none"
debug (bool) : Turns on/off debug label
Returns: The required alert syntax as a string
closeshort(licenseID, symbol, comment, secret, freq, debug)
Closes all open short trades at market for the given symbol. Required params: licenseID.
Parameters:
licenseID (string) : Your PC license ID
symbol (string) : Symbol to act on (defaults to current symbol)
comment (string) : Optional comment to include (max 20 characters)
secret (string) : Optional secret key (must be enabled in dashboard)
freq (string) : Alert frequency. Default = "all", options = "once_per_bar", "once_per_bar_close" and "none"
debug (bool) : Turns on/off debug label
Returns: The required alert syntax as a string
closelongshort(licenseID, symbol, comment, secret, freq, debug)
Closes all open trades at market for the given symbol. Required params: licenseID.
Parameters:
licenseID (string) : Your PC license ID
symbol (string) : Symbol to act on (defaults to current symbol)
comment (string) : Optional comment to include (max 20 characters)
secret (string) : Optional secret key (must be enabled in dashboard)
freq (string) : Alert frequency. Default = "all", options = "once_per_bar", "once_per_bar_close" and "none"
debug (bool) : Turns on/off debug label
Returns: The required alert syntax as a string
closelongbuy(licenseID, risk, symbol, comment, secret, freq, debug)
Close all long positions and open a new long at market for the given symbol with given risk/contracts. Required params: licenseID.
Parameters:
licenseID (string) : Your PC license ID
risk (float) : Risk or contracts (according to EA settings)
symbol (string) : Symbol to act on (defaults to current symbol)
comment (string) : Optional comment to include (max 20 characters)
secret (string) : Optional secret key (must be enabled in dashboard)
freq (string) : Alert frequency. Default = "all", options = "once_per_bar", "once_per_bar_close" and "none"
debug (bool) : Turns on/off debug label
Returns: The required alert syntax as a string
closeshortsell(licenseID, risk, symbol, comment, secret, freq, debug)
Close all short positions and open a new short at market for the given symbol with given risk/contracts. Required params: licenseID, risk.
Parameters:
licenseID (string) : Your PC license ID
risk (float) : Risk or contracts (according to EA settings)
symbol (string) : Symbol to act on (defaults to current symbol)
comment (string) : Optional comment to include (max 20 characters)
secret (string) : Optional secret key (must be enabled in dashboard)
freq (string) : Alert frequency. Default = "all", options = "once_per_bar", "once_per_bar_close" and "none"
debug (bool) : Turns on/off debug label
Returns: The required alert syntax as a string
newsltplong(licenseID, sl, tp, symbol, accfilter, comment, secret, freq, debug)
Updates the stop loss and/or take profit of any open long trades on the given symbol with the given values. Required params: licenseID, sl and/or tp.
Parameters:
licenseID (string) : Your PC license ID
sl (float) : Stop loss pips or price (according to EA settings)
tp (float) : Take profit pips or price (according to EA settings)
symbol (string) : Symbol to act on (defaults to current symbol)
accfilter (float) : Optional minimum account balance filter
comment (string) : Optional comment to include (max 20 characters)
secret (string) : Optional secret key (must be enabled in dashboard)
freq (string) : Alert frequency. Default = "all", options = "once_per_bar", "once_per_bar_close" and "none"
debug (bool) : Turns on/off debug label
Returns: The required alert syntax as a string
newsltpshort(licenseID, sl, tp, symbol, accfilter, comment, secret, freq, debug)
Updates the stop loss and/or take profit of any open short trades on the given symbol with the given values. Required params: licenseID, sl and/or tp.
Parameters:
licenseID (string) : Your PC license ID
sl (float) : Stop loss pips or price (according to EA settings)
tp (float) : Take profit pips or price (according to EA settings)
symbol (string) : Symbol to act on (defaults to current symbol)
accfilter (float) : Optional minimum account balance filter
comment (string) : Optional comment to include (max 20 characters)
secret (string) : Optional secret key (must be enabled in dashboard)
freq (string) : Alert frequency. Default = "all", options = "once_per_bar", "once_per_bar_close" and "none"
debug (bool) : Turns on/off debug label
Returns: The required alert syntax as a string
closelongpct(licenseID, symbol, comment, secret, freq, debug)
Close a percentage of open long positions (according to EA settings). Required params: licenseID.
Parameters:
licenseID (string) : Your PC license ID
symbol (string) : Symbol to act on (defaults to current symbol)
comment (string) : Optional comment to include (max 20 characters)
secret (string) : Optional secret key (must be enabled in dashboard)
freq (string) : Alert frequency. Default = "all", options = "once_per_bar", "once_per_bar_close" and "none"
debug (bool) : Turns on/off debug label
Returns: The required alert syntax as a string
closeshortpct(licenseID, symbol, comment, secret, freq, debug)
Close a percentage of open short positions (according to EA settings). Required params: licenseID.
Parameters:
licenseID (string) : Your PC license ID
symbol (string) : Symbol to act on (defaults to current symbol)
comment (string) : Optional comment to include (max 20 characters)
secret (string) : Optional secret key (must be enabled in dashboard)
freq (string) : Alert frequency. Default = "all", options = "once_per_bar", "once_per_bar_close" and "none"
debug (bool) : Turns on/off debug label
Returns: The required alert syntax as a string
closelongvol(licenseID, risk, symbol, comment, secret, freq, debug)
Close all open long contracts on the current symbol until the given risk value is remaining. Required params: licenseID, risk.
Parameters:
licenseID (string) : Your PC license ID
risk (float) : The quantity to leave remaining
symbol (string) : Symbol to act on (defaults to current symbol)
comment (string) : Optional comment to include (max 20 characters)
secret (string) : Optional secret key (must be enabled in dashboard)
freq (string) : Alert frequency. Default = "all", options = "once_per_bar", "once_per_bar_close" and "none"
debug (bool) : Turns on/off debug label
Returns: The required alert syntax as a string
closeshortvol(licenseID, risk, symbol, comment, secret, freq, debug)
Close all open short contracts on the current symbol until the given risk value is remaining. Required params: licenseID, risk.
Parameters:
licenseID (string) : Your PC license ID
risk (float) : The quantity to leave remaining
symbol (string) : Symbol to act on (defaults to current symbol)
comment (string) : Optional comment to include (max 20 characters)
secret (string) : Optional secret key (must be enabled in dashboard)
freq (string) : Alert frequency. Default = "all", options = "once_per_bar", "once_per_bar_close" and "none"
debug (bool) : Turns on/off debug label
Returns: The required alert syntax as a string
limit_order(licenseID, buy, price, risk, sl, tp, betrigger, beoffset, spread, trailtrig, traildist, trailstep, atrtimeframe, atrperiod, atrmultiplier, atrshift, atrtrigger, symbol, accfilter, comment, secret, freq, debug)
Generates a limit order alert with relevant syntax commands. Required params: licenseID, buy, price, risk.
Parameters:
licenseID (string) : Your PC license ID
buy (bool) : true=buy/long, false=sell/short
price (float) : Price or pips to set limit order (according to EA settings)
risk (float) : Risk quantity (according to EA settings)
sl (float) : Stop loss distance in pips or price
tp (float) : Take profit distance in pips or price
betrigger (float) : Breakeven will be activated after the position gains this number of pips
beoffset (float) : Offset from entry price. This is the amount of pips you'd like to protect
spread (float) : Enter the position only if the spread is equal or less than the specified value in pips
trailtrig (float) : Trailing stop-loss will be activated after a trade gains this number of pips
traildist (float) : Distance of the trailing stop-loss from current price
trailstep (float) : Moves trailing stop-loss once price moves to favourable by a specified number of pips
atrtimeframe (int) : ATR Trailing Stop timeframe, only updates once per bar close. Options: 1, 5, 15, 30, 60, 240, 1440
atrperiod (int) : ATR averaging period
atrmultiplier (float) : Multiple of ATR to utilise in the new SL computation, default = 1
atrshift (int) : Relative shift of price information, 0 uses latest candle, 1 uses second last, etc. Default = 0
atrtrigger (int) : Activate the trigger of ATR Trailing after market moves favourably by a number of pips. Default = 0 (instant)
symbol (string) : The symbol to trigger this order on (defaults to current symbol)
accfilter (float) : Optional minimum account balance filter
comment (string) : Optional comment (maximum 20 characters)
secret (string) : Optional secret key (must be enabled in dashboard)
freq (string) : Alert frequency. Default = "all", options = "once_per_bar", "once_per_bar_close" and "none"
debug (bool) : Turns on/off debug label
Returns: A limit order alert string with valid PC syntax based on supplied parameters
buylimit(licenseID, price, risk, sl, tp, betrigger, beoffset, spread, trailtrig, traildist, trailstep, atrtimeframe, atrperiod, atrmultiplier, atrshift, atrtrigger, symbol, accfilter, comment, secret, freq, debug)
Generates a buylimit order alert with relevant syntax commands. Required params: licenseID, price, risk.
Parameters:
licenseID (string) : Your PC license ID
price (float) : Price or pips to set limit order (according to EA settings)
risk (float) : Risk quantity (according to EA settings)
sl (float) : Stop loss distance in pips or price
tp (float) : Take profit distance in pips or price
betrigger (float) : Breakeven will be activated after the position gains this number of pips
beoffset (float) : Offset from entry price. This is the amount of pips you'd like to protect
spread (float) : Enter the position only if the spread is equal or less than the specified value in pips
trailtrig (float) : Trailing stop-loss will be activated after a trade gains this number of pips
traildist (float) : Distance of the trailing stop-loss from current price
trailstep (float) : Moves trailing stop-loss once price moves to favourable by a specified number of pips
atrtimeframe (int) : ATR Trailing Stop timeframe, only updates once per bar close. Options: 1, 5, 15, 30, 60, 240, 1440
atrperiod (int) : ATR averaging period
atrmultiplier (float) : Multiple of ATR to utilise in the new SL computation, default = 1
atrshift (int) : Relative shift of price information, 0 uses latest candle, 1 uses second last, etc. Default = 0
atrtrigger (int) : Activate the trigger of ATR Trailing after market moves favourably by a number of pips. Default = 0 (instant)
symbol (string) : The symbol to trigger this order on (defaults to current symbol)
accfilter (float) : Optional minimum account balance filter
comment (string) : Optional comment (maximum 20 characters)
secret (string) : Optional secret key (must be enabled in dashboard)
freq (string) : Alert frequency. Default = "all", options = "once_per_bar", "once_per_bar_close" and "none"
debug (bool) : Turns on/off debug label
Returns: A limit order alert string with valid PC syntax based on supplied parameters
selllimit(licenseID, price, risk, sl, tp, betrigger, beoffset, spread, trailtrig, traildist, trailstep, atrtimeframe, atrperiod, atrmultiplier, atrshift, atrtrigger, symbol, accfilter, comment, secret, freq, debug)
Generates a selllimit order alert with relevant syntax commands. Required params: licenseID, price, risk.
Parameters:
licenseID (string) : Your PC license ID
price (float) : Price or pips to set limit order (according to EA settings)
risk (float) : Risk quantity (according to EA settings)
sl (float) : Stop loss distance in pips or price
tp (float) : Take profit distance in pips or price
betrigger (float) : Breakeven will be activated after the position gains this number of pips
beoffset (float) : Offset from entry price. This is the amount of pips you'd like to protect
spread (float) : Enter the position only if the spread is equal or less than the specified value in pips
trailtrig (float) : Trailing stop-loss will be activated after a trade gains this number of pips
traildist (float) : Distance of the trailing stop-loss from current price
trailstep (float) : Moves trailing stop-loss once price moves to favourable by a specified number of pips
atrtimeframe (int) : ATR Trailing Stop timeframe, only updates once per bar close. Options: 1, 5, 15, 30, 60, 240, 1440
atrperiod (int) : ATR averaging period
atrmultiplier (float) : Multiple of ATR to utilise in the new SL computation, default = 1
atrshift (int) : Relative shift of price information, 0 uses latest candle, 1 uses second last, etc. Default = 0
atrtrigger (int) : Activate the trigger of ATR Trailing after market moves favourably by a number of pips. Default = 0 (instant)
symbol (string) : The symbol to trigger this order on (defaults to current symbol)
accfilter (float) : Optional minimum account balance filter
comment (string) : Optional comment (maximum 20 characters)
secret (string) : Optional secret key (must be enabled in dashboard)
freq (string) : Alert frequency. Default = "all", options = "once_per_bar", "once_per_bar_close" and "none"
debug (bool) : Turns on/off debug label
Returns: A limit order alert string with valid PC syntax based on supplied parameters
stop_order(licenseID, buy, price, risk, sl, tp, betrigger, beoffset, spread, trailtrig, traildist, trailstep, atrtimeframe, atrperiod, atrmultiplier, atrshift, atrtrigger, symbol, accfilter, comment, secret, freq, debug)
Generates a stop order alert with relevant syntax commands. Required params: licenseID, buy, price, risk.
Parameters:
licenseID (string) : Your PC license ID
buy (bool) : true=buy/long, false=sell/short
price (float) : Price or pips to set limit order (according to EA settings)
risk (float) : Risk quantity (according to EA settings)
sl (float) : Stop loss distance in pips or price
tp (float) : Take profit distance in pips or price
betrigger (float) : Breakeven will be activated after the position gains this number of pips
beoffset (float) : Offset from entry price. This is the amount of pips you'd like to protect
spread (float) : Enter the position only if the spread is equal or less than the specified value in pips
trailtrig (float) : Trailing stop-loss will be activated after a trade gains this number of pips
traildist (float) : Distance of the trailing stop-loss from current price
trailstep (float) : Moves trailing stop-loss once price moves to favourable by a specified number of pips
atrtimeframe (int) : ATR Trailing Stop timeframe, only updates once per bar close. Options: 1, 5, 15, 30, 60, 240, 1440
atrperiod (int) : ATR averaging period
atrmultiplier (float) : Multiple of ATR to utilise in the new SL computation, default = 1
atrshift (int) : Relative shift of price information, 0 uses latest candle, 1 uses second last, etc. Default = 0
atrtrigger (int) : Activate the trigger of ATR Trailing after market moves favourably by a number of pips. Default = 0 (instant)
symbol (string) : The symbol to trigger this order on (defaults to current symbol)
accfilter (float) : Optional minimum account balance filter
comment (string) : Optional comment (maximum 20 characters)
secret (string) : Optional secret key (must be enabled in dashboard)
freq (string) : Alert frequency. Default = "all", options = "once_per_bar", "once_per_bar_close" and "none"
debug (bool) : Turns on/off debug label
Returns: A stop order alert string with valid PC syntax based on supplied parameters
buystop(licenseID, price, risk, sl, tp, betrigger, beoffset, spread, trailtrig, traildist, trailstep, atrtimeframe, atrperiod, atrmultiplier, atrshift, atrtrigger, symbol, accfilter, comment, secret, freq, debug)
Generates a buystop order alert with relevant syntax commands. Required params: licenseID, price, risk.
Parameters:
licenseID (string) : Your PC license ID
price (float) : Price or pips to set limit order (according to EA settings)
risk (float) : Risk quantity (according to EA settings)
sl (float) : Stop loss distance in pips or price
tp (float) : Take profit distance in pips or price
betrigger (float) : Breakeven will be activated after the position gains this number of pips
beoffset (float) : Offset from entry price. This is the amount of pips you'd like to protect
spread (float) : Enter the position only if the spread is equal or less than the specified value in pips
trailtrig (float) : Trailing stop-loss will be activated after a trade gains this number of pips
traildist (float) : Distance of the trailing stop-loss from current price
trailstep (float) : Moves trailing stop-loss once price moves to favourable by a specified number of pips
atrtimeframe (int) : ATR Trailing Stop timeframe, only updates once per bar close. Options: 1, 5, 15, 30, 60, 240, 1440
atrperiod (int) : ATR averaging period
atrmultiplier (float) : Multiple of ATR to utilise in the new SL computation, default = 1
atrshift (int) : Relative shift of price information, 0 uses latest candle, 1 uses second last, etc. Default = 0
atrtrigger (int) : Activate the trigger of ATR Trailing after market moves favourably by a number of pips. Default = 0 (instant)
symbol (string) : The symbol to trigger this order on (defaults to current symbol)
accfilter (float) : Optional minimum account balance filter
comment (string) : Optional comment (maximum 20 characters)
secret (string) : Optional secret key (must be enabled in dashboard)
freq (string) : Alert frequency. Default = "all", options = "once_per_bar", "once_per_bar_close" and "none"
debug (bool) : Turns on/off debug label
Returns: A stop order alert string with valid PC syntax based on supplied parameters
sellstop(licenseID, price, risk, sl, tp, betrigger, beoffset, spread, trailtrig, traildist, trailstep, atrtimeframe, atrperiod, atrmultiplier, atrshift, atrtrigger, symbol, accfilter, comment, secret, freq, debug)
Generates a sellstop order alert with relevant syntax commands. Required params: licenseID, price, risk.
Parameters:
licenseID (string) : Your PC license ID
price (float) : Price or pips to set limit order (according to EA settings)
risk (float) : Risk quantity (according to EA settings)
sl (float) : Stop loss distance in pips or price
tp (float) : Take profit distance in pips or price
betrigger (float) : Breakeven will be activated after the position gains this number of pips
beoffset (float) : Offset from entry price. This is the amount of pips you'd like to protect
spread (float) : Enter the position only if the spread is equal or less than the specified value in pips
trailtrig (float) : Trailing stop-loss will be activated after a trade gains this number of pips
traildist (float) : Distance of the trailing stop-loss from current price
trailstep (float) : Moves trailing stop-loss once price moves to favourable by a specified number of pips
atrtimeframe (int) : ATR Trailing Stop timeframe, only updates once per bar close. Options: 1, 5, 15, 30, 60, 240, 1440
atrperiod (int) : ATR averaging period
atrmultiplier (float) : Multiple of ATR to utilise in the new SL computation, default = 1
atrshift (int) : Relative shift of price information, 0 uses latest candle, 1 uses second last, etc. Default = 0
atrtrigger (int) : Activate the trigger of ATR Trailing after market moves favourably by a number of pips. Default = 0 (instant)
symbol (string) : The symbol to trigger this order on (defaults to current symbol)
accfilter (float) : Optional minimum account balance filter
comment (string) : Optional comment (maximum 20 characters)
secret (string) : Optional secret key (must be enabled in dashboard)
freq (string) : Alert frequency. Default = "all", options = "once_per_bar", "once_per_bar_close" and "none"
debug (bool) : Turns on/off debug label
Returns: A stop order alert string with valid PC syntax based on supplied parameters
cancel_neworder(licenseID, order, price, risk, sl, tp, betrigger, beoffset, spread, trailtrig, traildist, trailstep, atrtimeframe, atrperiod, atrmultiplier, atrshift, atrtrigger, symbol, accfilter, comment, secret, freq, debug)
Cancel + place new order template function.
Parameters:
licenseID (string) : Your PC license ID
order (string) : Cancel order type
price (float) : Price or pips to set limit order (according to EA settings)
risk (float) : Risk quantity (according to EA settings)
sl (float) : Stop loss distance in pips or price
tp (float) : Take profit distance in pips or price
betrigger (float) : Breakeven will be activated after the position gains this number of pips
beoffset (float) : Offset from entry price. This is the amount of pips you'd like to protect
spread (float) : Enter the position only if the spread is equal or less than the specified value in pips
trailtrig (float) : Trailing stop-loss will be activated after a trade gains this number of pips
traildist (float) : Distance of the trailing stop-loss from current price
trailstep (float) : Moves trailing stop-loss once price moves to favourable by a specified number of pips
atrtimeframe (int) : ATR Trailing Stop timeframe, only updates once per bar close. Options: 1, 5, 15, 30, 60, 240, 1440
atrperiod (int) : ATR averaging period
atrmultiplier (float) : Multiple of ATR to utilise in the new SL computation, default = 1
atrshift (int) : Relative shift of price information, 0 uses latest candle, 1 uses second last, etc. Default = 0
atrtrigger (int) : Activate the trigger of ATR Trailing after market moves favourably by a number of pips. Default = 0 (instant)
symbol (string) : The symbol to trigger this order on (defaults to current symbol)
accfilter (float) : Optional minimum account balance filter
comment (string) : Optional comment (maximum 20 characters)
secret (string) : Optional secret key (must be enabled in dashboard)
freq (string) : Alert frequency. Default = "all", options = "once_per_bar", "once_per_bar_close" and "none"
debug (bool) : Turns on/off debug label
Returns: A stop order alert string with valid PC syntax based on supplied parameters
cancellongbuystop(licenseID, price, risk, sl, tp, betrigger, beoffset, spread, trailtrig, traildist, trailstep, atrtimeframe, atrperiod, atrmultiplier, atrshift, atrtrigger, symbol, accfilter, comment, secret, freq, debug)
Cancels all long orders with the specified symbol and places a new buystop order. Required params: licenseID, price, risk.
Parameters:
licenseID (string) : Your PC license ID
price (float) : Price or pips to set limit order (according to EA settings)
risk (float) : Risk quantity (according to EA settings)
sl (float) : Stop loss distance in pips or price
tp (float) : Take profit distance in pips or price
betrigger (float) : Breakeven will be activated after the position gains this number of pips
beoffset (float) : Offset from entry price. This is the amount of pips you'd like to protect
spread (float) : Enter the position only if the spread is equal or less than the specified value in pips
trailtrig (float) : Trailing stop-loss will be activated after a trade gains this number of pips
traildist (float) : Distance of the trailing stop-loss from current price
trailstep (float) : Moves trailing stop-loss once price moves to favourable by a specified number of pips
atrtimeframe (int) : ATR Trailing Stop timeframe, only updates once per bar close. Options: 1, 5, 15, 30, 60, 240, 1440
atrperiod (int) : ATR averaging period
atrmultiplier (float) : Multiple of ATR to utilise in the new SL computation, default = 1
atrshift (int) : Relative shift of price information, 0 uses latest candle, 1 uses second last, etc. Default = 0
atrtrigger (int) : Activate the trigger of ATR Trailing after market moves favourably by a number of pips. Default = 0 (instant)
symbol (string) : The symbol to trigger this order on (defaults to current symbol)
accfilter (float) : Optional minimum account balance filter
comment (string) : Optional comment (maximum 20 characters)
secret (string) : Optional secret key (must be enabled in dashboard)
freq (string) : Alert frequency. Default = "all", options = "once_per_bar", "once_per_bar_close" and "none"
debug (bool) : Turns on/off debug label
Returns: A stop order alert string with valid PC syntax based on supplied parameters
cancellongbuylimit(licenseID, price, risk, sl, tp, betrigger, beoffset, spread, trailtrig, traildist, trailstep, atrtimeframe, atrperiod, atrmultiplier, atrshift, atrtrigger, symbol, accfilter, comment, secret, freq, debug)
Cancels all long orders with the specified symbol and places a new buylimit order. Required params: licenseID, price, risk.
Parameters:
licenseID (string) : Your PC license ID
price (float) : Price or pips to set limit order (according to EA settings)
risk (float) : Risk quantity (according to EA settings)
sl (float) : Stop loss distance in pips or price
tp (float) : Take profit distance in pips or price
betrigger (float) : Breakeven will be activated after the position gains this number of pips
beoffset (float) : Offset from entry price. This is the amount of pips you'd like to protect
spread (float) : Enter the position only if the spread is equal or less than the specified value in pips
trailtrig (float) : Trailing stop-loss will be activated after a trade gains this number of pips
traildist (float) : Distance of the trailing stop-loss from current price
trailstep (float) : Moves trailing stop-loss once price moves to favourable by a specified number of pips
atrtimeframe (int) : ATR Trailing Stop timeframe, only updates once per bar close. Options: 1, 5, 15, 30, 60, 240, 1440
atrperiod (int) : ATR averaging period
atrmultiplier (float) : Multiple of ATR to utilise in the new SL computation, default = 1
atrshift (int) : Relative shift of price information, 0 uses latest candle, 1 uses second last, etc. Default = 0
atrtrigger (int) : Activate the trigger of ATR Trailing after market moves favourably by a number of pips. Default = 0 (instant)
symbol (string) : The symbol to trigger this order on (defaults to current symbol)
accfilter (float) : Optional minimum account balance filter
comment (string) : Optional comment (maximum 20 characters)
secret (string) : Optional secret key (must be enabled in dashboard)
freq (string) : Alert frequency. Default = "all", options = "once_per_bar", "once_per_bar_close" and "none"
debug (bool) : Turns on/off debug label
Returns: A stop order alert string with valid PC syntax based on supplied parameters
cancelshortsellstop(licenseID, price, risk, sl, tp, betrigger, beoffset, spread, trailtrig, traildist, trailstep, atrtimeframe, atrperiod, atrmultiplier, atrshift, atrtrigger, symbol, accfilter, comment, secret, freq, debug)
Cancels all short orders with the specified symbol and places a sellstop order. Required params: licenseID, price, risk.
Parameters:
licenseID (string) : Your PC license ID
price (float) : Price or pips to set limit order (according to EA settings)
risk (float) : Risk quantity (according to EA settings)
sl (float) : Stop loss distance in pips or price
tp (float) : Take profit distance in pips or price
betrigger (float) : Breakeven will be activated after the position gains this number of pips
beoffset (float) : Offset from entry price. This is the amount of pips you'd like to protect
spread (float) : Enter the position only if the spread is equal or less than the specified value in pips
trailtrig (float) : Trailing stop-loss will be activated after a trade gains this number of pips
traildist (float) : Distance of the trailing stop-loss from current price
trailstep (float) : Moves trailing stop-loss once price moves to favourable by a specified number of pips
atrtimeframe (int) : ATR Trailing Stop timeframe, only updates once per bar close. Options: 1, 5, 15, 30, 60, 240, 1440
atrperiod (int) : ATR averaging period
atrmultiplier (float) : Multiple of ATR to utilise in the new SL computation, default = 1
atrshift (int) : Relative shift of price information, 0 uses latest candle, 1 uses second last, etc. Default = 0
atrtrigger (int) : Activate the trigger of ATR Trailing after market moves favourably by a number of pips. Default = 0 (instant)
symbol (string) : The symbol to trigger this order on (defaults to current symbol)
accfilter (float) : Optional minimum account balance filter
comment (string) : Optional comment (maximum 20 characters)
secret (string) : Optional secret key (must be enabled in dashboard)
freq (string) : Alert frequency. Default = "all", options = "once_per_bar", "once_per_bar_close" and "none"
debug (bool) : Turns on/off debug label
Returns: A stop order alert string with valid PC syntax based on supplied parameters
cancelshortselllimit(licenseID, price, risk, sl, tp, betrigger, beoffset, spread, trailtrig, traildist, trailstep, atrtimeframe, atrperiod, atrmultiplier, atrshift, atrtrigger, symbol, accfilter, comment, secret, freq, debug)
Cancels all short orders with the specified symbol and places a selllimit order. Required params: licenseID, price, risk.
Parameters:
licenseID (string) : Your PC license ID
price (float) : Price or pips to set limit order (according to EA settings)
risk (float) : Risk quantity (according to EA settings)
sl (float) : Stop loss distance in pips or price
tp (float) : Take profit distance in pips or price
betrigger (float) : Breakeven will be activated after the position gains this number of pips
beoffset (float) : Offset from entry price. This is the amount of pips you'd like to protect
spread (float) : Enter the position only if the spread is equal or less than the specified value in pips
trailtrig (float) : Trailing stop-loss will be activated after a trade gains this number of pips
traildist (float) : Distance of the trailing stop-loss from current price
trailstep (float) : Moves trailing stop-loss once price moves to favourable by a specified number of pips
atrtimeframe (int) : ATR Trailing Stop timeframe, only updates once per bar close. Options: 1, 5, 15, 30, 60, 240, 1440
atrperiod (int) : ATR averaging period
atrmultiplier (float) : Multiple of ATR to utilise in the new SL computation, default = 1
atrshift (int) : Relative shift of price information, 0 uses latest candle, 1 uses second last, etc. Default = 0
atrtrigger (int) : Activate the trigger of ATR Trailing after market moves favourably by a number of pips. Default = 0 (instant)
symbol (string) : The symbol to trigger this order on (defaults to current symbol)
accfilter (float) : Optional minimum account balance filter
comment (string) : Optional comment (maximum 20 characters)
secret (string) : Optional secret key (must be enabled in dashboard)
freq (string) : Alert frequency. Default = "all", options = "once_per_bar", "once_per_bar_close" and "none"
debug (bool) : Turns on/off debug label
Returns: A stop order alert string with valid PC syntax based on supplied parameters
cancellong(licenseID, symbol, accfilter, comment, secret, freq, debug)
Cancels all pending long orders with the specified symbol. Required params: licenseID.
Parameters:
licenseID (string) : Your PC license ID
symbol (string) : Symbol to act on (defaults to current symbol)
accfilter (float) : Optional minimum account balance filter
comment (string) : Optional comment to include (max 20 characters)
secret (string) : Optional secret key (must be enabled in dashboard)
freq (string) : Alert frequency. Default = "all", options = "once_per_bar", "once_per_bar_close" and "none"
debug (bool) : Turns on/off debug label
Returns: A cancel long alert command
cancelshort(licenseID, symbol, accfilter, comment, secret, freq, debug)
Cancels all pending short orders with the specified symbol. Required params: licenseID.
Parameters:
licenseID (string) : Your PC license ID
symbol (string) : Symbol to act on (defaults to current symbol)
accfilter (float) : Optional minimum account balance filter
comment (string) : Optional comment to include (max 20 characters)
secret (string) : Optional secret key (must be enabled in dashboard)
freq (string) : Alert frequency. Default = "all", options = "once_per_bar", "once_per_bar_close" and "none"
debug (bool) : Turns on/off debug label
Returns: A cancel short alert command
newsltpbuystop(licenseID, sl, tp, symbol, accfilter, comment, secret, freq, debug)
Updates the stop loss and/or take profit of any pending buy stop orders on the given symbol. Required params: licenseID, sl and/or tp.
Parameters:
licenseID (string) : Your PC license ID
sl (float) : Stop loss pips or price (according to EA settings)
tp (float) : Take profit pips or price (according to EA settings)
symbol (string) : Symbol to act on (defaults to current symbol)
accfilter (float) : Optional minimum account balance filter
comment (string) : Optional comment to include (max 20 characters)
secret (string) : Optional secret key (must be enabled in dashboard)
freq (string) : Alert frequency. Default = "all", options = "once_per_bar", "once_per_bar_close" and "none"
debug (bool) : Turns on/off debug label
Returns: The required alert syntax as a string
newsltpbuylimit(licenseID, sl, tp, symbol, accfilter, comment, secret, freq, debug)
Updates the stop loss and/or take profit of any pending buy limit orders on the given symbol. Required params: licenseID, sl and/or tp.
Parameters:
licenseID (string) : Your PC license ID
sl (float) : Stop loss pips or price (according to EA settings)
tp (float) : Take profit pips or price (according to EA settings)
symbol (string) : Symbol to act on (defaults to current symbol)
accfilter (float) : Optional minimum account balance filter
comment (string) : Optional comment to include (max 20 characters)
secret (string) : Optional secret key (must be enabled in dashboard)
freq (string) : Alert frequency. Default = "all", options = "once_per_bar", "once_per_bar_close" and "none"
debug (bool) : Turns on/off debug label
Returns: The required alert syntax as a string
newsltpsellstop(licenseID, sl, tp, symbol, accfilter, comment, secret, freq, debug)
Updates the stop loss and/or take profit of any pending sell stop orders on the given symbol. Required params: licenseID, sl and/or tp.
Parameters:
licenseID (string) : Your PC license ID
sl (float) : Stop loss pips or price (according to EA settings)
tp (float) : Take profit pips or price (according to EA settings)
symbol (string) : Symbol to act on (defaults to current symbol)
accfilter (float) : Optional minimum account balance filter
comment (string) : Optional comment to include (max 20 characters)
secret (string) : Optional secret key (must be enabled in dashboard)
freq (string) : Alert frequency. Default = "all", options = "once_per_bar", "once_per_bar_close" and "none"
debug (bool) : Turns on/off debug label
Returns: The required alert syntax as a string
newsltpselllimit(licenseID, sl, tp, symbol, accfilter, comment, secret, freq, debug)
Updates the stop loss and/or take profit of any pending sell limit orders on the given symbol. Required params: licenseID, sl and/or tp.
Parameters:
licenseID (string) : Your PC license ID
sl (float) : Stop loss pips or price (according to EA settings)
tp (float) : Take profit pips or price (according to EA settings)
symbol (string) : Symbol to act on (defaults to current symbol)
accfilter (float) : Optional minimum account balance filter
comment (string) : Optional comment to include (max 20 characters)
secret (string) : Optional secret key (must be enabled in dashboard)
freq (string) : Alert frequency. Default = "all", options = "once_per_bar", "once_per_bar_close" and "none"
debug (bool) : Turns on/off debug label
Returns: The required alert syntax as a string
eaoff(licenseID, secret, freq, debug)
Turns the EA off. Required params: licenseID.
Parameters:
licenseID (string) : Your PC license ID
secret (string) : Optional secret key (must be enabled in dashboard)
freq (string) : Alert frequency. Default = "all", options = "once_per_bar", "once_per_bar_close" and "none"
debug (bool) : Turns on/off debug label
Returns: The required alert syntax as a string
eaon(licenseID, secret, freq, debug)
Turns the EA on. Required params: licenseID.
Parameters:
licenseID (string) : Your PC license ID
secret (string) : Optional secret key (must be enabled in dashboard)
freq (string) : Alert frequency. Default = "all", options = "once_per_bar", "once_per_bar_close" and "none"
debug (bool) : Turns on/off debug label
Returns: The required alert syntax as a string

AutoPilot | FractalystWhat’s the purpose of this indicator?
The AutoPilot indicator automates the management of your active trades by:
Breaks Even: Moves the stop-loss to the entry price once the trade reaches a 1:1 risk-reward ratio.
Closes Trades: Automatically exits trades when trailing stop-losses are triggered.
This automation is facilitated through PineConnector and TradingView webhook integration, allowing traders to manage multiple positions across various markets effortlessly without any manual intervention.
----
How does this indicator trail stop-loss using market structure?
The AutoPilot indicator utilizes an advanced market structure trailing stop-loss mechanism to manage trades based on market dynamics and probabilities.
Here's how it works:
Market Structure Identification: The indicator first identifies key market structures such as higher highs, lower lows.
These structures are pivotal points where the market has shown a change in direction or momentum.
Probability-Based Trailing: Once a trade is active, the stop-loss isn't just set at a fixed distance or percentage but is dynamically adjusted based on the probability of the market structure holding or breaking.
This involves:
Trend Continuation Probability: If the market structure suggests a strong trend continuation (e.g., a series of higher highs in an uptrend), the stop-loss might trail closer to the price, but with a buffer calculated by the probability of the trend continuing versus reversing.
Reversal Probability: Conversely, if there's a high probability of a trend reversal based on recent market structures (like a significant lower high in an uptrend), the stop-loss might be adjusted to a point where the market structure would need to break to confirm the reversal, thus protecting potential profits or minimizing losses.
Dynamic Adjustment: The trailing stop-loss adjusts in real-time as new market structures form. For instance, if a new higher high is formed in an uptrend, the stop-loss might move up but not necessarily to the exact previous swing low. Instead, it's placed at a level where the probability of the next swing low not breaking this level is high, based on historical price action.
Risk Management: By using market structure and probabilities, the indicator aims to balance between giving the trade room to breathe (allowing for normal market fluctuations) and tightening the stop-loss when the market behavior suggests a potential trend change or continuation with high confidence.
This approach ensures that the stop-loss isn't just a static or simple trailing mechanism but a sophisticated tool that adapts to the evolving market conditions, aiming to maximize profit while minimizing the risk of being stopped out prematurely due to market noise.
----
How are the probabilities calculated? What are the underlying calculations?
The probability is designed to enhance trade management by using buyside liquidity and probability analysis to filter out low/high probability conditions.
This helps in identifying optimal trailing points where the likelihood of a price continuation is higher.
Calculations:
1. Understanding Swing highs and Swing Lows
Swing High: A Swing High is formed when there is a high with 2 lower highs to the left and right.
Swing Low: A Swing Low is formed when there is a low with 2 higher lows to the left and right.
2. Understanding the purpose and the underlying calculations behind Buyside, Sellside and Equilibrium levels.
3. Understanding probability calculations
1. Upon the formation of a new range, the script waits for the price to reach and tap into equilibrium or the 50% level. Status: "⏸" - Inactive
2. Once equilibrium is tapped into, the equilibrium status becomes activated and it waits for either liquidity side to be hit. Status: "▶" - Active
3. If the buyside liquidity is hit, the script adds to the count of successful buyside liquidity occurrences. Similarly, if the sellside is tapped, it records successful sellside liquidity occurrences.
5. Finally, the number of successful occurrences for each side is divided by the overall count individually to calculate the range probabilities.
Note: The calculations are performed independently for each directional range. A range is considered bearish if the previous breakout was through a sellside liquidity. Conversely, a range is considered bullish if the most recent breakout was through a buyside liquidity.
----
What does the automation table display?
The automation table in the AutoPilot indicator provides a summary of user-defined settings crucial for automated trade management through PineConnector and TradingView integration. It displays:
PineConnector License ID: This ensures that the indicator is linked to your specific PineConnector account, allowing for personalized and secure automation of your trades.
Order Type (Buy/Sell): Indicates whether the automation is set for buying or selling, which is essential for correctly executing your trading strategy.
Chosen Symbol: Specifies the trading pair or symbol in your broker's platform where the trade management commands (like closing orders) will be executed. This ensures that the automation targets the correct market or asset.
Risk Per Trade: Shows the percentage or amount of your capital you're willing to risk on each trade, helping you maintain consistent risk management across different trades.
Comment: A field for you to input notes or identifiers, particularly useful when trading across multiple markets or instruments. This helps in tracking and managing trades across different assets or strategies.
Comment: A field for you to input identifiers, particularly useful when trading across multiple timeframes or different enries.
Allowing users to manage specific comments for each previously taken entry, facilitating precise management of multiple trades with unique identifiers.
This table serves as a quick reference for your current settings, ensuring you're always aware of how your trades are being managed automatically before any adjustments are made or alerts are triggered.
----
How to use the indicator?
To use the AutoPilot indicator:
Purchase a License ID: Acquire a license ID from PineConnector.
Setup PineConnector EA: Install and configure the PineConnector Expert Advisor on your MetaTrader platform.
Input Settings: Enter your PineConnector license ID, choose the order type, set your risk per trade, add the order comment, and select the trading symbol in the indicator's settings.
Create Alert: Right-click on the automation table, and set up an alert with the provided webhook to connect with PineConnector.
Automatic Management: Once set, your active trades will be automatically managed according to the alert conditions you've set.
This setup ensures your trades are managed seamlessly without constant manual intervention.
----
What makes this indicator original?
Integration with PineConnector: The AutoPilot indicator's originality lies in its integration with PineConnector, which allows for real-time trade management directly from TradingView to your MetaTrader platform. This setup is unique as it combines the analytical capabilities of TradingView with the execution capabilities of MetaTrader through a custom indicator, providing a seamless bridge between analysis and action.
Market Structure-Based Trailing Stop-Loss: Unlike many indicators that might use fixed percentages or ATR (Average True Range) for stop-loss adjustments, the AutoPilot indicator uses market structure (higher highs, lower lows) to dynamically adjust the stop-loss.
Probability-Based Adjustments: The indicator doesn't just trail stop-losses based on price but incorporates the probability of market structure holding or breaking. This probability-based trailing mechanism is innovative, aiming to balance between giving trades room to breathe and tightening when market behavior suggests a potential reversal or continuation.
Customizable Automation Table: The automation table within the indicator allows for detailed customization, including setting specific comments for trades. This feature, while perhaps not unique in concept, is original in its implementation within trading indicators, providing users with a high degree of control and personalization over trade management.
Real-Time Trade Management Alerts: The ability to set up alerts directly from the indicator to manage trades in real-time via webhooks to PineConnector adds a layer of automation that's not commonly found in standard trading indicators. This real-time connection for trade management enhances its originality by reducing the lag between analysis and trade execution.
User-Centric Design: The design of the AutoPilot indicator focuses heavily on user interaction, allowing for inputs like risk per trade, specific order types, and comments. This user-centric approach, where the indicator adapts to the trader's strategy rather than the trader adapting to the tool, sets it apart.
External Integration for Enhanced Functionality: By leveraging external services like PineConnector for execution, the indicator extends its functionality beyond what's typically possible within TradingView alone, making it original in its ecosystem integration for trading purposes.
Practical Implication: This means if you're in a trade and the market structure suggests the trend is continuing (e.g., making higher highs in an uptrend), your stop-loss might trail closer to the price but not too close to avoid being stopped out by normal fluctuations. If the structure breaks (e.g., a lower high in an uptrend), the stop-loss could adjust more aggressively to protect profits or minimize losses, anticipating a potential trend change.
This combination of features creates an original tool that not only analyzes market conditions but actively manages trades based on sophisticated market structure analysis.
----
User-input settings and customizations
----
Terms and Conditions | Disclaimer
Our charting tools are provided for informational and educational purposes only and should not be construed as financial, investment, or trading advice. They are not intended to forecast market movements or offer specific recommendations. Users should understand that past performance does not guarantee future results and should not base financial decisions solely on historical data. By utilizing our charting tools, the buyer acknowledges that neither the seller nor the creator assumes responsibility for decisions made using the information provided. The buyer assumes full responsibility and liability for any actions taken and their consequences, including potential financial losses. Therefore, by purchasing these charting tools, the customer acknowledges that neither the seller nor the creator is liable for any unfavorable outcomes resulting from the development, sale, or use of the products.
The buyer is responsible for canceling their subscription if they no longer wish to continue at the full retail price. Our policy does not include reimbursement, refunds, or chargebacks once the Terms and Conditions are accepted before purchase.
By continuing to use our charting tools, the user acknowledges and accepts the Terms and Conditions outlined in this legal disclaimer.

Trade Warehouse (SPOT trades)Hello there!
Let's imagine You are trading SPOT, buy more and more every new dump, but bear market is not going to stop... and your first trade was 3 YEARS AGO!!!
Can't believe it is true.
The problem is - exchanges allow You to see only new trades last 6 months(Binance). But I want to see all of them! How do I know AVG Price?
This script is my solution. Just use it to track and store your trade, so You can see AVG without uploading old trades everytime and using calculator.
Script description:
Here You can see the "Trade" type of variable. Python script using Pandas converts trades from .csv file into string type that You can input as trade(price, pair, amount, date..). After it uppends to the trades_array and pushed into the loop.
If trade date is more than current cundle - it pushes new trade to other arrays such a "pair", "avg_tot" etc. to comput it later.
If trade was buy - it increase invested capital and owned amount, opposite for sell and recomputs AVG price.
Since script has at least 1 trade it starts to plot AVG price.
There are 2 AVG price:
1. For total invested counting(You can get negative value if traded successful)
2. Current AVG price since last 0 currency amount(there is dust value to set how many usd we take as dust)
Table represents all assets statistics
Just upload your trades only 1 time, use script to convert it into pine code, and use as indicator. This script allow You to see ALL trades from oldest to the newest.
github.com/Arivadis/...w_Tradings_warehouse
If this script helped You - press Star (on GitHub) Like (on TradingView)
Warning -
Does not include free/earn/withdraw/deposit counting. Only Buy and Sell =>
This script has no idea about your side currency deposits, so if You got Your BTC or EUR or .. from another wallet and sold later - it can break your statistical data. Add this transfer manually(see examples inside script).
Use my github manual to get this script workin.
Installing takes around 3 minutes and contains 3-5 steps
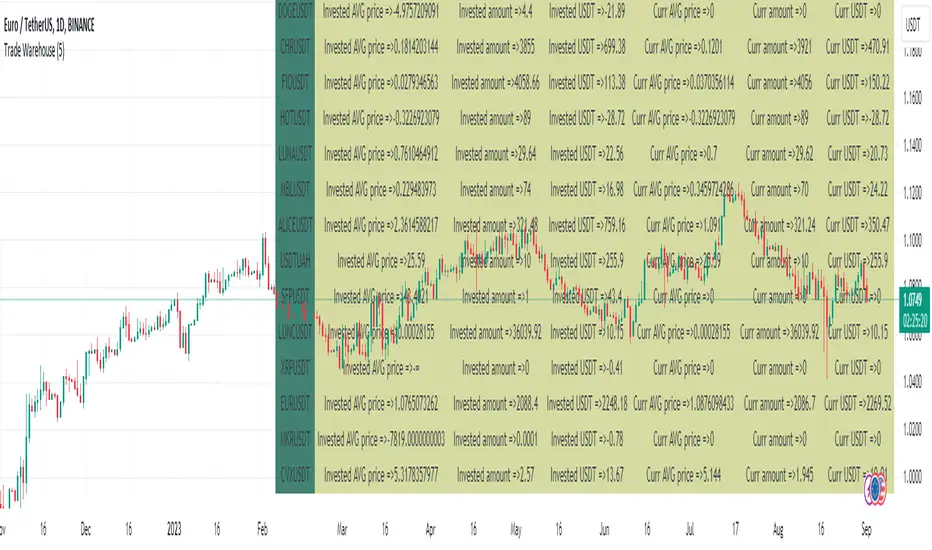
Auto Fibonacci TP Levels [WJ]This script automatically draws Fibonacci levels on a trading chart which are popular tools for traders seeking to identify potential areas of support and resistance.
Here are the features and benefits of this script:
1. Versatility in Sourcing Trade Entries:
Trade source can be customized to either longs (buying trades) or shorts (selling trades). The user has the flexibility to adjust their entry points based on their trading strategy.
Up to 2 sources can be used, expand if you wish.
As it is coded now, the source you have to pick from has to have a 'plot' that sends a (long) or (short) and is equal to 1 and 2 respectively.
Example: In the script you want to use for Long and Shorts, make a plot like this:
plot(LONG ? 1 : SHORT ? 2 : 0, title = "⭐ Outbound signal", display = display.none, editable = false)
The variable name of the LONG and SHORT needs to be the same as the one your code is using to indicate those trades.
2. Flexible Fibonacci Start Points:
The starting points for drawing Fibonacci levels can be customized for both longs and shorts.
3. Configurable Historical Data Length:
Users can adjust the number of historical bars to analyze for calculating higher highs (HH) and lower lows (LL).
4. Informative Labels and Lines:
The script can be configured to show the distance from the entry point to the 0.618 Fibonacci level (the so-called "golden ratio"). This helps traders to visualize the risk-reward ratio of their trades.
It indicates when a Fibonacci level was crossed which could signal a potential reversal.
It allows users to display the golden pocket levels only (0.618 and 0.65) or all the Fibonacci levels.
5. Customizable Fibonacci Levels and Colors:
Users can define their preferred Fibonacci levels and assign specific colors to each of these levels. This helps in identifying different levels quickly and intuitively.
The script also includes functionality for setting stop loss levels for short and long positions, which helps in risk management.
6. Clear Visualization of Crossing Levels:
If a trade crosses a specific Fibonacci level, the script draws lines indicating the crossing. This can help traders to identify potential breakout or reversal points.
7. Calculation of Fibonacci Boxes:
For each Fibonacci level, the script creates a box that indicates the level's range on the chart. This visual aid can help traders to better understand the price movement within these levels.
8. Customizable Labels:
The script provides percentage difference labels at each Fibonacci level, displaying the difference between the price at that level and the price at the 0 Fibonacci level. This can help users quickly understand the price change in terms of percentage at each level.
9. Performance Efficiency:
The script uses arrays to store and manage the Fibonacci levels and their associated colors. This approach enhances the performance of the script, especially when processing a large amount of data.
10. Adaptability:
This script automatically adapts to market movements. When the price crosses a level, it identifies and records this event, aiding the trader's decision-making process.
Overall, this script is highly customizable, adaptable and provides a clear visual representation of important trading data, making it an effective tool for traders using Fibonacci levels in their strategies.
NOTE: If you can't see the fib lines, it is because they have already been triggered/touched by a candle and they are set to not continue after they are touched.
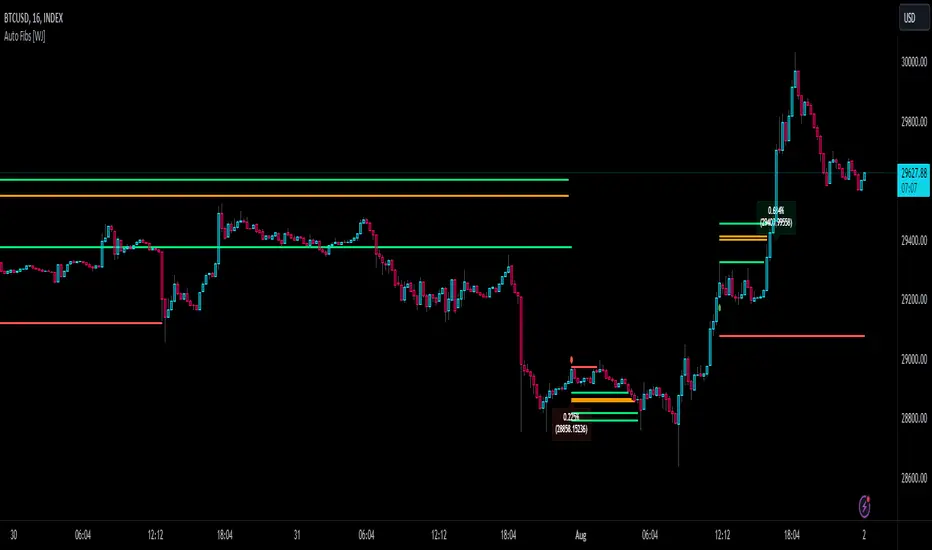
METRIC-TREND-TRADERThis script is a Fully Automated trading script meant to be used with "Oanda" broker and the plug-ins for algorithmic trading automation.( FOREX ONLY)
This script is meant to capture "TREND FOLLOWING " for intraday charts (1hour) preferably and will hold for days / weeks .trading on forex markets.
(The combination of indicators includes a short high and low price channel and a longer term high and low price channel)
This script is original in description as being automated to try and capture dynamic trending markets with both long and short fractal price channels. although trend trading is not an original concept. trend trading with this dynamic indicator allows the user visualize both short term and longer term price action at the same time, helping to make better trading decisions. the channels are designed to buy breakouts in the direction of the longer term trend while trailing stop a built-in stop loss that allows normal market movement while attempting to lock in flexible profits.
The concept of this indicator is be able to quickly visualize trends by high lighting the large green areas beneath price "when trending long" which is the difference between the (user defined) short term lows and the (user defined) Long period price lows.
For "down trending" markets a large red area above price will be displayed and this is the difference between the (user defined) short term highs and the (user defined) long term highs.
This strategy uses a lower than reward profile to jump in direction of market moves for continuation,
(1 risk to 4 reward)
in the likelihood the instrument will continue (example) 200 pips before it reverts 50 pips in the counter direction.
This strategy should only be used in markets that you believe are "TRENDING" at the time of trading otherwise you risk trend trading a range market.
This script uses a (user defined period) of short term high and low price ( green/red color) and (user defined period) Long Term high and low price (green/red) chosen in the indicator settings menu.
The default parameters are 10 with a (minimum of 1 and maximum of 10000) for the short term channel and 50 with a (minimum of 1 and maximum of 10000) for the long term price channel , the default parameters = roughly 2 days "long term" and 10 hours "short term" of price action on the (1 hour) chart.
Strategy entries and exits , for Long trades the trade will be entered if the short term high crosses above the Long Term high and the Short term low is not equal to the Long term low . the trade will exit if profit or stop loss are hit or if the Short term low crosses under the long term low.
For Short trades the trade will enter short if , the short term low crosses under the long term low and the short term high is not equal to the long term high. the trade will exit if profit or stop loss are hit or the short term high crosses over the long term high
"The default parameters should be kept unless you fully understand the complete strategy"
There are two very important inputs to be selected at the user setting menu "Long Only " and "Short Only" if you are looking to place long trades only select "Long Only" or for short trades select " Short Only" it is not recommended to keep both selected as it will trade both sides!
When the trade is entered a red , a blue and green horizontal dotted line will appear on the chart.
the blue line is the strategy entry price , the red line is the stop loss price , and the green line is the take profit price . the colors will invert if the trade is long or short.
(Setting alerts should be done in the indicator settings menu, and the parameters you chose will determine the stop loss/target and the amount of "units = (position size)" you wish to trade for the (forex only) markets. using "alert() function calls only" is the only alert that should be used with this strategy.
(note : when "alert() function calls only" is set two messages will be sent, one closing any open position in the opposite direction and one placing the new order regardless if you are currently in a trade or not)
Trade targets , stoploss and trade position size are a user defined variables entered in the indicator settings menu. (target pips minimum 0 and a maximum of 1000)(stop pips minimum of 0 and maximum of 1000)
Back test date range is included in the script for back testing different data periods.
the back ground will be colored a transparent navy blue if the period you are looking trading is with in the date range( note: to place live trades the end date will need to be in the future)
this is also adjustable in the settings menu
The avoid spread filter is a user defined time in which the spread is typically higher than average, applying this filter avoids trades in the specified time. When this filter is applied there will be a transparent red back ground color in the specified time.
Back test default setting are equivocal to OANDA:USDJPY
at the time of this publication placing trades with the "Oanda" broker are as follows , USD units = 2000 equal 2000 USD position size . "Oanda" current leverage is 20 to 1 for this particular pair and commission is paid in spread (1.4) pips = 0.19 USD per trade , Margin required for the trade is 100.0 USD , Position sizing = 10% of a 1000 USD account.
OANDA:USDJPY

SMC Toolkit |ASE|This indicator provides 10+ features all-in-one. Focusing on price action and Smart Money concepts, we have provided automated multi-timeframe features such as Market Structure(BOS / CHoCH) to identify trends, Fair Value Gaps to identify Imbalances, and much more.
Pure price action analysis is a preferred strategy over indicators due to their lag and noise. Many traders popularized SMC or “Smart Money” concepts to identify and trade like/with institutions or Smart Money traders. We have automated these features and made them multi-timeframe to simplify your charting process and advance your trading so you can efficiently trade.
Features:
The included price action features are listed below:
- Multi-Timeframe Market Structure (BOS, CHoCH, MSS, IDM)
- Trend based Candle Coloring
- Multichart (Extra time frame on the same chart)
- Multi-Timeframe Fair Value Gaps & Balanced Price Ranges
- Trapped Market Participants (Multi-Time Frame based on Orderblocks)
- SMT Divergences
- Volume Imbalances
- Premium Discount Array
- Displacement Candles
- Previous OHLC (Daily, Weekly, Monthly)
- VWAP and Std.Dev. Waves
Benefits & Examples:
In the image below we can see plenty of trade setups that formed in confluence with the features we were using. Displayed we have higher timeframe FVGs as our point of interests, Market Structure (Trend Bar Coloring) as our entry confirmation, and Liquidity Levels as our targets.
In this image we can see the same setup as before, higher timeframe FVG with Market Structure reversal targeting a Liquidity Level. In addition we can see the Trapped Market Participants feature showing trapped sellers at the low which provides additional confluence for our long position and offers a cleaner and safer entry on the pullback.
Our goal is to provide as many useful features as possible, automating the process to make it easier and quicker for us as traders. We want to spend less time charting and more time planning proper trades.
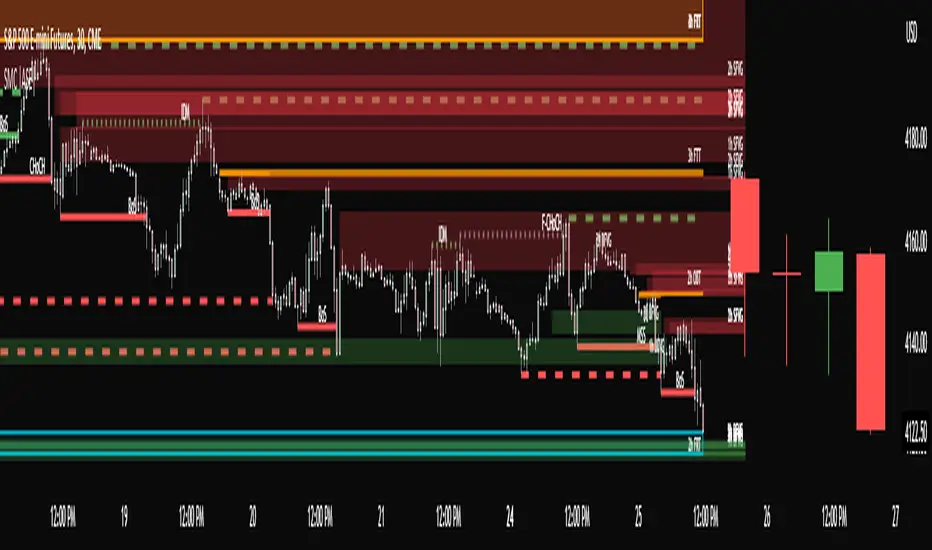
VWAP Open Session Anchored by HampehThe VWAP Open Session Anchored indicator differs from traditional VWAP indicators by automatically anchoring the Volume Weighted Average Price calculation to three market session starts Morning, Evening, and Night. Each session represents a distinct time period within the trading day, offering traders and investors a more comprehensive view of the volume-weighted average price within specific sessions.
What Is the Volume-Weighted Average Price (VWAP)?
The volume-weighted average price (VWAP) is a technical analysis indicator used on intraday charts that resets at the start of every new trading session.
VWAP is important because it provides traders with pricing insight into both the trend and value of a security.
KEY TAKEAWAYS
1. The volume-weighted average price (VWAP) is a single line on intraday charts.
2. It looks similar to a moving average line but smoother.
3. VWAP represents a view of price action throughout a single day's trading session.
4. Retail and professional traders may use the VWAP to help them determine intraday price trends.
5. VWAP typically is most useful to short-term traders.
VWAP is calculated by totaling the dollars traded for every transaction (price multiplied by the volume) and then dividing by the total shares traded.
VWAP = Cumulative Typical Price x Volume/Cumulative Volume
Where Typical Price = High price + Low price + Closing Price/3
Cumulative = total since the trading session opened.
How Is VWAP Used?
VWAP is used in different ways by traders. Traders may use VWAP as a trend confirmation tool and build trading rules around it. For instance, they may consider stocks with prices below VWAP as undervalued and those with prices above it, as overvalued. If prices below VWAP move above it, traders may go long on the stock. If prices above VWAP move below it, they may sell their positions or initiate short positions.
Institutional buyers including mutual funds use VWAP to help move into or out of stocks with as small of a market impact as possible. Therefore, when they can, institutions will try to buy below the VWAP or sell above it. This way their actions push the price back toward the average, instead of away from it.
Source: www.investopedia.com

TUE Argentum Algo V1This algorithm is designed to look trend for opening conditions, apply various filters including volume and volatility, then determine stop outs, break evens, and take profits.
The algorithm uses proprietary math based on the concepts of volatility, standard deviations, average true ranges, and volume to help determine trend. You can filter based on cumulative volume delta, volatility, and moving average based trend. It includes settings for either trend following or contrarian trades, and the ability to go long, short, or both.
The take profit areas are based on proprietary math that help find peaks and valleys. You can adjust the size of the take profits as a percentage of the position, change to static take profits (i.e. take profit in 16 ticks), or use both. You can also disable them and use the natural closing conditions of the trades (detection of trend change in the opposite direction).
Our algo works in any market and will allow user to adjust input settings to be used on any ticker they'd like. It is built as a strategy so you can back test on any ticker to find the exact right settings to dial it in and then switch to live trading mode to see signals. Can be used for day trades or swing trades.
Automated Trading
This algo has been tested and certified to work for automated trading.
Works on Forex
It's confirmed to work on forex so you can trade that market.
Gets you into long successful trades, and gets out of poor ones quickly
It keeps you in the long trades taking small profits along the way, but cuts losers quickly in comparison. This style leads to a high profit factor.
It looks at many variables so you don't have to
- Uses trend analysis for opening/closing conditions.
- It measures the strength of trends to help determine if it should enter or not.
- It uses volume, if the user wants, to help filter entries. The volume calculation is based off of my proprietary cumulative volume delta indicator and helps find if the volume is moving long or short.
- It uses proprietary take profit math to help find peaks and valleys to peel off profits. It is based on the changes in momentum of the underlying.
- It allows for stop outs and break evens based on volatility so they'll always adjust with the movement of the underlying ticker (see the blue lines above and below the opening in the chart).
- It allows for offset break evens to keep a portion of the profit.
Strategy for the Algo
Included so you can understand how to trade with it.
ONE: After loading this strategy onto a ticker turn off volume if it's a ticker with no volume , set the dates at the bottom to when the stock is active (you want to start backtesting when a stock started trading like it trades currently).
TWO: From there adjust the short term trend settings to find the highest win rate and profit factor.
THREE: Then adjust the volume length to find the highest win rate and profit factor. It's important while doing these that you pay attention to a smooth upward equity curve.
FOUR: After this has been done now adjust the long and short risk multipliers. This determines your stop out.
FIVE: Then adjust breakeven multipliers - this is the level at which it changes to a breakeven stop out instead of the previous one. You can also set an offset to keep a small part of the profit.
SIX: Finally adjust the take profit sizes.
SEVEN: Once this is all done go back through the list and adjust up and down by one or two clicks and see if a better curve can be obtained. Very frequently long and short trades have different settings.
EIGHT: When you are finished save the settings in a custom indicator template and put it with it's own chart.
Additional
The settings shown on screen are not the default settings, but are settings chosen for this ticker and timeframe based on the process above. Nearly every ticker and timeframe will require adjustment from default, that's why the algorithm is built to be highly flexible. It can fit any ticker and timeframe, as well as market environment.
This particular setup has the algo running a scalping program on ES 3 min with a 16 tick static target. This algorithm can be set up as a scalper, or used to day trade more regularly. It can also swing trade.
As shown here the algo includes $1.25 of commissions and 1 tick of slippage on all orders (about our average for automated trading on ES).

TUE ADX/MACD Confluence Algorithm V1This algorithm is designed to look at the ADX/MACD confluence for opening conditions, apply various filters including volume and volatility, then determine stop outs, break evens, and take profits.
The ADX and MACD confluence can be a powerful predictor in stock movements. Both of these indicators find trend but do it in different ways. When they're combined they have a high success rate of finding openings. That's done by finding the bar in which both show the same direction - that bar is the beginning of the confluence. I have a free indicator called the TUE ADX/MACD Confluence that you can use to see this in action.
This script will help you find those confluences in an easy to understand manner. It will open a trade on a detected confluence, using the rest of the variables available in the algorithm as filters. You can filter based on cumulative volume delta, volatility, and trend. It includes settings for either trend following or contrarian trades, and the ability to go long, short, or both.
It includes Buy and Sell signals for detected confluences, and will show colored candles to help you determine when to exit a trade if you don't want to follow the included take profit areas. When the candles turn to white that means the detected confluence is no longer in play. The Buy and Sell signals will display on the first occurrence of each confluence.
The take profit areas are based on proprietary math that help find peaks and valleys. You can adjust the size of the take profits as a percentage of the position, change to static take profits (i.e. take profit in 16 ticks), or use both. You can also disable them and use the natural closing conditions (reversal of MACD/ADX confluence).
Our algo works in any market and will allow user to adjust input settings to be used on any ticker they'd like. It is built as a strategy so you can back test on any ticker to find the exact right settings to dial it in and then switch to live trading mode to see signals. Can be used for day trades or swing trades.
Automated Trading
This algo has been tested and certified to work for automated trading.
Works on Forex
It's confirmed to work on forex so you can trade that market.
Gets you into long successful trades, and gets out of poor ones quickly
It keeps you in the long trades taking small profits along the way, but cuts losers quickly in comparison. This style leads to a high profit factor, as you can see over 3.0 in the included ES 3 Min chart.
It looks at many variables so you don't have to
- Uses ADX/MACD confluence for opening/closing conditions.
- It uses volume, if the user wants, to help filter entries. The volume calculation is based off of my proprietary cumulative volume delta indicator and helps find if the volume is moving long or short.
- It uses proprietary take profit math to help find peaks and valleys to peel off profits. It is based on the changes in momentum of the underlying.
- It allows for stop outs and break evens based on volatility so they'll always adjust with the movement of the underlying ticker (see the blue lines above and below the opening in the chart).
- It allows for offset break evens to keep a portion of the profit.
Strategy for the Algo
Included so you can understand how to trade with it.
ONE: After loading this strategy onto a ticker turn off volume if it's a ticker with no volume , set the dates at the bottom to when the stock is active (you want to start backtesting when a stock started trading like it trades currently).
TWO: From there adjust the ADX/MACD to find the highest win rate and profit factor.
THREE: Then adjust the volume length to find the highest win rate and profit factor. It's important while doing these that you pay attention to a smooth upward equity curve.
FOUR: After this has been done now adjust the long and short risk multipliers. This determines your stop out.
FIVE: Then adjust breakeven multipliers - this is the level at which it changes to a breakeven stop out instead of the previous one. You can also set an offset to keep a small part of the profit.
SIX: Finally adjust the take profit sizes.
SEVEN: Once this is all done go back through the list and adjust up and down by one or two clicks and see if a better curve can be obtained. Very frequently long and short trades have different settings.
EIGHT: When you are finished save the settings in a custom indicator template and put it with it's own chart.
Additional
The settings shown on screen are not the default settings, but are settings chosen for this ticker and timeframe based on the process above. Nearly every ticker and timeframe will require adjustment from default, that's why the algorithm is built to be highly flexible. It can fit any ticker and timeframe, as well as market environment.
Also included in the chart above is a $1.25 commission per contract, and a tick of slippage (which on average is about right for automated trading on ES).
