Triple MASuper simple.
Three simple moving averages all in a single indicator for your convenience.
Default values:
MA 1 - 20
MA 2 - 50
MA 3 - 100
If you like this or any of my other scripts - please consider chucking some BTC my way ;) 1LbFxAYJSVPxirT8eW31QHaGbySHyPYgMq
Average

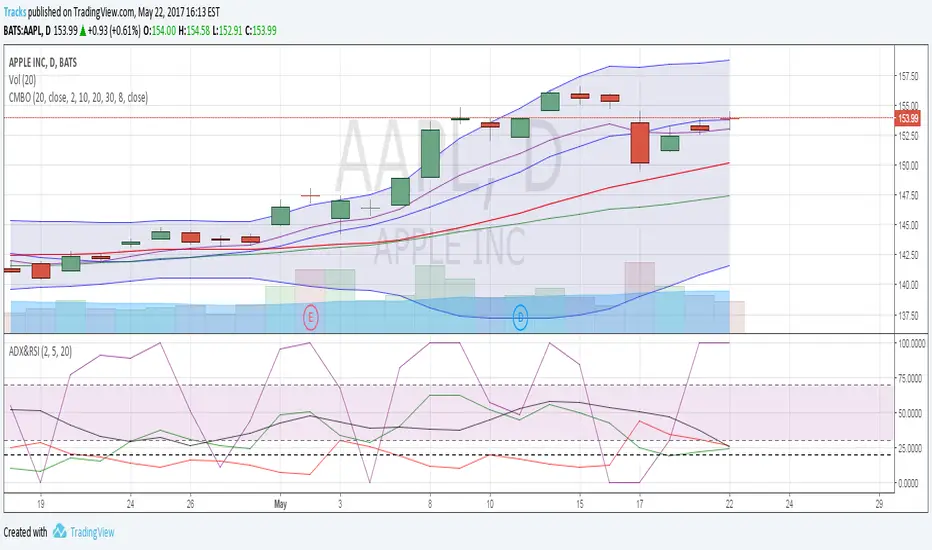
Combo Indicator V2This is an updated version of the Combo Indicator I previously published. It combines Bollinger Bands, 3 moving averages and 1 exponential moving average all into one chart. I use this indicators on most of my charts so wanted an easy way of combining them all.
SPECIAL BONUS
This indicator also includes a common Bollinger Band trading strategy built in. It was developed with options trading in mind for members over at OptionsPlayers.com. It tries to detect when the BB tunnel tightens, and then triggers an entry position when it detects the breakout. No strategy is 100% accurate, and there are some false positives, but it seems to work fairly well. However, do your own due diligence and use at your own risk.
The strategy can be turned on using a checkbox in the properties.


Average Daily Range - without open barBasic ADR-indicator that is showing the daily range on lower timeframes as well, without using the current open daily bar for calculation.
Also plots as line in a separate indicator window. Updates displayed value when hovering over the candles on the chart to see historical Numbers.

Average True Range - without open barBasic ATR without the current open bar in progress, it calculates the closed bars within the chosen ATR Period

420_cci_averages_alertsSup all it is Snoop
Here is a CCI script that does averages of the CCI with many types to choose from. It also has a few alert types which have titles that are pretty self descriptive. I use the alerts as 'once per bar on close'. Hope it helps you!
xoxo
Snoop

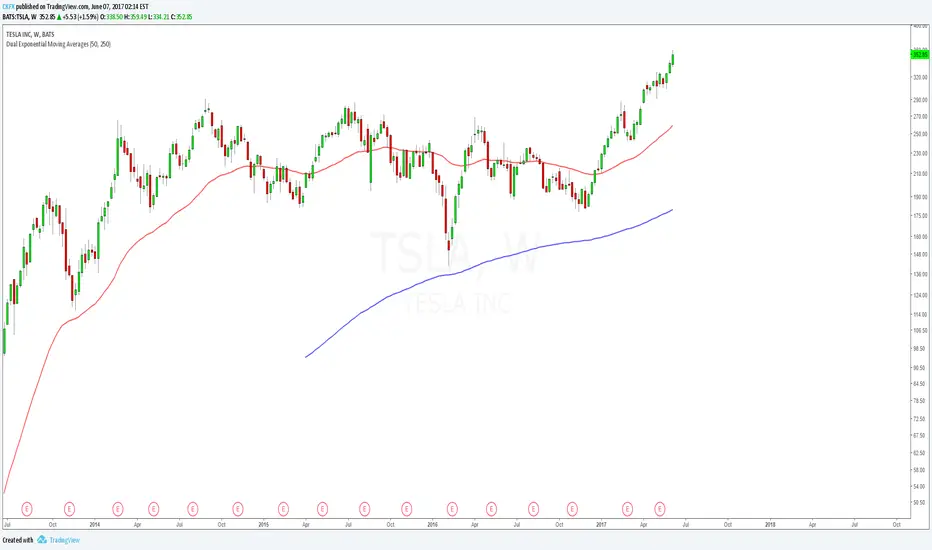
Dual Exponential Moving AveragesJust like the regular "Moving Average Exponential" indicator except this allows you to show 2 with custom time intervals, saving non-subscribers to Trading View an indicator slot. Enjoy.
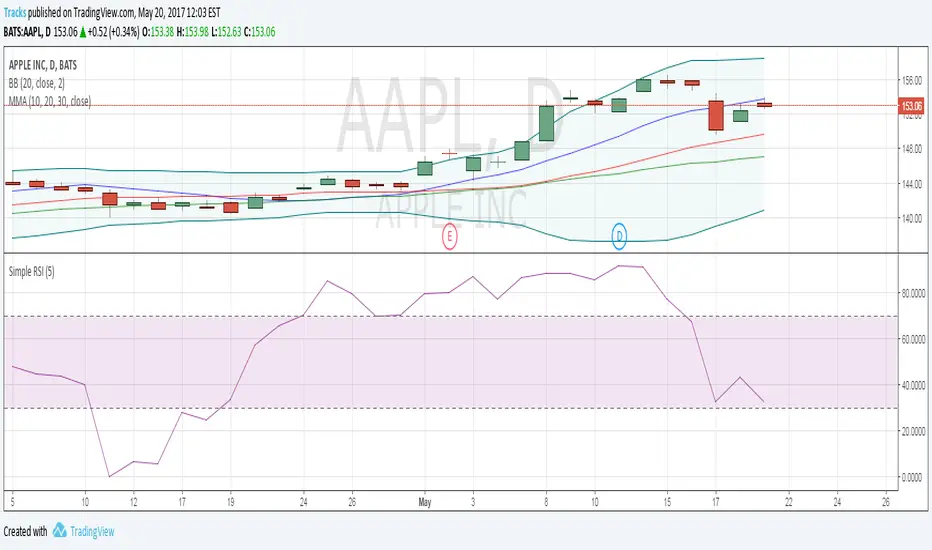
Combo IndicatorFor easier setup, this script combines 5 indicators. 3 simple moving averages, 1 EMA and Bollinger Bands. These are common indicators that are that often used and discussed on OptionsPlayers.com
Multiple Moving AverageCombines 3 moving average plot lines into one indicator for easy configuration
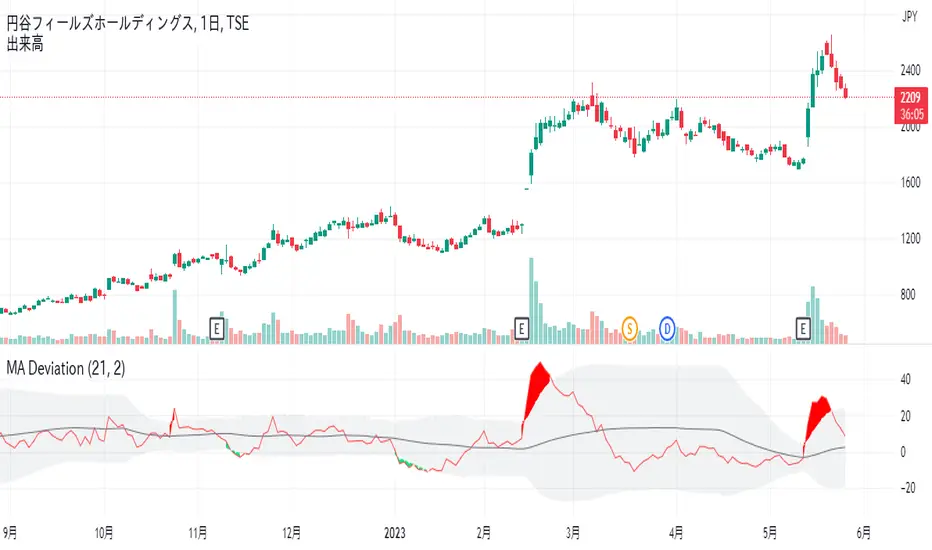
Moving average deviation rateMoving average deviation rate
Simple moving average deviation rate and standard deviation.
The bollinger band is momentum value standard devition.
Bat the bollinger band is not normal distribution to close price.
Moving average deviation rate is normal distribution.
This indicator is draw Moving average deviation rate and fill area 2σ standard devition.
If it exceeds 2σ, it is a trading opportunity.
移動平均かい離率と、2σのバンドです。
ボリンジャーバンドは移動量の標準偏差を描画しますが、終値はボリンジャーバンドに対して正規分布を描きません。
移動平均かい離率は、標準偏差に対して正規分布を示します。
かい離率2σを超えた場合、トレードチャンスです。
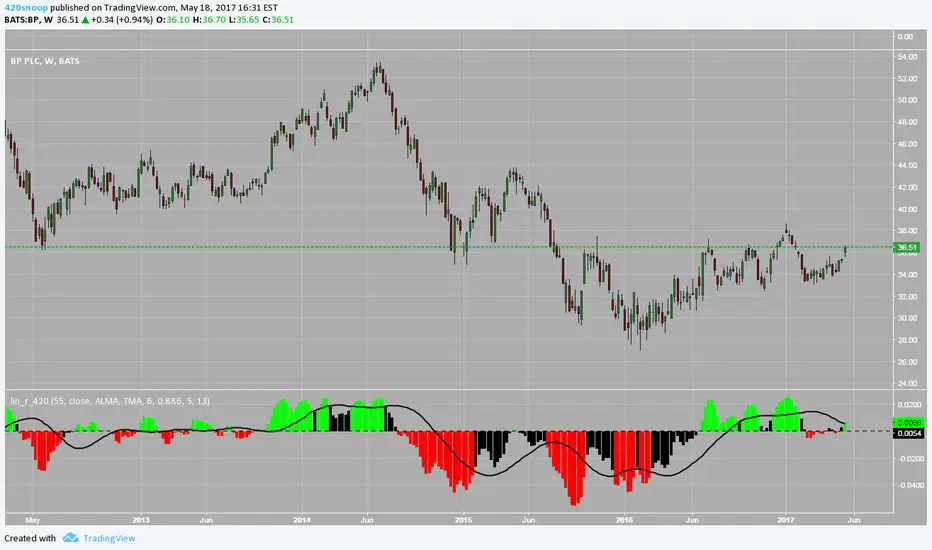
lin.reg.s_420Hey all,
Snoop here with another script this one is linear regression slope analysis;
I used a base skeleton script of /u/ucsgears before adding some other cumulative log filtering and average customization functions I like :)
If you have success with this script feel free to buy me a coffee through my bitcoin address :)
Appreciate the love I get from the community! Thanks all and happy trading!
-Snoop
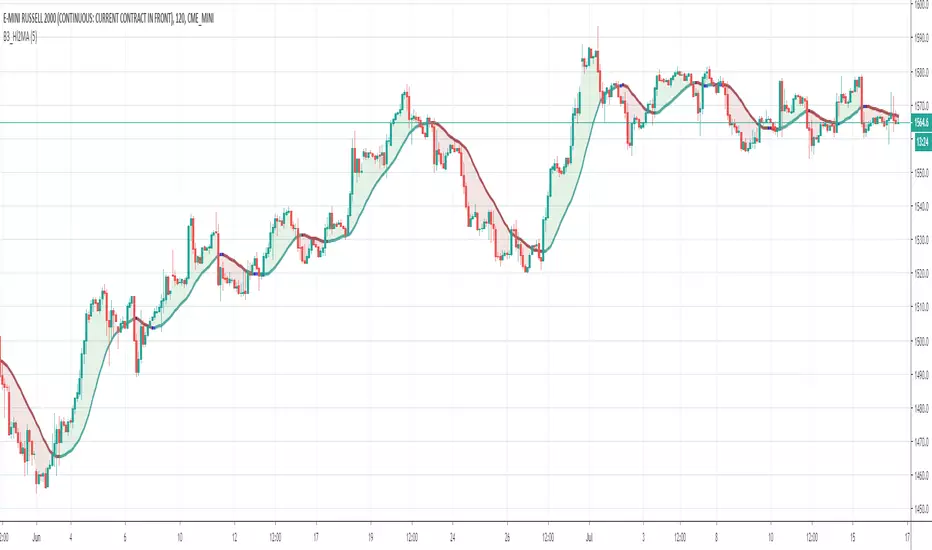
B3_HL2MAB3_HL2MA is a super smoothed mean of medians. This moving average is a great trend switch mechanism with a bit of a knack for showing mean deviation and reversion. If your clouds get to be large, you are probably ripe for taking the profits. Often the MA comes to meet price, so the reversion trade isn't what this indicator is all about. Enter on the cross or turn of the line, and exit on major deviations from the line if you can time them. This makes for a decent way to help stay in the trend. The line turns dark blue as in the case that a trend is compromised by price action, otherwise stay in the direction of teal = long and maroon = short.
The length on this is very sensitive, and a smaller number is the best; the four to six range is usually the best for that input. I made the math for this indicator myself from a simple idea to use the median price of the bar, and then average that out, and afterwards smoothed per my style. It has become one of only a couple MA based indicators I will use. Enjoy! :) ~B3
d^.^b
Multiple Moving Averages using only 1 Indicator!Multiple moving averages in one indicator, so those of you without a pro membership can add multiple moving averages to your chart while only taking up 1 of the 3 indicators.

CMOabsav Backtest This indicator plots the absolute value of CMO averaged over three
different lengths. This indicator plots a classical-looking oscillator,
which is really an averaged value based on three different periods.
You can change long to short in the Input Settings
Please, use it only for learning or paper trading. Do not for real trading.

420_betaA newer, more customizable version of the holy grail script I published for silver before.
This script is a work in progress (as was the last version) and although I have been trying to refine this script I would still only classify it in the early stages of development; unlike my previous Euro Dollar strength holy grail script which was designed to work with only the EU pair or the XAGUSD spread script that was designed to work only with silver traded in USD, this script is designed to work with ANY commodity traded in USD, EUR, GBP, or JPY.
In this version I have tried to make smaller time frames work (60 - 240 supported now?) and added a lot of options for average type to be considered in the basket. Not every average created equally though, so I need feedback still etc...
I have also added the ability to specify what the 'basis currency' is. For example XAUUSD --> USD is basis currency. XAGGBP --> GBP is basis currency.
The only supported currencies at the moment are USD, EUR, GBP, and JPY (case sensitive)
If someone requests another (CHF, CAD, etc) I can add that as well.
I have an alert centric version (study, not a strategy) that I am trying out as well on my Euro dollar strength script and this 420_beta script
If you want access, feel free to ask, but as this is still in beta and I'm looking for feedback I'll probably only provide this script to those who have a record of trading commodities here on TV (aka published an idea on XAUUSD, XAGUSD, USOIL, Copper, etc...)
- Snoop

420_alphaA newer, more polished (aka less buggy), and updated version of the holy grail script I published for silver before.
This script is a work in progress (as was the last version) and although I have been trying to refine this script I would still only classify it in the early stages of development; unlike my previous Euro Dollar strength holy grail script which was designed to work with only the EU pair or the XAG spread script that was designed to work only with silver, this script is designed to work with ANY commodity traded in US dollars as this script also utilizes my holy grail basket method to determine the true strength of any commodity in terms of USD.

Prime Fib AvgsHey all,
Just thought some might find it useful to have a script of the first 7 numbers that are both fibonacci and that are prime numbers as simple moving averages and as exponential averages.
If anyone wants any other average type added to this script I can put out another version
Happy trading,
Snoop

EMA Time-FrameThis EMA allows you to specify a time-frame for the price used to calculate the moving average. For example, you can create 1 hour EMAs on your 5 minute chart.
NOTE: This indicator only works on intraday charts. The time-frame specified for the indicator must be greater than or equal to the time-frame of the chart.

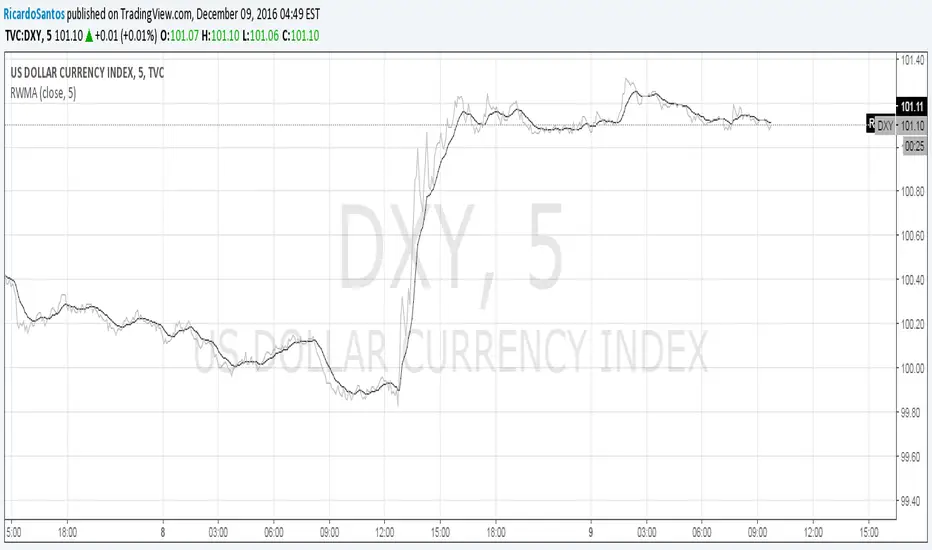
Function - Regressively Weighted Moving AverageEXPERIMENTAL:
Weights its self value by X against 1 time the current price.


RO MA SIGNALIndicator is based on 5 moving averages. A price tracking MA(12), a short period MA(21), a signal MA(50) which often used in conjunction with the short MA, and two long period moving averages 100 and 200 respectively. If close price is above the moving averages graph lights yellow, below turns red. The top bar represents the MA(12). Going below is the longer period moving averages placed where at the bottom MA(200). All bars marked red shows a strong down movement while all yellow is a bullish sign.
You can set the precision value to get data from lower time frames though that will increase script initialization time.

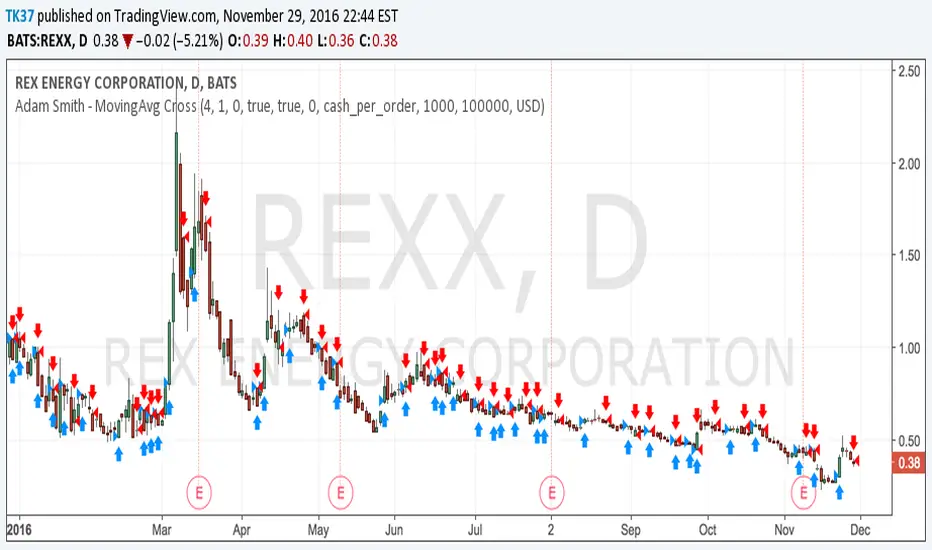
Adam Smith - MovingAvg CrossSimple Moving Average Cross script. Test on stocks and currency. For stocks test shorter time periods, meaning intra-day time periods such as 3min to 30min and so on to fit what is best. For currency, try longer periods with this model such as day to weeks depending on which currency.
NOTE: Take a look at your Max Drawdowns when testing. This will be the main indicator once you figure out your time period for backtesting. This will also let you know how much money to save and/or hold back in savings for down periods.