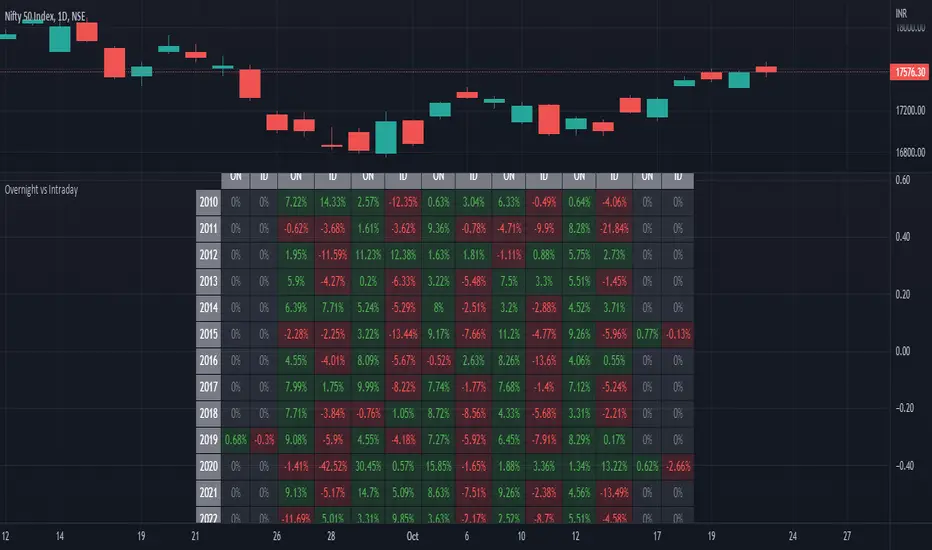
ILM Overnight vs Intraday Performance - Tabular FormUse this indicator on Daily Timeframe
This script compares Overnight vs Intraday Performance based on the Day of the Week (DOW) - Sun - Sat of index/stock/currency/commodity symbols.
ON column indicates Overnight performance = open/close -1
ID column indicates Intraday performance = close-open/1
The calculations are detailed in the tooltips of the individual table cells.
BANKNIFTY
Seasonality DOW - Day Of the Week - Tabular FormUse this indicator on Daily Timeframe
This indicator displays the seasonality data for any instrument (index/stock/ futures /currency) in a tabular data by day of the week - DOW ( Sun - Mon - Tue - Wed - Thu - Fri - Sat ).
User can change the start of the year for analysis from the inputs.
Year is represented in rows and Day of the week (DOW) is represented in cols.
This indicator uses Daily Data feed to calculate the % change
Summary data for DOW displayed as the last row

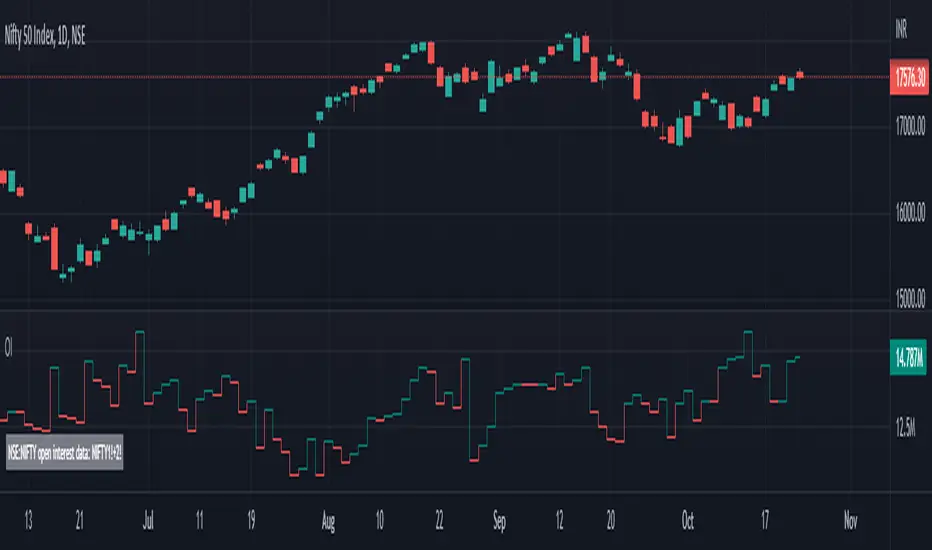
NSE Open Interest Current + Future Month - OI - COIUse this indicator on Daily Timeframe
This script enhances the standard Open Interest indicator in the following ways
Pulls Current Month and Next Month OI and sums up the data - COI
Works even if input symbol is stock/index and appends Current and Future suffix to pull the data
BankNifty ScriptsBank Nifty Script
Indicator provides Daily, Hourly and Weekly EMA's Exponential Moving Averages for different scripts of Bank Nifty Composition. You'll have CMP and % change along with cRSI.
Credit to RozaniGhani-RG for cRSI code.
Default length is 50 you can change as per your choice.
Table display can be set Vertically top, right, bottom and horizontally left, centre, right.
cRSI if above > 70 the label will change to Focus on Sell and less than < 30 label will show Focus on Buy
Basically created this script for my personal use to see in one shot what's happening in Bank Nifty Composition individual scripts.
Hope it helps.

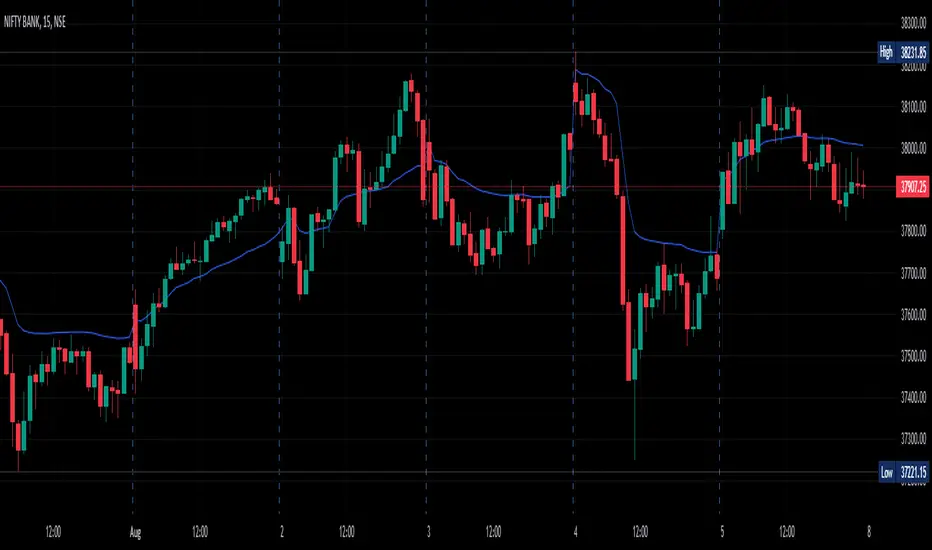
Inside Bar SetupScript Details
- This script plots Inside Bar for given day in selected time-frame (applicable only for Timeframes < Day)
- Basis plotted inside bar, relevant targets are marked on the chart
- Targets can be customised from script settings. Example, if range of mother candle is 10 points, then T1 is 10 * x above/below mother candle and T2 is 10 * y above/below mother candle. This x & y are configured via script settings
How to use this script ?
- This script works well on 10-15 mins timeframe for stocks, 15/30 mins timeframe for nifty index and 30/60 mins time frame for bank nifty index
- If mother candle high is broken, take long trade with SL of mother candle low and if low is broken, take short trade with SL of mother candle high
Remember:
1. Above logic is to be combined with support/resistances i.e. price action. This script is an add-on to price action analysis giving you more conviction.
2. If range of mother candle is very high, it is recommended to avoid the trade.
3. Basis inside bar formed on higher time frame, take trade on basis of lower time frame i.e if inside bar is formed on 60 mins, take trade on the basis of 10-15 mins time frame
Example:
1. As seen in the chart, Nifty is near it's resistance and we are seeing Inside Bar being formed, In such scenario, even if High of Mother Candle is broken, we should be more interested to short as we are near resistance and probability of getting our targets in long side is less.
2. So, if I see breakdown of mother candle i.e. price going below low of mother candle, we will short with SL of high of mother candle.
3. As seen in the chart, both the targets are achieved.
Additional Info:
1. Targets on Long/Short Side can be configured via settings. For indices 1 times/1.5 times the range works well.
2. This script plots targets basis the first inside bar formed in the day for selected time frame.
3. Inside bars formed through out the day are coloured separately but lines are plotted only on the basis of 1st formed inside bar as this strategy works well for the first formed inside bar)
4. Don't forget to check volume in case of breakout/breakdown.
Note:
1. Mother Candle - First Candle of Inside Bar
2. Child Candle - Candle formed inside Mother Candle (Second Candle of Inside Bar)
Happy Trading :)

Average Daily Range (ADR) (Multi Timeframe, Multi Period)Average Daily Range (ADR)
(Multi Timeframe, Multi Period, Extended Levels)
Tips
• Narrow Zones are an indication of breakouts. It can be a very tight range as well.
• Wider Zones can be Sideways or Volatile.
What is this Indicator?
• This is Average Daily Range (ADR) Zones or Pivots.
• This have Multi Timeframe, Multi Period (Up to 3 Levels) and Extended Target Levels.
Advantages of this Indicator
• This is a Leading indicator, not Dynamic or Repaint.
• Helps to identify the reversal points.
• The levels are more accurate and not like the old formulas.
• Can practically follow the Buy Low and Sell High principle.
• Helps to keep minimum Stop Loss.
Who to use?
• Highly beneficial for Day Traders
• It can be used for Swing and Positions as well.
What timeframe to use?
• Any timeframe.
When to use?
• Any market conditions.
How to use?
Entry
• Long entry when the Price reach at or closer to the Green Support zone.
• Long entry when the Price retrace to the Red Resistance zone.
• Short entry when the Price reach at or closer to the Red Resistance zone.
• Short entry when the Price retrace to the Green Support zone.
• Long or Short at the Pivot line.
Exit
• Use past ADR levels as targets.
• Or use the Target levels in the indicator for breakouts.
• Use the Pivot line as target.
• Use Support or Resistance Zones as targets in reversal method.
What are the Lines?
Gray Line:
• It the day Open or can be considered as Pivot.
Red & Green ADR Zones:
• Red Zone is Resistance.
• Green Zone is Support.
• Mostly price can reverse from this Zones.
• Multiple Red and Green Lines forms a Zone.
• These lines are average levels of past days which helps to figure out the maximum and minimum price range that can be moved in that day.
• The default number of days are 5, 7 and 14. This can be customized.
Red & Green Target Lines:
• These are Target levels.
What are the Labels?
• First Number: Price of that level.
• Numbers in (): Percentage change and Change of price from LTP (Last Traded Price) to that Level.
General Tips
• It is good if Stock trend is same as that of the Index trend.
• Lots of indicators creates lots of confusion.
• Keep the chart simple and clean.
• Buy Low and Sell High.
• Master averages or 50%.

VWAP For NIFTY & BANKNIFTY [Zero54]NIFTY and BANKNIFTY Being Index do not have VWAP (because there is no volume generated). This is a simple script that displays NIFTY's future VWAP on NIFTY's Spot chart and similarly, displays BANKNIFTY's future VWAP on BANKNIFTY's sport chart. Fast and quick. Just few lines of code. No hefty un-necessary calculations.
No settings necessary. The script automatically detects NIFTY and BANKNIFTY and displays the corresponding VWAP.
Enjoy and share the knowledge. If you love this script, please boost/love this script and add a comment. Cheers!
NSE:NIFTY
NSE:BANKNIFTY
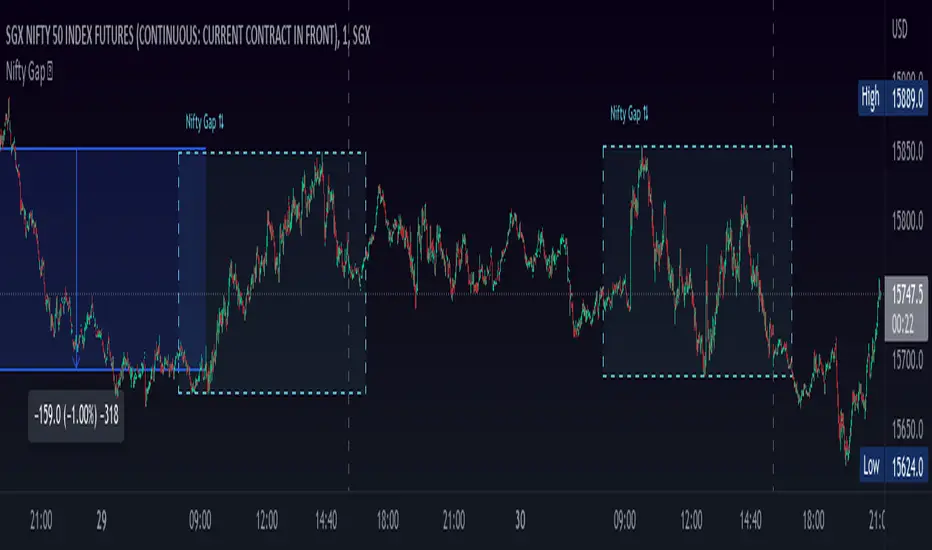
Nifty Gap ⇅This indicator help to find NIFTY gap up or gap down opening,
use this indicator on SGX NIFTY
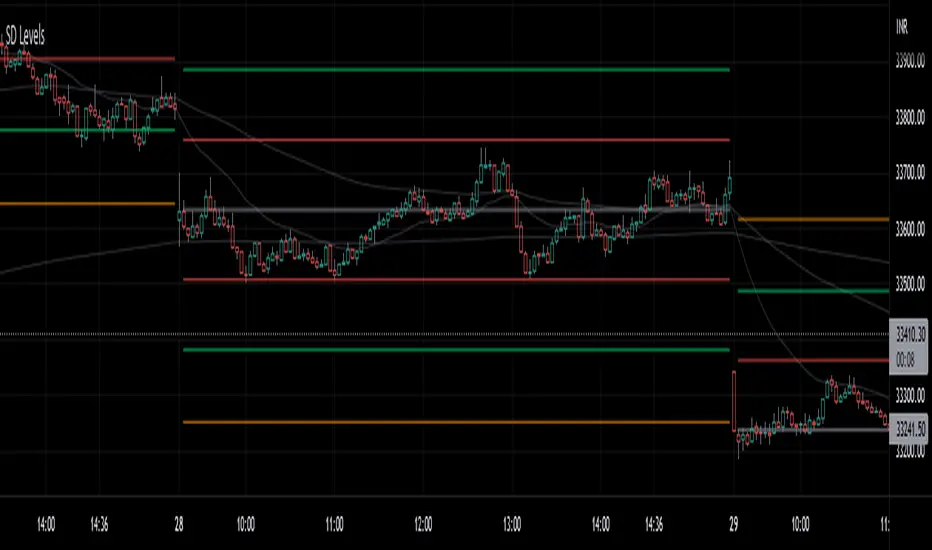
SD LevelsSD Levels is an indicator for the gap-up gap down markets
Works best on 5minute and lower time frames.
Involves standard deviation levels, Emas and Vwap.
Colorful lines are standard deviation levels which are +0.33,-0.33,+0.66,-0.66,+1.00 and -1.00 based.
Static Gray line is settlement line based on the first candle of the day and the tf you choose (default source OHLC4, also works good on close source)
Sentient levelThe indicator presented here is made based on the study published on NSE:INDIAVIX . Basically it shows 2 sigma (by default) trading ranges of the next day (by default) of indices e.g. NSE:NIFTY & NSE:BANKNIFTY . Everyday three new lines get plotted automatically on the chart of the instrument (preferably NSE:NIFTY & NSE:BANKNIFTY ) you want to trade. Generally it's expected that the index to be traded within the ranges however in case of major gap-up or gap-down if the index opens above the higher range or below the lower range then it's assumed that the day to remain very volatile. This three lines can be considered as important support/resistance . Default parameters are set in consideration of day trading however user can modify them manually as per their trading style.
If you like my work you can donate through Tradingview coin. Thanks

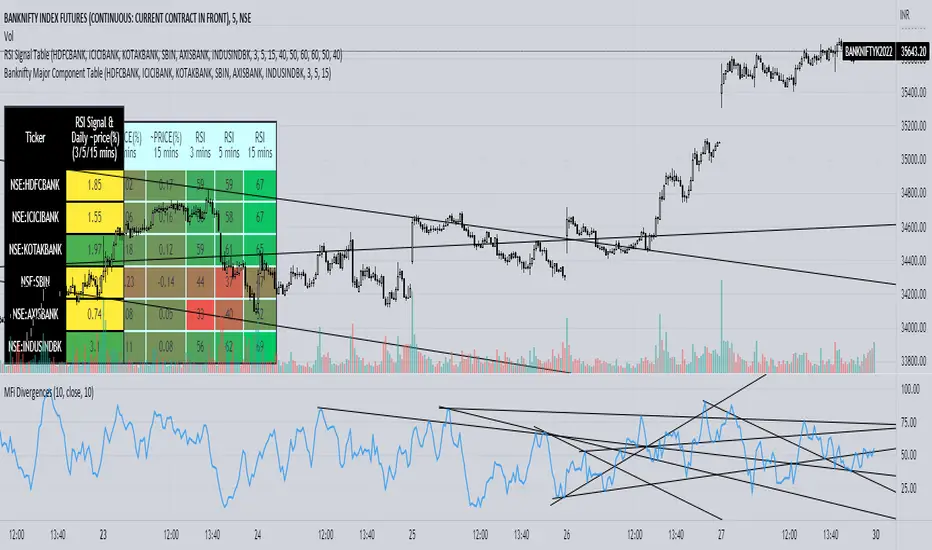
Banknifty Major Component TableThe table presented here is comprised of major Banknifty Index constituents showing price change in percentage terms and RSI value of three different timeframes to gauge overall Banknifty sentiment. This table is primarily created to cater scalpers and day traders. It helps traders to see market activity at a glance.
Heavy Weight Stocks for Bank NiftyHeavy Weight Stocks for Bank Nifty
Stocks which are part of Bank Nifty are displayed in the table.
If the %Change > 1 then bold green
If the %Change <1 and >0, then light green
If the %Change < -1 then bold red
If the %Change > -1 and <0 then light green
NSE:BANKNIFTY
NSE:HDFCBANK
NSE:ICICIBANK
NSE:AXISBANK
NSE:KOTAKBANK
NSE:SBIN
NSE:NIFTY
NSE:RELIANCE
NSE:HDFC

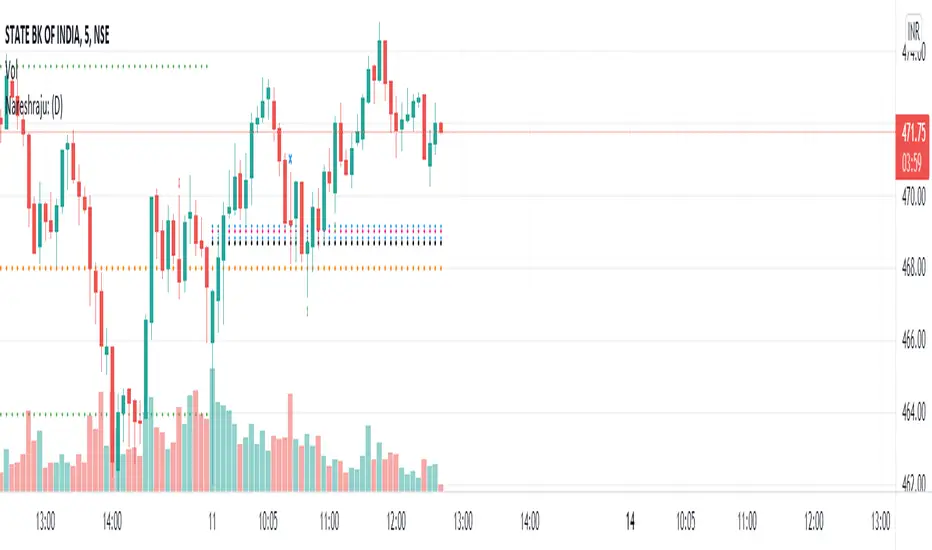
Nareshraju CPRHi friends this is Cpr indicator which means central pivot range. it contains supports and resistances to take perfect entry.
Nifty / Banknifty Dashboard by RiTzNifty / Banknifty Dashboard :
Shows Values of different Indicators on current Timeframe for the selected Index & it's main constituents according to weightage in index.
customized for Nifty & Banknifty (You can customize it according to your needs for the markets/indexes you trade in)
Interpretation :-
VWAP : if LTP is trading above VWAP then Bullish else if LTP is trading below VWAP then Bearish.
ST(21,1) : if LTP is trading above Supertrend (21,1) then Bullish , else if LTP is trading below Supertrend (21,1) then Bearish.
ST(14,2) : if LTP is trading above Supertrend (14,2) then Bullish , else if LTP is trading below Supertrend (14,2) then Bearish.
ST(10,3) : if LTP is trading above Supertrend (10,3) then Bullish , else if LTP is trading below Supertrend (10,3) then Bearish.
RSI(14) : Shows value of RSI (14) for the current timeframe.
ADX : if ADX is > 75 and DI+ > DI- then "Bullish ++".
if ADX is < 75 but >50 and DI+ > DI- then "Bullish +".
if ADX is < 50 but > 25 and DI+ > DI- then "Bullish".
if ADX is above 75 and DI- > DI+ then "Bearish ++".
if ADX is < 75 but > 50 and DI- > DI+ then "Bearish+".
if ADX is < 50 but > 25 and DI- > DI+ then "Bearish".
if ADX is < 25 then "Neutral".
MACD : if MACD line is above Signal Line then "Bullish", else if MACD line is below Signal Line then "Bearish".
PDH-PDL : "< PDH > PDL" means LTP is trading between Previous Days High(PDH) & Previous Days Low(PDL) which indicates Rangebound-ness.
"> PDH" means LTP is trading above Previous Days High(PDH) which indicates Bullish-ness.
"< PDL" means LTP is trading below Previous Days Low(PDL) which indicates Bearish-ness.
Alligator : If Lips > Teeth > Jaw then Bullish.
If Lips < Teeth < Jaw then Bearish.
If Lips > Teeth and Teeth < Jaw then Neutral/Sleeping.
If Lips < Teeth and Teeth > Jaw then Neutral/Sleeping.
Settings :
Style settings :-
Dashboard Location: Location of the dashboard on the chart
Dashboard Size: Size of the dashboard on the chart
Bullish Cell Color: Select the color of cell whose value is showing Bullish-ness.
Bearish Cell Color: Select the color of cell whose value is showing Bearish-ness.
Neutral Cell Color: Select the color of cell whose value is showing Rangebound-ness.
Cell Transparency: Select Transparency of cell.
Columns Settings :-
You can select which Indicators values should be displayed/hidden.
Rows Settings :-
You can select which Stocks/Symbols values should be displayed/hidden.
Symbol Settings :-
Here you can select the Index & Stocks/Symbols
Dashboard for Index : select Nifty/Banknifty
if you select Nifty then Nifty spot, Nifty current Futures and the stocks with most weightage in Nifty index will be displayed on the Dashboard/Table.
if you select Banknifty then Banknifty spot, Banknifty current Futures and the stocks with most weightage in Banknifty index will be displayed on the Dashboard/Table.
You can Customise it according to your needs, you can choose any Symbols you want to use.
Note :- This is inspired from "RankDelta" by AsitPati and "Nifty and Bank Nifty Dashboard v2" by cvsk123 (Both these scripts are closed source!)
I'm not a pro Developer/Coder , so if there are any mistakes or any suggestions for improvements in the code then do let me know!

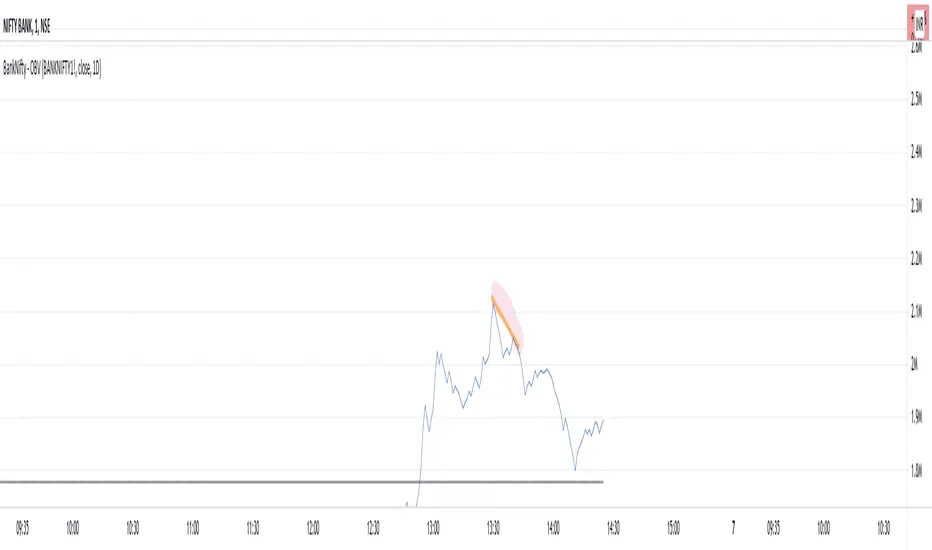
BankNifty - OBVThis script tries to draw OBV for BankNifty using Futures Volume along with Average OBV. For Nifty50 just change the Futures Volume symbol in settings. Look at devations in Price vs OBV or Average OBV breakout.
NSE:NIFTY
NSE:BANKNIFTY
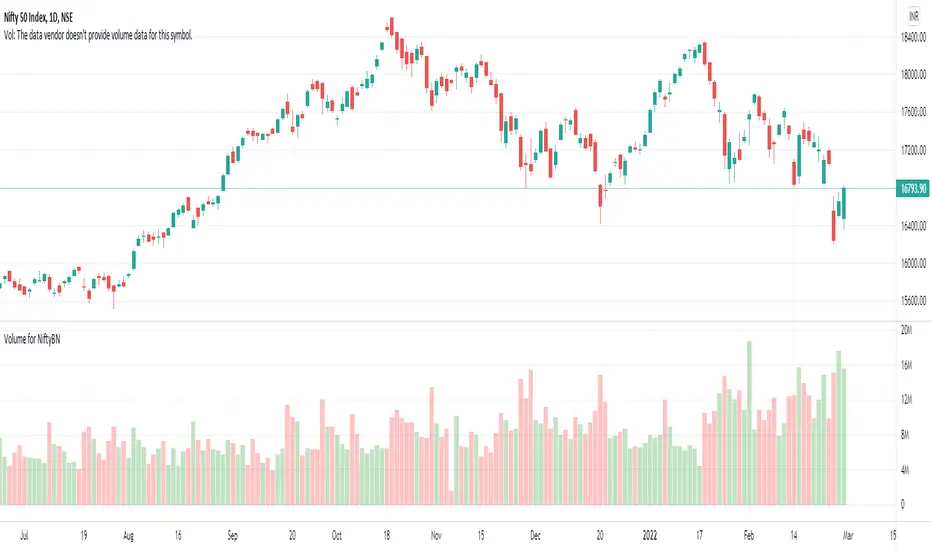
Volume for NiftyBNTo see the volume of Nifty and Banknifty indices we often refer to their Futures chart. With the help of this script, you can directly plot the volume of Nifty Futures over the Nifty chart and Bank Nifty Futures over the Bank Nifty chart.
If the scrip entered is other than Nifty or Bank Nifty it will plot the default volume of that scrip.
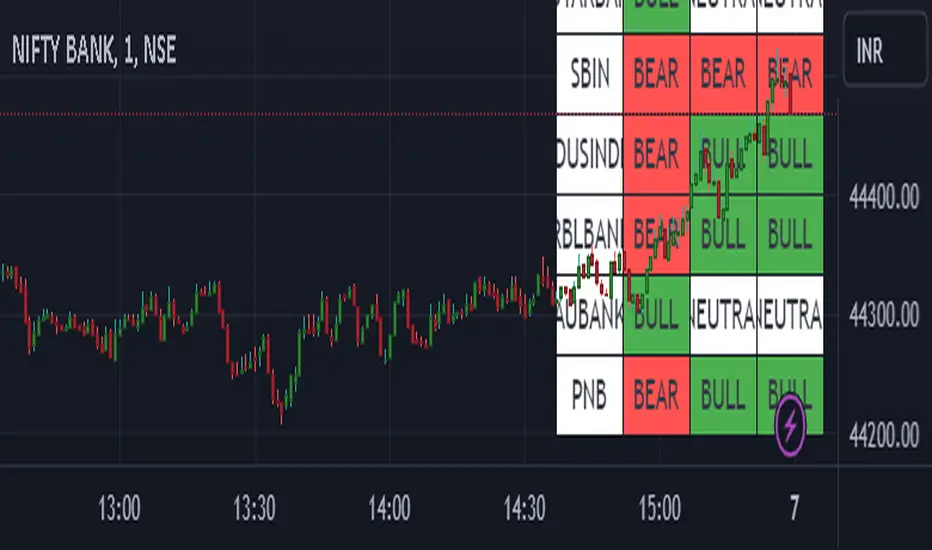
BANK NIFTY Constituents Technical Rating [tanayroy]Banknifty comprises 12 companies listed on the National Stock Exchange of India (NSE). Movement of Banknifty depends on these stocks. The script depicts Technical rating and price change stats of Banknifty constituents.
I have calculated the weight factor using annual floating stock stats available in Tradingview. So, it may differ considerably from the actual weight. It is just for reference.
I have found this useful in my trading.
Please like, share, and comment.

Bank Nifty ParticipantsBankNifty Index is calculated based on the movements of its participants. Every time you think of why is Index going up/down, who is actively dragging the index either ways, this Indicator gives you the answer for the same in realtime!
For example : You see HDFCBank and Kotak Bank significantly up while all other banks going down but index reacting in a bullish mode, the answer lies in which Bank is contributing how much to the index! This will help you in pre-planning your trades based on the movements shown by different banks in Index calculation. Or on the other hand, you see HDFCBank on verge of breakout and you have target of 10 points, this indicator will help you in identifying how much the index will react to the 10 points movement shown by HDFC Bank which is the leading participant in Bank Nifty.
RSI column is an add-on to the participation table which will help you in getting RSI values of different banks at a glance. You will see values getting updated in realtime in live market. Checkout for customisations in indicator settings.
Note : Participants present in this indicator and their participation percentage is taken from the official NSE website.
Feel free to contribute/comment changes if any!
- Published by Soham Dixit

Bank Nifty strike price 2/3σ Calculates the strike prices for the Bank Nifty index in steps of 50 and marks the 2 and 3 sigma price levels.

BANKNIFTY list of stocks RSI trend on multi time frame This script gives you an overview of banknifty and its underlying heavy weight stocks based on RSI
You can view the trend in single chart in 3 different time frames.
Color indication green for bullish and red for bearish trend and white for neutral
Symbol name shows green if the current day change is positive. Else red color
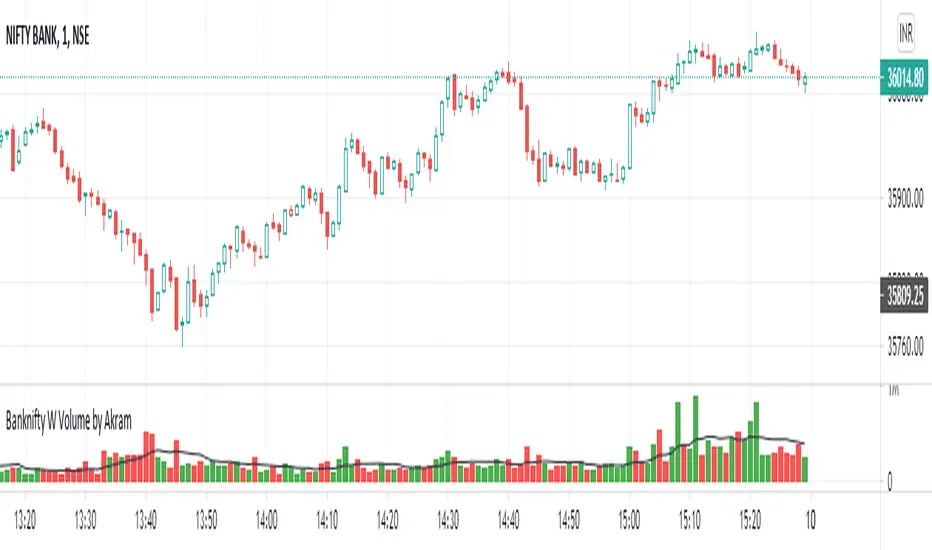
Banknifty Weighted volume by AkramulBanknifty Weighted volume as per share ratio.
HDFC Bank – 27.56%
ICICI Bank – 22.91%
State Bank of India (SBI) – 12.42%
Kotak Mahindra Bank – 11.77%
Axis Bank – 11.49%
IndusInd Bank – 5.20%
AU Small Finance Bank Ltd. – 2.35%
Bandhan Bank – 1.73%
Federal Bank – 1.53%
IDFC First Bank Ltd. – 1.22%
Punjab National Bank (PNB)- 1.03%
RBL Bank – 0.79%
and moving average plotted on volume
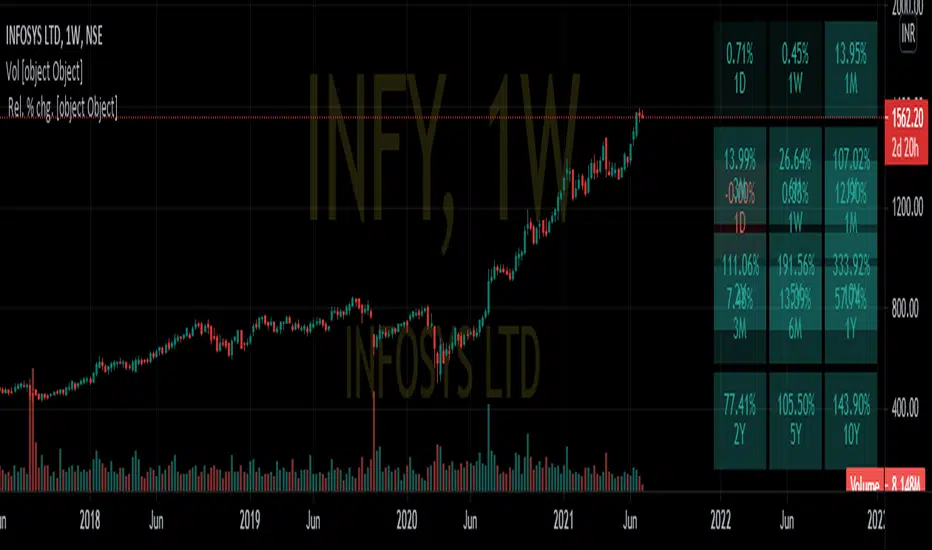
Nifty Relative PerformanceDISCRIPTION:-
This indicator is used to determine relative performance of a stock based on different time intervals as well as compared to benchmark indices as Nifty 50,Nift IT, Nifty auto etc.
USE CASE SCENARIO:-
The top right table provide performance of stock based on different interval
while the bottom table depicts its relative performance compared to an index
eg:-
INFY compared to Nifty 50
&
INFY compared to Nifty IT
DISCLAIMER:-
if using an android device kindly toggle full-screen mode and view it horizontally
In desktop full screen mode may provide better comprehensive view
BankNifty - VWAP + StdDev Bands- By Default the script draws Daily VWAP for Bank Nifty based on Futures Volume or underlying Index Stocks based on user input
- Optionally one may Anchor it to Week/Month etc or anchor it from a particular Time.
- It also draws 3 Standard Deviation Bands from the VWAP based on User Input.
- Optionally draws Previous VWAP Close for and Bullish or Bearish Move.
- It works with NIFTY 50 as well but only using Futures Volume(Pine limitation to number of security calls) . Please change the Symbol and Futures Volume symbol to "NSE:NIFTY" and "NSE:NIFTY1!" NSE:BANKNIFTY NSE:NIFTY
