[blackcat] L1 Dynamic Momentum Indicator
**1. Overview**
" L1 Dynamic Momentum Indicator" is a custom TradingView indicator designed to analyze price momentum and market trends. It combines the calculation methods of Stoch (RSV) and Moving Average (SMA) to provide market overbought and oversold signals.
**2. Calculation Method**
- **RSV Value Calculation**: The RSV value is calculated using the relative relationship between the current price and the lowest and highest prices over the past 89 periods.
- **K Value Calculation**: The calculated RSV value is subjected to a 3-period Simple Moving Average (SMA) to obtain the K value.
- **D Value Calculation**: The K value is subjected to a 3-period Simple Moving Average (SMA) to obtain the D value.
- **Momentum Difference Calculation**: The difference between the 13-period Exponential Moving Average (EMA) and the 34-period EMA of closing prices is calculated, and then the moving average of this difference is calculated.
**3. Indicator Display**
- **K and D Lines**: The moving averages of the K value and D value are displayed on the chart, indicating a strong market condition when the K line is above the D line, and a weak market condition when the K line is below the D line.
- **Threshold Line**: A fixed threshold line of 50 is displayed to distinguish the overbought and oversold areas.
- **Green and Red Bars**: Green and red bars are drawn on the chart based on the relationship between the momentum difference and the average value, indicating the market trend.
**4. Usage Suggestions**
- When the market is in a strong condition, a potential reversal may occur in the overbought area after selling. When the market is in a weak condition, a potential bounce may occur in the oversold area after buying.
- Pay attention to the changes in market trends, with the appearance of green bars may indicate that the market is about to rise, and the appearance of red bars may indicate that the market is about to fall.
**5. Caution**
- The indicator is based on the provided code and may require adjustments based on market conditions.
- The accuracy of the indicator depends on the selection of calculation parameters and the reliability of market data.
Blackcat1402

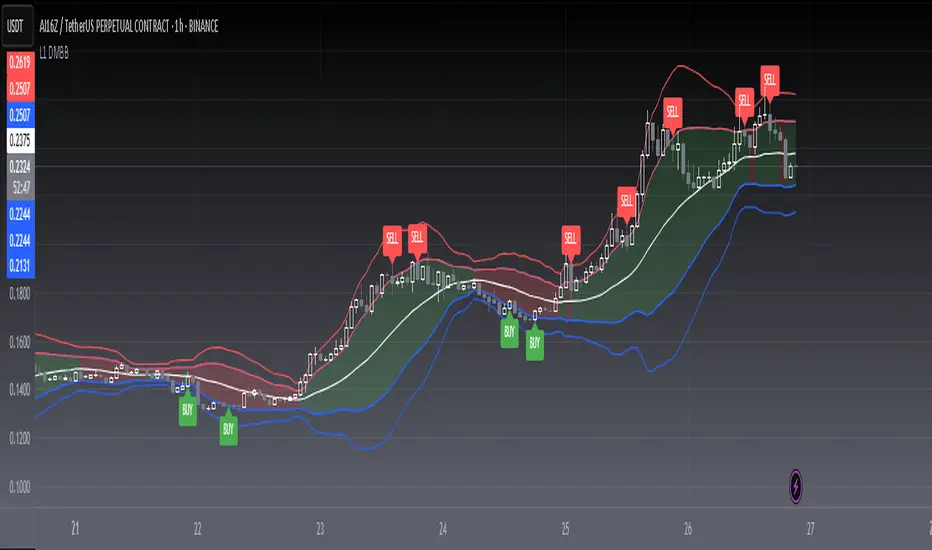
[blackcat] L1 Dynamic Multi-Layer Bollinger Bands## Overview
The L1 Dynamic Multi-Layer Bollinger Bands script is a custom indicator designed to provide a comprehensive analysis of price movements using Bollinger Bands, a widely-used technical analysis tool. The Bollinger Bands consist of a middle band being a simple moving average (SMA) of the close price, and an upper and lower band that are respectively 1.382 and 2.56 times the standard deviation of the close price over a 21-day period.
## How to Use
1. **Add the Indicator to Your Chart**: Click on the "Add to Chart" button in the Pine-Script editor. This will add the L1 Dynamic Multi-Layer Bollinger Bands to your chart.
2. **Interpreting the Bands**: The Bollinger Bands are plotted on your chart. The middle band is the 21-day SMA of the close price. The upper band is 1.382 times the standard deviation above the middle band, and the lower band is 1.382 times the standard deviation below the middle band.
3. **Analyzing the Bands**: When the price moves above the upper band, it is considered an overbought condition. When the price moves below the lower band, it is considered an oversold condition. These are potential areas of support and resistance.
4. **Multi-Layer Structure**: The script also calculates two additional bands, `up2` and `loow2`, which are respectively 2.56 times the standard deviation above and below the middle band. These bands provide a more layered perspective on the volatility of the price.
5. **Color Coding**: The area between the upper and lower bands is filled with a color that indicates the direction of the price movement. Green indicates an upward trend, and red indicates a downward trend.
## Disclaimer
The information provided by this script is for educational purposes only and should not be used as the sole basis for any trading decisions. Trading involves risk, and it is possible to lose money when trading stocks and other financial instruments. Use this script at your own risk.
[blackcat] L1 Zero-Lag EMA BandThe Zero-Lag EMA Band is a sophisticated technical analysis tool designed to provide traders with a comprehensive view of market trends. This innovative indicator merges the Zero-Lag EMA, a derivative of the traditional Exponential Moving Average, with Bollinger Bands to create a unique trend indicator that is less laggy and more responsive to market changes.
The Zero-Lag EMA Band is calculated by taking the standard deviation of the price data and adding or subtracting it from the Zero-Lag EMA to create an upper band and a lower band. This process results in a trend band that can help traders identify potential support and resistance levels, providing them with a more accurate assessment of the market's behavior.
The Zero-Lag EMA Band is particularly useful for traders who need to react quickly to market changes. It offers a more timely assessment of potential trend reversals, allowing traders to capitalize on market opportunities and mitigate risk.
The indicator's design is based on the principle of Zero-Lag, which aims to reduce the lag associated with traditional EMAs. This feature makes the Zero-Lag EMA Band a powerful tool for traders who want to stay ahead of the market and make more informed decisions.
In summary, the Zero-Lag EMA Band is a comprehensive and responsive tool for traders looking to identify and capitalize on market trends. It is a valuable addition to any trader's toolkit, offering a more accurate and timely assessment of potential trend reversals and providing a more comprehensive view of the market's behavior.
Certainly! Let's go through the Pine Script code line by line to understand its functionality:
//@version=5
This line specifies the version of Pine Script being used. In this case, it's version 5.
indicator(' L1 Zero-Lag EMA Band', shorttitle='L1 ZLEMA Band', overlay=true)
This line defines the indicator with a title and a short title. The `overlay=true` parameter means that the indicator will be plotted on top of the price data.
length = input.int(21, minval=1, title='Length')
This line creates an input field for the user to specify the length of the EMA. The default value is 21, and the minimum value is 1.
mult = input(1, title='Multiplier')
This line creates an input field for the user to specify the multiplier for the standard deviation, which is used to calculate the bands around the EMA. The default value is 1.
src = input.source(close, title="Source")
This line creates an input field for the user to specify the data source for the EMA calculation. The default value is the closing price of the asset.
// Define the smoothing factor (alpha) for the EMA
alpha = 2 / (length + 1)
This line calculates the smoothing factor alpha for the EMA. It's a common formula for EMA calculation.
// Initialize a variable to store the previous EMA value
var float prevEMA = na
This line initializes a variable to store the previous EMA value. It's initialized as `na` (not a number), which means it's not yet initialized.
// Calculate the zero-lag EMA
emaValue = na(prevEMA) ? ta.sma(src, length) : (src - prevEMA) * alpha + prevEMA
This line calculates the zero-lag EMA. If `prevEMA` is not a number (which means it's the first calculation), it uses the simple moving average (SMA) as the initial EMA. Otherwise, it uses the standard EMA formula.
// Update the previous EMA value
prevEMA := emaValue
This line updates the `prevEMA` variable with the newly calculated EMA value. The `:=` operator is used to update the variable in Pine Script.
// Calculate the upper and lower bands
dev = mult * ta.stdev(src, length)
upperBand = emaValue + dev
lowerBand = emaValue - dev
These lines calculate the upper and lower bands around the EMA. The bands are calculated by adding and subtracting the product of the multiplier and the standard deviation of the source data over the specified length.
// Plot the bands
p0 = plot(emaValue, color=color.new(color.yellow, 0))
p1 = plot(upperBand, color=color.new(color.yellow, 0))
p2 = plot(lowerBand, color=color.new(color.yellow, 0))
fill(p1, p2, color=color.new(color.fuchsia, 80))
These lines plot the EMA value, upper band, and lower band on the chart. The `fill` function is used to color the area between the upper and lower bands. The `color.new` function is used to create a new color with a specified alpha value (transparency).
In summary, this script creates an indicator that displays the zero-lag EMA and its bands on a trading chart. The user can specify the length of the EMA and the multiplier for the standard deviation. The bands are used to identify potential support and resistance levels for the asset's price.
In the context of the provided Pine Script code, `prevEMA` is a variable used to store the previous value of the Exponential Moving Average (EMA). The EMA is a type of moving average that places a greater weight on the most recent data points. Unlike a simple moving average (SMA), which is an equal-weighted average, the EMA gives more weight to the most recent data points, which can help to smooth out short-term price fluctuations and highlight the long-term trend.
The `prevEMA` variable is used to calculate the current EMA value. When the script runs for the first time, `prevEMA` will be `na` (not a number), indicating that there is no previous EMA value to use in the calculation. In such cases, the script falls back to using the simple moving average (SMA) as the initial EMA value.
Here's a breakdown of the role of `prevEMA`:
1. **Initialization**: On the first bar, `prevEMA` is `na`, so the script uses the SMA of the close price over the specified period as the initial EMA value.
2. **Calculation**: On subsequent bars, `prevEMA` holds the value of the EMA from the previous bar. This value is used in the EMA calculation to give more weight to the most recent data points.
3. **Update**: After calculating the current EMA value, `prevEMA` is updated with the new EMA value so it can be used in the next bar's calculation.
The purpose of `prevEMA` is to maintain the state of the EMA across different bars, ensuring that the EMA calculation is not reset to the SMA on each new bar. This is crucial for the EMA to function properly and to avoid the "lag" that can sometimes be associated with moving averages, especially when the length of the moving average is short.
In the provided script, `prevEMA` is used to simulate a zero-lag EMA, but as mentioned earlier, there is no such thing as a zero-lag EMA in the traditional sense. The EMA already has a very minimal lag due to its recursive nature, and any attempt to reduce the lag further would likely not be accurate or reliable for trading purposes.
Please note that the script provided is a conceptual example and may not be suitable for actual trading without further testing and validation.

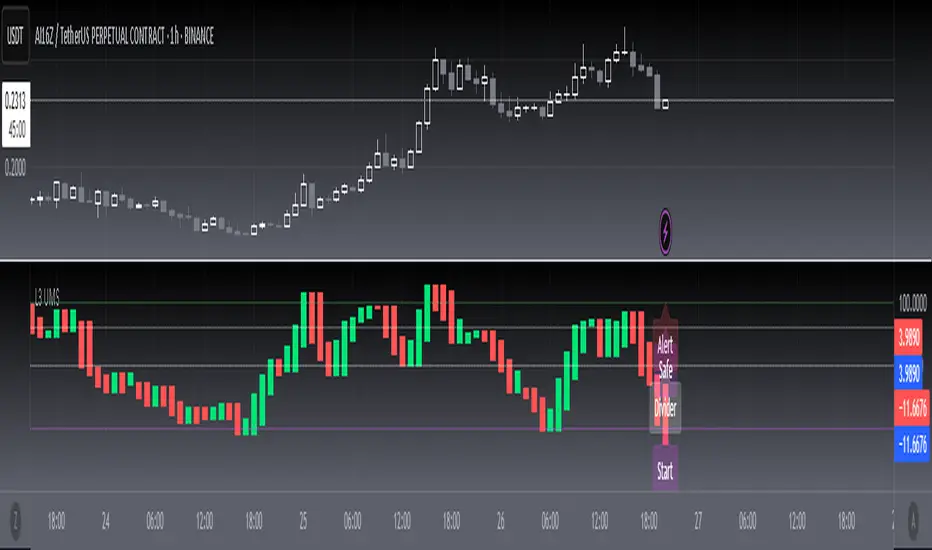
[blackcat] L3 Ultimate Market Sentinel (UMS)Script Introduction
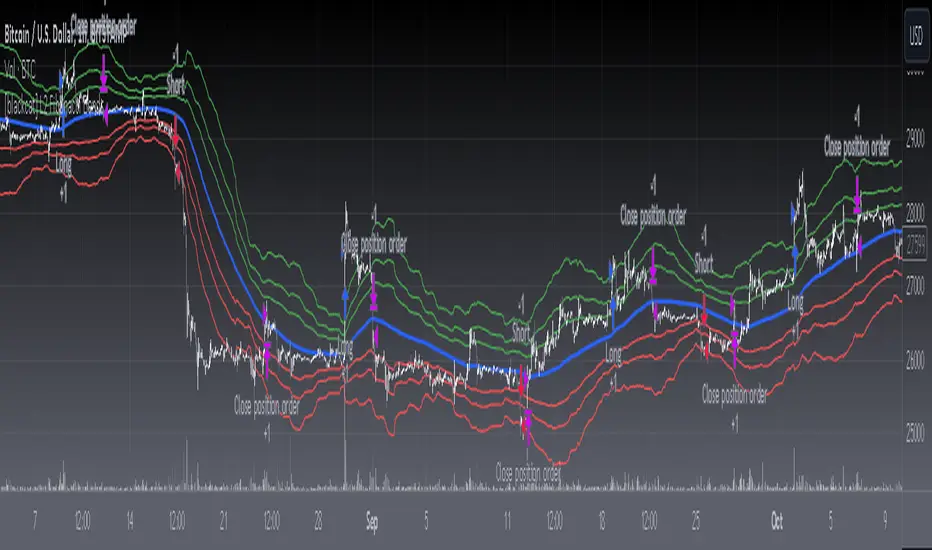
The L3 Ultimate Market Sentinel (UMS) is a technical indicator specifically designed to capture market turning points. This indicator incorporates the principles of the Stochastic Oscillator and provides a clear view of market dynamics through four key boundary lines — the Alert Line, Start Line, Safe Line, and Divider Line. The UMS indicator not only focuses on the absolute movement of prices but also visually displays subtle changes in market sentiment through color changes (green for rise, red for fall), helping traders quickly identify potential buy and sell opportunities.
In the above image, you can see how the UMS indicator labels different market conditions on the chart. Green candlestick charts indicate price increases, while red candlestick charts indicate price decreases. The Alert Line (Alert Line) is typically set at a higher level to warn of potential overheating in the market; the Start Line (Start Line) is in the middle, marking the beginning of market momentum; the Safe Line (Safe Line) is at a lower level, indicating a potential oversold state in the market; the Divider Line (Divider Line) helps traders identify whether the market is in an overbought or oversold area.
Script Usage
1. **Identifying Turning Points**: Traders should pay close attention to the Alert Line and Safe Line in the UMS indicator. When the indicator approaches or touches the Alert Line, it may signal an imminent market reversal; when the indicator touches the Safe Line, it may indicate that the market is oversold and there is a chance for a rebound.
2. **Color Changes**: By observing the color changes in the histogram, traders can quickly judge market trends. The transition from green to red may indicate a weakening of upward momentum, while the shift from red to green could suggest a slowdown in downward momentum.
3. **Trading Strategy**: The UMS indicator is suitable for a variety of trading timeframes, ranging from 1 minute to 1 hour. Short-term traders can use the UMS indicator to capture rapid market fluctuations, while medium-term traders can combine it with other analytical tools to confirm the sustainability of trends.
Advantages and Limitations of the Indicator
**Advantages**:
- Intuitive color coding that is easy to understand and use.
- Multiple boundary lines provide comprehensive market analysis.
- Suitable for a variety of trading timeframes, offering high flexibility.
**Limitations**:
- As a single indicator, it may not cover all market dynamics.
- For novice traders, it may be necessary to use the UMS indicator in conjunction with other indicators to improve accuracy.
- The indicator may lag in extreme market conditions.
Special Note
The L3 Ultimate Market Sentinel (UMS) indicator is a powerful analytical tool, but it is not omnipotent. The market has its inherent risks and uncertainties, so it is recommended that traders use the UMS indicator in conjunction with their own trading strategies and risk management rules. Additionally, it is always recommended to fully test and verify any indicator in a simulated environment before actual application.
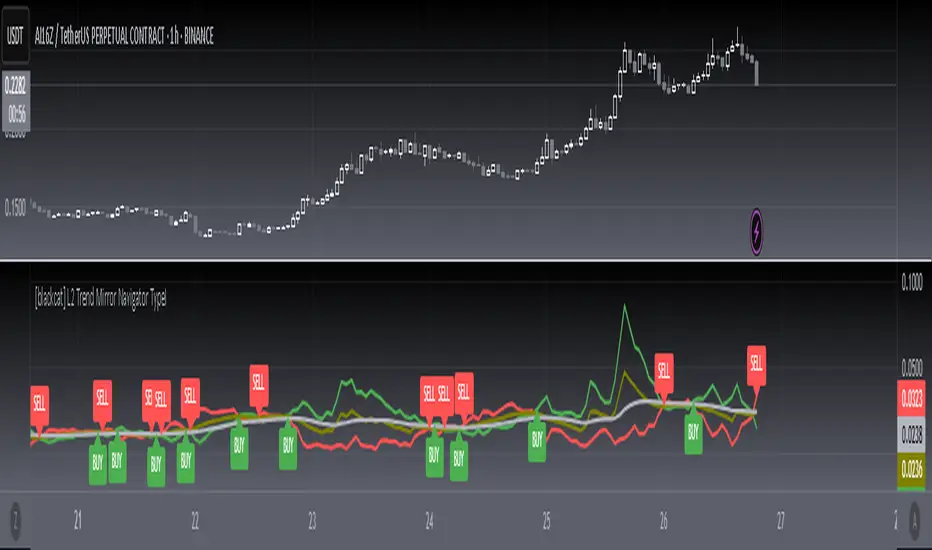
[blackcat] L2 Trend Mirror Navigator TypeIIn this unpredictable world of trading, the L2 Trend Mirror Navigator TypeI is like a magical mirror, reflecting the market's pulse and potential turning points. This indicator is not just a game of numbers; it's a visual feast that reveals the market's deep secrets through five colorful lines (mb1, mb2, mb3, mb4, mb5). Imagine these lines as five lively little snakes, dancing on the chart, intertwining and separating at times, with each crossing potentially signaling a shift in market sentiment.
The calculation process of this indicator is like cooking a complex dish, requiring precise ingredients and火候 (heat control). First, we take the average of the high, low, and close prices, which serves as our "basic soup base." Then, we add the secret ingredient of Exponential Moving Average (EMA) to smooth out the price data, like adding a layer of delicate cream to the soup base. Next, through a series of complex calculations, we obtain five lines, each like a different dish with its own flavor, but together they form a bountiful trading feast.
In practical application, this indicator acts as your trading assistant, telling you the market's dynamics through lines of different colors. When the red line (mb2) is above the green line (mb3), it's like saying, "Hey, the market is rising!" Conversely, it warns you, "Be careful, the market might be falling." You can adjust the sensitivity of this indicator based on the length of the EMA period, just like adjusting the spiciness of a dish to suit your taste.
Now, let's explore how to combine this indicator with others to enhance the reliability of trading signals. Imagine you're observing a stock or currency pair, looking for the best time to buy or sell. You can combine the L2 Trend Mirror Navigator TypeI with Moving Averages (MA) or Average Directional Index (ADX), just like adding some herbs and spices to a dish to enrich the flavor. When the RSI indicator shows the market may be oversold, it's like telling you, "Now might be a good time to buy." And price behavior analysis serves as a reminder, "Watch out, the market might be forming a certain chart pattern."
Finally, don't forget the key factor of volume. It's like the salt in a dish; without it, everything becomes bland. Analyzing the signals of the L2 Trend Mirror Navigator across different time frames is like admiring a painting under different lights, each angle revealing a different beauty.
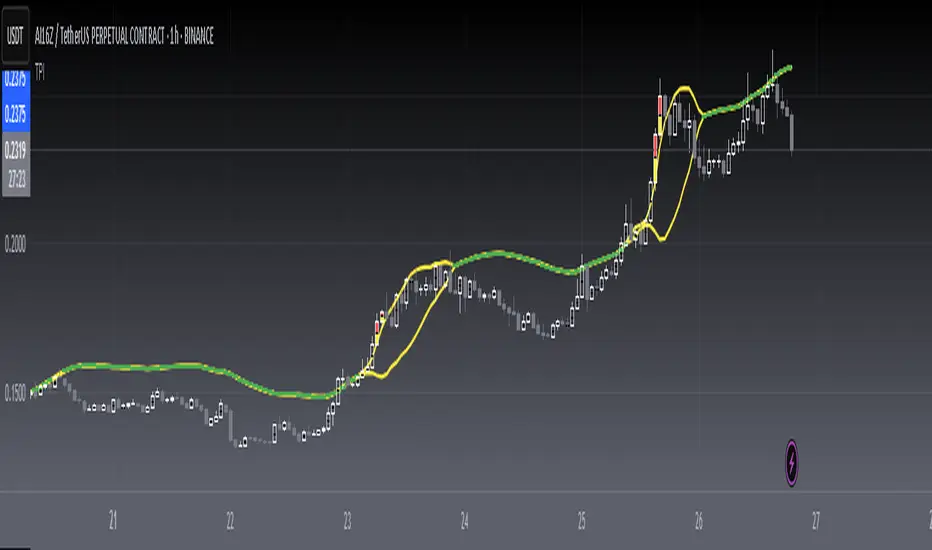
[blackcat] L1 Fibonacci MA BandThe true charm of the Fibonacci moving average band lies not only in its predictive ability. Its essence is that it combines the beauty of mathematics with the practicality of market analysis, providing traders with a powerful tool to optimize trading strategies. It's not a simple number game, but a wisdom that sees into the deeper structure of the market.
Next, we will delve into the core technical indicators of the Fibonacci moving average band - WHALES, RESOLINE, STICKLINE functions, and TRENDLINE, as well as their clever applications. The WHALES indicator, with its 12-period exponential moving average, captures short-term market trends; the RESOLINE indicator, through the 120-period EMA, reveals mid-term market movements; the STICKLINE function, distinguishes the relationship between WHALES and RESOLINE with colors, providing clear visual aids; while TRENDLINE, combining price slope with EMA, depicts more detailed market changes for traders.
The integrated application of these indicators has built a multi-dimensional market analysis framework for traders. They help traders examine the market from different angles, judge the market status more accurately, and make wiser decisions in the ever-changing market environment. The Fibonacci moving average band indicator is like a lighthouse, emitting guiding light in the ocean of trader's navigation.
1. `xsl(src, len)` function: This function calculates a value called the linear regression slope. Len defines the length of the linear regression. Then, this function normalizes the difference between the current value of the linear regression and the previous value. The formula is `(lrc - lrprev) / timeframe.multiplier`.
2. `whales`, `resoline`, and `trendline` are Exponential Moving Averages (EMA) calculated in different ways. "whales" is the 13-period closing price EMA, "resoline" is the 144-period closing price EMA, and "trendline" is a more complicated EMA. It is the 50-period EMA calculated by the 21-period closing price slope multiplied by 23 plus the closing price.
3. The `plotcandle` function draws two sets of candlestick charts. One set shows in blue when "whales" is greater than "resoline", and the other set shows in green when "whales" is less than "resoline".
4. The `plot` function draws three lines: "whales", "resoline", and "trendline". "whales" is displayed in orange with a line thickness of 2. "resoline" is displayed in yellow with a line thickness of 1. "trendline" is displayed in red with a line thickness of 3.
5. The last line draws a conditional line. When the closing price is less than the "trendline", the green "trendline" is drawn, otherwise, it is not drawn. This is a logical judgment, the drawing operation is only executed when the condition is met.

[blackcat] L2 Twisted Pair IndicatorOn the grand stage of the financial market, every trader is looking for a partner who can lead them to dance the tango well. The "Twisted Pair" indicator is that partner who dances gracefully in the market fluctuations. It weaves the rhythm of the market with two lines, helping traders to find the rhythm in the market's dance floor.
Imagine when the market is as calm as water, the "Twisted Pair" is like two ribbons tightly intertwined. They almost overlap on the chart, as if whispering: "Now, let's enjoy these quiet dance steps." This is the market consolidation period, the price fluctuation is not significant, traders can relax and slowly savor every detail of the market.
Now, let's describe the market logic of this code in natural language:
- **HJ_1**: This is the foundation of the market dance steps, by calculating the average price and trading volume, setting the tone for the market rhythm.
- **HJ_2** and **HJ_3**: These two lines are the arms of the dance partner, they help traders identify the long-term trend of the market through smoothing.
- **HJ_4**: This is a magnifying glass for market sentiment, it reveals the tension and excitement of the market by calculating the short-term deviation of the price.
- **A7** and **A9**: These two lines are the guide to the dance steps, they separate when the market volatility increases, guiding the traders in the right direction.
- **WATCH**: This is the signal light of the dance, when the two lines overlap, the market is calm; when they separate, the market is active.
The "Twisted Pair" indicator is like a carefully choreographed dance, it allows traders to find their own rhythm in the market dance floor, whether in a calm slow dance or a passionate tango. Remember, the market is always changing, and the "Twisted Pair" is the perfect dance partner that can lead you to dance out brilliant steps.
The script of this "Twisted Pair" uses three different types of moving averages: EMA (Exponential Moving Average), DEMA (Double EMA), and TEMA (Triple EMA). These types can be selected by the user through exchange input.
Here are the main functions of this code:
1. Defined the DEMA and TEMA functions: These two functions are used to calculate the corresponding moving averages. EMA is the exponential moving average, which is a special type of moving average that gives more weight to recent data. In the first paragraph, ema1 is the EMA of "length", and ema2 is the EMA of ema1. DEMA is 2 times of ema1 minus ema2.
2. Let users choose to use EMA, DEMA or TEMA: This part of the code provides an option for users to choose which type of moving average they want to use.
3. Defined an algorithm called "Twisted Pair algorithm": This part of the code defines a complex algorithm to calculate a value called "HJ". This algorithm involves various complex calculations and applications of EMA, DEMA, TEMA.
4. Plotting charts: The following code is used to plot charts on Tradingview. It uses the plot function to draw lines, the plotcandle function to draw candle (K-line) charts, and yellow and red to represent different conditions.
5. Specify colors: The last two lines of code use yellow and red K-line charts to represent the conditions of HJ_7. If the conditions of HJ_7 are met, the color of the K-line chart will change to the corresponding color.
[blackcat] L3 Emotion Line**I. Overview**
The Emotion Line is an innovative technical indicator designed to capture market sentiment by analyzing price dynamics. This indicator calculates the average of opening, high, low, and closing prices over the past three days and combines the concepts of Dynamic Moving Average (DMA) and Exponential Moving Average (EMA) to generate a value reflecting market sentiment. The Emotion Line is implemented in Pine Script on the TradingView platform, providing users with an intuitive tool for market sentiment analysis.
**II. Calculation Method**
1. **Ray**: Calculate the average of the past three days' prices, i.e., (2 * C + H + L) / 4, where C represents the closing price, H the highest price, and L the lowest price. Then, take the Simple Moving Average (SMA) of this average over 3 days with a smoothing factor of 2.
2. **CL (Close Line)**: Assign the value of Ray to CL as the basis for subsequent calculations.
3. **DIR1 (Directional Change)**: Calculate the absolute difference between CL and the CL of the previous two days, indicating the magnitude of price movement.
4. **VIR1 (Volume in Range)**: Calculate the sum of the absolute differences between CL and the previous day's CL over the past two days, measuring the accumulation of price fluctuations.
5. **ER1 (Efficiency Ratio)**: The ratio of DIR1 to VIR1, measuring the efficiency of price movement.
6. **CS1 (Cumulative Strength)**: Apply a weighted process to ER1 to obtain CS1.
7. **CQ1 (Cumulative Quotient)**: The square of CS1, further strengthening the cumulative effect of price movement.
8. **AMA5 (Adjusted Moving Average)**: Calculate the Dynamic Moving Average (DMA) of CL with the dynamic factor CQ1, then apply a 2-day Exponential Moving Average (EMA) to the result.
9. **Cost**: Calculate the 7-day Simple Moving Average (SMA) of AMA5.
10. **CLX (Composite Line)**: Calculate the average of AMA5 and Cost to obtain CLX.
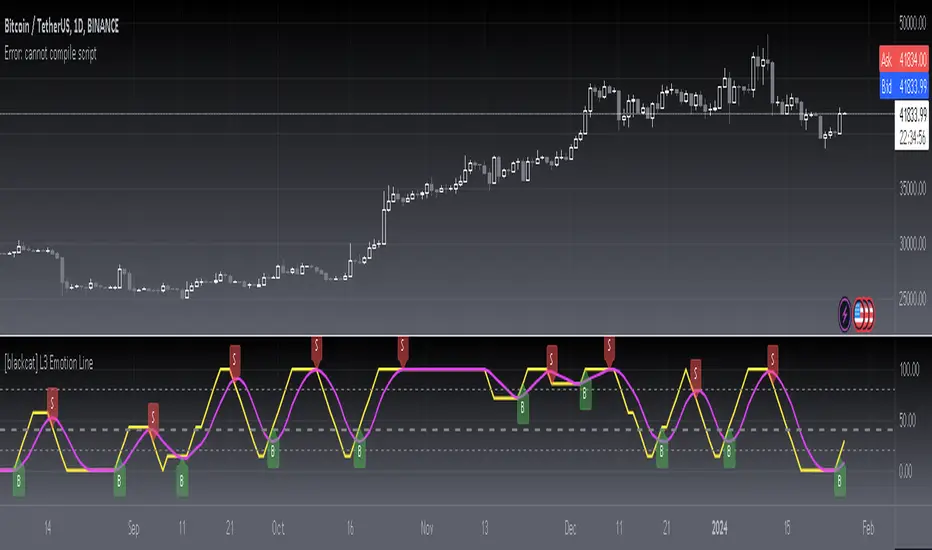
11. **Emotion Line**: Calculate the proportion of CLX increasing continuously for N days, with N defaulting to 7 days. Multiply the result by 100 to get the Emotion Line value.
12. **MA_emotionLine (Moving Average Emotion Line)**: Calculate the M-day moving average of the Emotion Line, with M defaulting to 6 days.
**III. Market Logic**
By analyzing the cumulative effect and efficiency of price movement, the Emotion Line attempts to reveal the strength of market sentiment. When the Emotion Line rises, it indicates a positive market sentiment, and investors may have an optimistic attitude towards the stock; a falling Emotion Line may signal a weakening market sentiment. The absolute value and trend changes of the Emotion Line can provide investors with references for buying, holding, or selling.
**IV. Usage**
1. **Attention Signal**: When the Emotion Line exceeds 20%, the market sentiment may begin to be positive, and investors should pay attention to related stocks.
2. **Entry Signal**: When the Emotion Line exceeds 40%, the market sentiment is relatively strong, and investors may consider entering the market.
3. **Reduce Position Signal**: When the Emotion Line exceeds 80%, the market may be overly optimistic, and investors should consider reducing their positions to avoid risk.
4. **Exit Signal**: When the Emotion Line breaks below its M-day moving average, it may signal a shift in market sentiment, and investors should consider exiting the market.
**V. Notes**
- The Emotion Line is an auxiliary tool, and investors should make comprehensive judgments based on other technical analysis and fundamental analysis.
- Market sentiment is influenced by various factors, and the Emotion Line may have lag, so investors should use it cautiously.
- Investors should adjust the parameters of the Emotion Line according to their risk tolerance and investment strategy.
**VI. Conclusion**
The Emotion Line is an intuitive indicator that reflects market sentiment through quantitative methods, providing a new perspective for investors to observe market dynamics. However, no technical indicator is foolproof, and investors should remain cautious when using it, combining their personal experience and market conditions to make decisions. Through the TradingView platform, investors can easily add the Emotion Line indicator to their charts to assist in their trading decision-making process.
[blackcat] L1 Bullish Trend Indicator
#### Introduction
The " L1 Bullish Trend Indicator" is a unique tool designed for TradingView, tailored to identify and analyze bullish trends in the market. This guide provides an overview of its definition, history, calculation method, operations, and practical trading applications, tailored for both beginners and experienced traders.
#### Definition
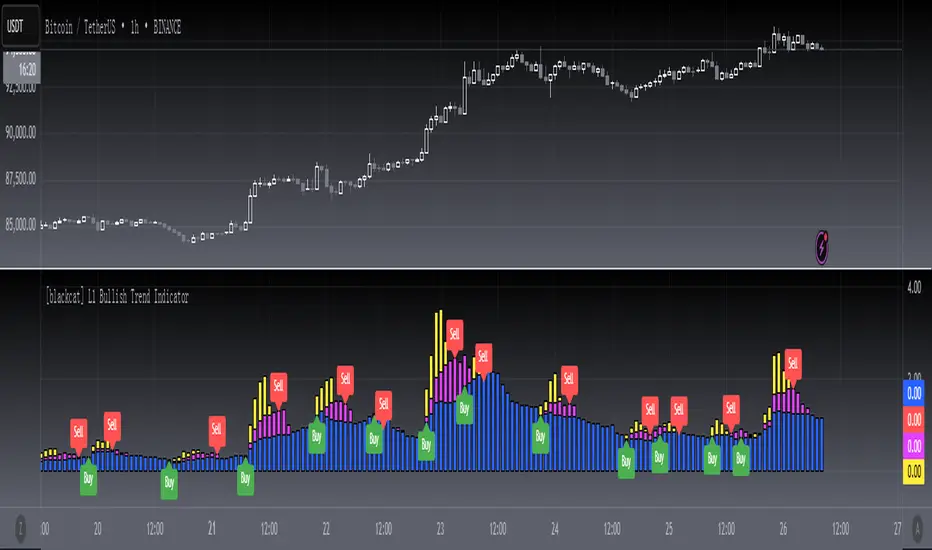
- **Role in Technical Analysis**: Primarily identifies bullish trends by analyzing a combination of price and volume data.
- **Type of Indicator**: Classified as a trend indicator, it operates on multiple time frames, offering a comprehensive view of market momentum.
#### Calculation Method
- **Core Calculation**: Combines price action (hlc3 formula) and volume, calculating a series of Simple Moving Averages (SMAs) on this modified factor.
- **Timeframes**: Incorporates short, mid, and long-term analysis through specific length parameters like `len_shortterm1`, `len_midterm`, and `len_longterm`.
- **Output Interpretation**: Proportions calculated from SMAs indicate the relative strength of trends across different timeframes.
#### Basic Operations
- **Comparison with Similar Indicators**: Similar to SMAs and MACD but provides a more detailed multi-timeframe trend analysis.
- **Unique Features**: The multi-timeframe approach and price-volume factor analysis distinguish it from other trend indicators.
- **Practical Example**: A dominant long-term trend (blue candle) might suggest a more stable bullish trend compared to a short-term spike.
#### Style Settings
- **Visual Representation**: Utilizes `plotcandle` functions with specific colors for different trend conditions, enhancing the visual clarity.
- **Color Coding**: Yellow for short-term trends, fuchsia for skyrocket trends, red for mid-term, and blue for long-term trends.
#### Trading Applications
- **Identifying Trends**: Effective in signaling the start and strength of bullish trends in various markets.
- **Combination with Other Tools**: Can be used alongside tools like RSI or MACD for reinforced trading decisions.
#### Conclusion
The " L1 Bullish Trend Indicator" is a powerful tool for traders looking to understand and capitalize on bullish market trends. Its unique combination of price and volume analysis, along with multi-timeframe integration, makes it a valuable addition to any trader's toolkit. Whether you're a beginner or a seasoned trader, this indicator offers insights that can help refine your market analysis and trading strategies.
[blackcat] L2 Double EMA Convergence and Diverence (DEMACD)Introduction:
The " L2 Double EMA Convergence and Divergence (DEMACD)" is a custom technical indicator designed for use in TradingView. It's based on the concept of Double Exponential Moving Averages (DEMA) and incorporates elements from the well-known Moving Average Convergence Divergence (MACD). This guide aims to provide an understanding of its definition, history, calculation, operations, usage, input settings, and style.
1. Definition:
The DEMACD indicator is designed to detect changes in price trends using a modified approach of the traditional MACD, with a focus on reducing lag. It does this by comparing two DEMAs of different lengths, providing traders with signals of converging and diverging trends.
2. History:
The concept of DEMA was introduced by Patrick Mulloy in 1994 to reduce the lag inherent in traditional EMAs. MACD, developed by Gerald Appel in the 1970s, is a trend-following momentum indicator that shows the relationship between two moving averages of a security's price. The DEMACD combines the quick response feature of DEMA with the reliable trend analysis of MACD.
3. Calculation Method:
DEMACD is calculated through several steps:
Smoothed price S is first computed as (3 * close + high + low + open) / 6.
DAYLINE is calculated as 2 * EMA(S, len_ema) - EMA(EMA(S, 5), len_ema).
The mainTrendLine is the EMA of the EMA of the closing price over len_dema periods.
DIF is the difference between the DAYLINE and mainTrendLine.
DEA is the EMA of DIF over len_smooth periods.
Finally, DEMACD is calculated as (DIF - DEA) * 2.
4. Basic Operations and Comparison with MACD:
DEMACD's key feature is its reduced lag compared to the traditional MACD. While MACD uses EMA, DEMACD uses DEMA, providing a faster and more accurate response to price changes. This makes it particularly useful in volatile market conditions where traditional MACD may lag.
5. Usage:
Similar to MACD, DEMACD is used for trend confirmation, crossover signals, and divergences:
Trend confirmation is observed when the DIF line is above or below the DEA line.
Crossover signals are generated when the DIF line crosses the DEA line.
Divergences between the DEMACD and price action can signal potential trend reversals.
6. Input Settings:
Users can configure the following settings in TradingView:
len_ema: Length of the EMA for DAYLINE.
len_dema: Length of the EMA for the main trend line.
len_smooth: Smoothing length for DEA.
Adjusting these settings allows traders to tailor the indicator to different trading styles and market conditions.
7. Style:
The DEMACD in TradingView is represented with different colors and line thicknesses:
DIF is plotted in red with a line thickness of 2.
DEA is plotted in gray, also with a line thickness of 2.
DEMACD histogram changes color based on its value relative to its previous value and zero.
Conclusion:
The " L2 Double EMA Convergence and Divergence (DEMACD)" is a versatile indicator that combines the rapid response of DEMA with the trend-following abilities of MACD. Its reduced lag makes it a valuable tool for traders looking for timely market signals. Proper understanding and application of its settings can enhance its effectiveness in various trading strategies.

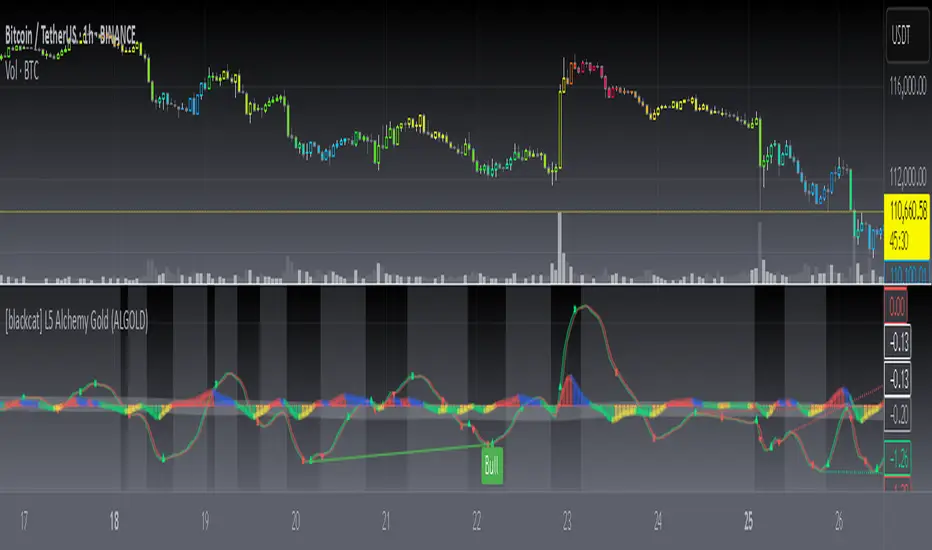
[blackcat] L5 Alchemy Gold (ALGOLD)" L5 Alchemy Gold (ALGOLD)" indicator is a trend-following indicator that blends volume and price data to create a MACD-like oscillator, aiming to address the lagging issue typical in price-only indicators. The integration of leading volume information with lagging price data is a smart approach to create more timely signals. Additionally, incorporating a volatility filter to reduce false signals during sideways markets is a thoughtful enhancement.
It is shaping up to be quite comprehensive. It includes:
- An adaptive filter for smoothing price and volume data.
- A volatility filter based on Average True Range (ATR).
- A trigger moving average for generating smoothed price information.
- An ALMA (Arnaud Legoux Moving Average) for further filtering of price and volume.
- A divergence detector to identify potential trend reversals.
Entry Criteria : A composite crossover and crossunder of the fast and slow lines of the ALGOLD oscillator.
Exit Criteria : A crossover and crossunder of the fast and slow lines of the ALGOLD oscillator, but using a lower time frame for more sensitivity.
The input parameters of " L5 Alchemy Gold (ALGOLD)" indicator, are categorized into three groups:
Group 1, Alchemy Setting:
Alchemy Sharpness (Default: 7) - Controls the sharpness of the adaptive filter.
Alchemy Period (Default: 55) - Determines the smoothness of the oscillator.
Group 2, DVATAR Setting:
DVATR Length (Default: 11) - Sets the period length for the DVATR, similar to ATR's Length.
DVATR Threshold (Default: 0.07) - Adjusts sensitivity for sideways market detection.
Smooth Length (Default: 21) - Smoothens the DVATR output, balancing with volatility detection.
Group 3, Divergence Setting:
Parameters like Pivot Lookback, Max/Min of Lookback Range - Sets the sensitivity for divergence detection.
Options to enable or disable plots for various types of divergence (Bullish, Hidden Bullish, Bearish, Hidden Bearish).
" L5 Alchemy Gold (ALGOLD)" indicator are vivid and intuitive:
Candle Bar Color :
Gradient color changes to indicate trend strength, with warmer colors for bullish and cooler colors for bearish trends.
Line Colors and Shapes :
Green color represents the fast line, red for the slow line.
Crosses of these lines signal entries (triangles) and exits (cross shapes).
A band is created between these lines, filled with green for uptrends and red for downtrends.
Histogram :
Red histogram for above 0 and uptrend.
Blue histogram for above 0 and retracement.
Green histogram for below 0 and downtrend.
Yellow histogram for below 0 and bounce-up.
[blackcat] L1 Triple EMA ChannelHey, friends! blackcat is here to bring you an interesting and professional article today, talking about the "Triple Exponential Moving Average (TEMA) Channel" - a powerful tool as a trend indicator in volatile markets.
First of all, let's delve into the origins of the TEMA indicator. It was invented by Patrick Mulloy in the mid-90s with the aim to address the lagging issue encountered when using oscillators or Exponential Moving Averages (EMA). The TEMA indicator smooths out short-term fluctuations by utilizing multiple moving averages. What sets it apart is its unique approach of continuously using the EMA's EMA and adjusting for lag in its formula.
In this article, we will primarily focus on the functionality of the TEMA channel as a trend indicator. However, it's worth noting that its effectiveness is diminished in choppy or sideways markets. Instead, the TEMA indicator shines brightest in long-term trend trading. By utilizing TEMA, analysts can easily filter out and disregard periods of volatility, allowing them to focus on the overall trend.
To gain a comprehensive understanding of market trends, it is often recommended to combine TEMA with other oscillators or technical indicators. This combination can help traders and analysts interpret sharp price movements and assess the level of volatility. For example, some analysts suggest combining the Moving Average Convergence Divergence (MACD) with the TEMA channel to evaluate market trends more accurately.
Now, let's explore how the TEMA channel can be used as a tool to showcase interesting features of price support and resistance. In this script, the TEMA channel is represented by three bands: the upper band, the middle band, and the lower band. The upper band is depicted in white, the middle band in yellow, and the lower band in magenta.
So, let's dive deep into the world of the TEMA channel and enjoy the benefits it brings to understanding market trends. Join us on this exciting journey!

[blackcat] L3 Fibonacci Bands With ATRToday, what I'm going to introduce is a technical indicator that I think is quite in line with the indicator displayed by Tang - Fibonacci Bands with ATR. This indicator combines Bollinger Bands and Average True Range (ATR) to provide insights into market volatility and potential price reversals. Sounds complicated, right? Don't worry, I will explain it to you in the simplest way.
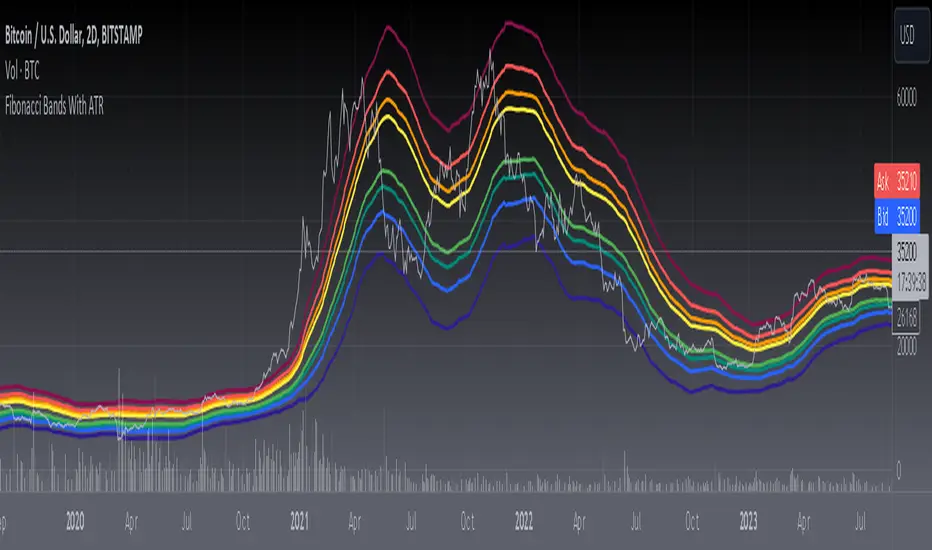
First, let's take a look at how Fibonacci Bands are constructed. They are similar to Bollinger Bands and consist of three lines: upper band, middle band (usually a 20-period simple moving average), and lower band. The difference is that Fibonacci Bands use ATR to calculate the distance between the upper and lower bands and the middle band.
Next is a key factor - ATR multiplier. We need to smooth the ATR using Welles Wilder's method. Then, by multiplying the ATR by a Fibonacci multiplier (e.g., 1.618), we get the upper band, called the upper Fibonacci channel. Similarly, multiplying the ATR by another Fibonacci multiplier (e.g., 0.618 or 1.0) gives us the lower band, called the lower Fibonacci channel.
Now, let's see how Fibonacci Bands can help us assess market volatility. When the channel widens, it means that market volatility is high, while a narrow channel indicates low market volatility. This way, we can determine the market's activity level based on the width of the channel.
In addition, when the price touches or crosses the Fibonacci channel, it may indicate a potential price reversal, similar to Bollinger Bands. Therefore, using Fibonacci Bands in trading can help us capture potential buy or sell signals.
In summary, Fibonacci Bands with ATR is an interesting and practical technical indicator that provides information about market volatility and potential price reversals by combining Bollinger Bands and ATR. Remember, make good use of these indicators and apply them flexibly in trading!
This code is a TradingView indicator script used to plot L3 Fibonacci Bands With ATR.
First, the indicator function is used to define the title and short title of the indicator, and whether it should be overlaid on the main chart.
Then, the input function is used to define three input parameters: MA type (maType), MA length (maLength), and data source (src). There are four options for MA type: SMA, EMA, WMA, and HMA. The default values are SMA, 55, and hl2 respectively.
Next, the moving average line is calculated based on the user's selected MA type. If maType is 'SMA', the ta.sma function is called to calculate the simple moving average; if maType is 'EMA', the ta.ema function is called to calculate the exponential moving average; if maType is 'WMA', the ta.wma function is called to calculate the weighted moving average; if maType is 'HMA', the ta.hma function is called to calculate the Hull moving average. The result is then assigned to the variable ma.
Then, the _atr variable is used to calculate the ATR (Average True Range) value using ta.atr, and multiplied by different coefficients to obtain four Fibonacci bias values: fibo_bias4, fibo_bias3, fibo_bias2, and fibo_bias1.
Finally, the prices of the upper and lower four Fibonacci bands are calculated by adding or subtracting the corresponding Fibonacci bias values from the current price, and plotted on the chart using the plot function.
[blackcat] L2 Fibonacci BandsThe concept of the Fibonacci Bands indicator was described by Suri Dudella in his book "Trade Chart Patterns Like the Pros" (Section 8.3, page 149). These bands are derived from Fibonacci expansions based on a fixed moving average, and they display potential areas of support and resistance. Traders can utilize the Fibonacci Bands indicator to identify key price levels and anticipate potential reversals in the market.
To calculate the Fibonacci Bands indicator, three Keltner Channels are applied. These channels help in determining the upper and lower boundaries of the bands. The default Fibonacci expansion levels used are 1.618, 2.618, and 4.236. These levels act as reference points for traders to identify significant areas of support and resistance.
When analyzing the price action, traders can focus on the extreme Fibonacci Bands, which are the upper and lower boundaries of the bands. If prices trade outside of the bands for a few bars and then return inside, it may indicate a potential reversal. This pattern suggests that the price has temporarily deviated from its usual range and could be due for a correction.
To enhance the accuracy of the Fibonacci Bands indicator, traders often use multiple time frames. By aligning short-term signals with the larger time frame scenario, traders can gain a better understanding of the overall market trend. It is generally advised to trade in the direction of the larger time frame to increase the probability of success.
In addition to identifying potential reversals, traders can also use the Fibonacci Bands indicator to determine entry and exit points. Short-term support and resistance levels can be derived from the bands, providing valuable insights for trade decision-making. These levels act as reference points for placing stop-loss orders or taking profits.
Another useful tool for analyzing the trend is the slope of the midband, which is the middle line of the Fibonacci Bands indicator. The midband's slope can indicate the strength and direction of the trend. Traders can monitor the slope to gain insights into the market's momentum and make informed trading decisions.
The Fibonacci Bands indicator is based on the concept of Fibonacci levels, which are support or resistance levels calculated using the Fibonacci sequence. The Fibonacci sequence is a mathematical pattern that follows a specific formula. A central concept within the Fibonacci sequence is the Golden Ratio, represented by the numbers 1.618 and its inverse 0.618. These ratios have been found to occur frequently in nature, architecture, and art.
The Italian mathematician Leonardo Fibonacci (1170-1250) is credited with introducing the Fibonacci sequence to the Western world. Fibonacci noticed that certain ratios could be calculated and that these ratios correspond to "divine ratios" found in various aspects of life. Traders have adopted these ratios in technical analysis to identify potential areas of support and resistance in financial markets.
In conclusion, the Fibonacci Bands indicator is a powerful tool for traders to identify potential reversals, determine entry and exit points, and analyze the overall trend. By combining the Fibonacci Bands with other technical indicators and using multiple time frames, traders can enhance their trading strategies and make more informed decisions in the market.
[blackcat] L3 Six-color Divine Dragon**L3 Six-color Divine Dragon** Indicator consists of red profit holders, yellow floating chips, and green trapped holders, along with their 10-day moving averages, totaling six colors, hence the name Six Color Dragon. The dynamic chips reflect the trading and movement of the main chips within a certain range. Purple represents the stock price entering the oversold zone, and yellow represents the stock price in a normal trend. The Six Color Dragon Indicator calculates the price and volume data over a period of time to display the buyer/seller activity. It analyzes the possible behavior of institutional funds based on the price and volume data of each trading day.
- Deep red bars: the current proportion of profitable holders.
- Red line: the moving average of the red bars.
- Deep green bars: the current proportion of losing holders.
- Light green line: the moving average of the green bars.
- Yellow bars: the proportion of daily traders (buying and selling on that day).
- Yellow line: the moving average of the yellow bars.
When the deep red bars > 50%, it indicates strong control of institutional funds and an easier continuation of the uptrend. When the deep green bars < 50%, it indicates retail investors are trapped inside, making it easier for the downtrend to continue.
The intersection of moving averages indicates a trend reversal signal:
1. Red line crossing above the green line: uptrend.
2. Green line crossing above the red line: downtrend.
The process of major manipulation of stock prices can be roughly divided into the following stages:
1. Accumulation stage: before the start of the main uptrend, the main players repeatedly clean up the chips to obtain more cheap chips; trial actions before the rise are also essential. When the selling pressure from external sources exceeds the expectations of the main players, they will continue to clean up the chips until their desired goal is achieved. After breaking through the platform, they choose to rise. During the rise, the main players will choose to lift, clean up, lift again, clean up again... When most investors feel that every pullback of this stock is a buying opportunity, often the top of this stock is not far away, and the main players have quietly started to exit.
By using the Six Color Dragon Indicator and dynamic chips together, we can effectively grasp the various stages of the main manipulation of stock prices:
1. Accumulation - initial rise: in this stage, the typical features of the Six Color Dragon Indicator are a decrease in trapped holders (green bars), an increase in floating chips (yellow bars), and occasional appearance of profit holders. The dynamic chips show that the stock price always fluctuates around the dense peak area of the chips. This stage is more difficult to operate, so it is recommended to wait for the appearance of a buying signal.
Buying signal: the stock price breaks through the consolidation pattern with increased volume, the 10-day moving average of the profit holders in the Six Color Dragon Indicator is moving upward, and the red bars of the profit holders break through the purple moving average of the profit holders; the stock price is more than 10% away from the dense peak area.
2. Trial trading, chip cleaning: after the main accumulation is completed, before a significant rise, there is often a trial trading phase. If a large amount of selling pressure is observed, it is usually necessary to clean up the floating chips, which is called chip cleaning. The chip cleaning is manifested in the stock price as significant fluctuations.
The main features of this stage are: the 10-day moving average of the profit holders in the Six Color Dragon Indicator changes from an upward trend to a flat or smaller angle, indicating a decrease in profit holders, and the stock price experiences a certain amount of decline. However, the dense peak of the dynamic chips remains unchanged, and the stock price usually fluctuates above the corresponding price level of the dense chip area, rarely falling below the dense peak or quickly recovering after falling below.
At this time, we can choose to buy a portion of the stock near the dense peak of the dynamic chips when the stock price stabilizes. We can then add more positions when there is another significant volume breakthrough of the previous high point, and the dense peak of the dynamic chips does not shift upward.
3. Main rise stage: this stage is the main profit-making stage of significant rise.
- The main features in the early stage of the rise are steadily increasing red bars in the Six Color Dragon Indicator and a steady upward trend of the 10-day moving average of the profit holders.
- In the later stage of the rise, the red bars are mostly above the 10-day moving average of the profit holders or around it. The dense peak of the dynamic chips does not clearly shift upward, or even after the shift, the stock price continues to run above the new dense peak, indicating that the stock still has upside potential and can be held.
4. Distribution stage: the main features of this stage are a slow decrease in profit holders, red bars retracting within the 10-day moving average, accompanied by a decline in the stock price and the emergence of trapped holders; the dense peak of the dynamic chips shifts upward, and the stock price falls below the newly formed dense peak, leading to an increase in trapped holders and profit-taking.
Note: when analyzing weak rebounds, the selected range, the time span on the x-axis, and the turnover statistics may vary, resulting in different effects in dynamic chip analysis. Specifically, the range from the most recent point to the highest point within 3 weeks or more is usually a reasonable range. Remember to identify the high point of a rebound that lasted for 3 weeks or more, otherwise, the accuracy of the analysis will be reduced.
In addition, when using the Six Color Dragon Indicator and dynamic chip analysis, it is necessary to combine other technical analysis tools and market conditions for comprehensive judgment in order to improve the accuracy and reliability of the analysis.

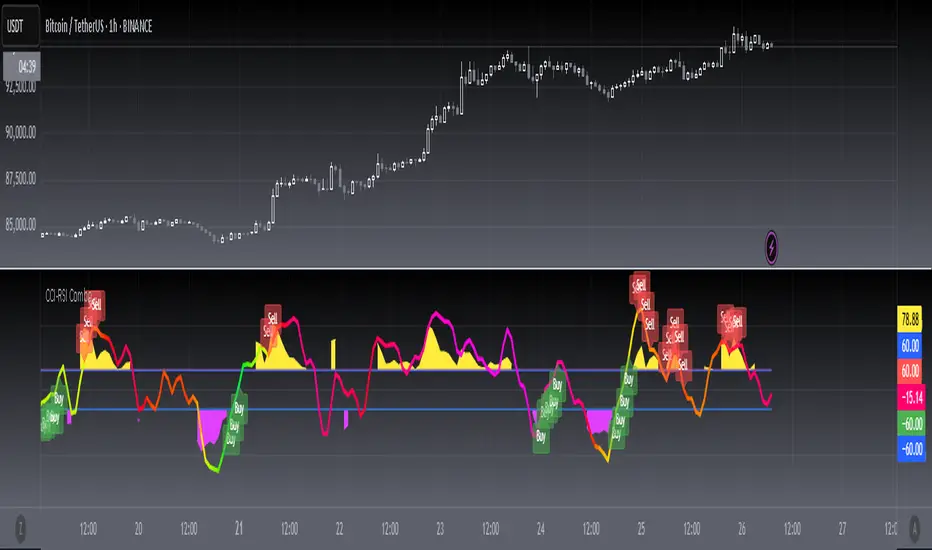
[blackcat] L3 CCI-RSI ComboCCI-RSI Combo indicator is a combination indicator that includes CCI and RSI. It uses some parameters to calculate the values of CCI and RSI, and generates corresponding charts based on these values. On the chart, when CCI exceeds 100 or falls below -100, yellow or magenta filling areas are displayed. Additionally, gradient colors are used on the RSI chart to represent different value ranges. Based on the values of CCI and RSI, buying or selling signals can be identified and "B" or "S" labels are displayed at the corresponding positions. It utilizes some technical indicators and logic to generate buying and selling signals, and displays the corresponding labels on the chart.
Here are the main parts of the code:
1. Definition of some variables:
- `N`, `M`, `N1`: Parameters used to calculate CCI and RSI.
- `xcn(cond, len)` and `xex(cond, len)`: Two functions used to calculate the number of times a condition is met.
2. Calculation of CCI (Commodity Channel Index):
- Calculate the CCI value based on the formula `(TYP - ta.sma(TYP, M)) / (0.015 * ta.stdev(TYP, M))`.
- Use the `plot()` function to plot CCI on the chart and set the color based on its value.
3. Calculation of RSI (Relative Strength Index):
- First calculate RSI1 by taking the average of positive differences between closing prices and the average of all absolute differences, and then multiplying by 100.
- Then use the ALMA function to transform RSI1 into a smoother curve.
- Use the `plot()` function to plot RSI on the chart and select gradient colors for shading based on its value.
4. Setting up the gradient color array:
- Create a color array using `array.new_color()` and add a series of color values to it.
5. Generating buying and selling signals based on conditions:
- Use logical operators and technical indicator functions to determine the conditions for buying and selling.
- Use the `label.new()` function to draw the corresponding labels on the chart to represent buying or selling signals.
[blackcat] L1 Ichimoku Cloud with Entry SignalsThe Ichimoku Cloud is a technical analysis indicator used to identify potential trend reversals, support and resistance levels, and generate entry and exit signals in financial markets. It was developed by a Japanese journalist named Goichi Hosoda, who went by the pen name Ichimoku Sanjin.
The Ichimoku Cloud consists of several components, including the Tenkan-sen (Conversion Line), Kijun-sen (Base Line), Senkou Span A (Leading Span A), Senkou Span B (Leading Span B), and the Cloud. The Tenkan-sen and Kijun-sen lines are calculated based on the average of the highest high and lowest low over a specific period of time. The Senkou Span A is the average of the Tenkan-sen and Kijun-sen, plotted ahead of the current price. The Senkou Span B is calculated based on the average of the highest high and lowest low over a longer period of time, also plotted ahead of the current price. The Cloud is the area between Senkou Span A and Senkou Span B and is often used to identify potential support and resistance levels.
The Ichimoku Cloud with Entry Signals script provided above is a TradingView Pine script that plots the Ichimoku Cloud on a chart, along with entry signals. The entry signals are generated based on the crossover and crossunder of the Tenkan-sen and Kijun-sen lines, as well as the relationship of the closing price with Senkou Span A and Senkou Span B. When the conditions for a long entry signal are met, a green triangle-up shape is plotted below the price bars. Conversely, when the conditions for a short entry signal are met, a red triangle-down shape is plotted above the price bars.
It's important to note that the Ichimoku Cloud is a versatile indicator that can be used in various ways, including identifying trends, determining support and resistance levels, and generating entry and exit signals. Traders and investors often use it in conjunction with other technical analysis tools and indicators to make informed trading decisions.
This piece of code is a TradingView indicator script used to plot Ichimoku Cloud and display entry signals. It is written in Pine Script language.
First, the `indicator` function is used to set the title and short title of the indicator and overlay it on the main chart.
Next, two parameters `tenkanPeriod` and `kijunPeriod` are defined to represent the calculation period of Tenkan-sen (Conversion Line) and Kijun-sen (Base Line) respectively. Then, the `ta.sma` function is used to calculate the values of Tenkan-sen and Kijun-sen, and they are plotted on the chart using the `plot` function.
After that, the value of Senkou Span A (Leading Span A) is calculated using the `math.avg` function, and it is plotted on the chart using the `plot` function. Similarly, the value of Senkou Span B (Leading Span B) is calculated and plotted.
Then, the `fill` function is used to fill the area between Senkou Span A and Senkou Span B with color, forming the cloud.
Finally, entry signals are determined based on certain conditions. If the conditions are met, the `plotshape` function is called to plot arrow shapes at the corresponding positions to represent entry points.

[blackcat] L1 MartinGale Scalping Strategy**MartinGale Strategy** is a popular money management strategy used in trading. It is commonly applied in situations where the trader aims to recover from a losing streak by increasing the position size after each loss.
In the MartinGale Strategy, after a losing trade, the trader doubles the position size for the next trade. This is done in the hopes that a winning trade will eventually occur, which will not only recover the previous losses but also generate a profit.
The idea behind the MartinGale Strategy is to take advantage of the law of averages. By increasing the position size after each loss, the strategy assumes that eventually, a winning trade will occur, which will not only cover the previous losses but also generate a profit. This can be especially appealing for traders looking for a quick recovery from a losing streak.
However, it is important to note that the MartinGale Strategy carries significant risks. If a trader experiences a prolonged losing streak or lacks sufficient capital, the strategy can lead to substantial losses. The strategy's reliance on the assumption of a winning trade can be dangerous, as there is no guarantee that a winning trade will occur within a certain timeframe.
Traders considering implementing the MartinGale Strategy should carefully assess their risk tolerance and thoroughly understand the potential drawbacks. It is crucial to have a solid risk management plan in place to mitigate potential losses. Additionally, traders should be aware that the strategy may not be suitable for all market conditions and may require adjustments based on market volatility.
In summary, the MartinGale Strategy is a money management strategy that involves increasing the position size after each loss in an attempt to recover from a losing streak. While it can offer the potential for quick recovery, it also comes with significant risks that traders should carefully consider before implementing it in their trading approach.
The MartinGale Scalping Strategy is a trading strategy designed to generate profits through frequent trades. It utilizes a combination of moving average crossovers and crossunders to generate entry and exit signals. The strategy is implemented in TradingView's Pine Script language.
The strategy begins by defining input variables such as take profit and stop loss levels, as well as the trading mode (long, short, or bidirectional). It then sets a rule to allow only long entries if the trading mode is set to "Long".
The strategy logic is defined using SMA (Simple Moving Average) crossover and crossunder signals. It calculates a short-term SMA (SMA3) and a longer-term SMA (SMA8), and plots them on the chart. The crossoverSignal and crossunderSignal variables are used to track the occurrence of the crossover and crossunder events, while the crossoverState and crossunderState variables determine the state of the crossover and crossunder conditions.
The strategy execution is based on the current position size. If the position size is zero (no open positions), the strategy checks for crossover and crossunder events. If a crossover event occurs and the trading mode allows long entries, a long position is entered. The entry price, stop price, take profit price, and stop loss price are calculated based on the current close price and the SMA8 value. Similarly, if a crossunder event occurs and the trading mode allows short entries, a short position is entered with the corresponding price calculations.
If there is an existing long position and the current close price reaches either the take profit price or the stop loss price, and a crossunder event occurs, the long position is closed. The entry price, stop price, take profit price, and stop loss price are reset to zero.
Likewise, if there is an existing short position and the current close price reaches either the take profit price or the stop loss price, and a crossover event occurs, the short position is closed and the price variables are reset.
The strategy also plots entry and exit points on the chart using plotshape function. It displays a triangle pointing up for a buy entry, a triangle pointing down for a buy exit, a triangle pointing down for a sell entry, and a triangle pointing up for a sell exit.
Overall, the MartinGale Scalping Strategy aims to capture small profits by taking advantage of short-term moving average crossovers and crossunders. It incorporates risk management through take profit and stop loss levels, and allows for different trading modes to accommodate different market conditions.

[blackcat] L3 SuperJThe SuperJ indicator is a powerful tool that utilizes VWMA (Volume Weighted Moving Average) and ALMA (Arnaud Legoux Moving Average) to filter and enhance the KDJ indicator, resulting in a smoother J line and the creation of the SuperJ indicator. By incorporating TVMA (Triggered Volume Moving Average), the SuperJ indicator can generate trigger signals that can form bullish and bearish crossovers with the J line, creating an oscillating pattern.
The combination of VWMA and ALMA helps to remove noise from the market and provides clearer trading signals. This is particularly useful when the market is highly volatile or the trend is ambiguous. The oscillations of the J line can help traders identify the true trend and avoid being misled by false signals.
Furthermore, by considering the values and trends of the J line in conjunction with other technical analysis tools, traders can make more accurate assessments of market trends and price movements. For example, when combined with moving averages, the SuperJ indicator can enhance the ability to identify price reversal points.
The SuperJ indicator also offers benefits in assessing overbought and oversold conditions in the market. By observing the values and trends of the J line, traders can more accurately evaluate market sentiment and strength. When the J line is above 80, it may indicate an overly optimistic market with a risk of overbought conditions. Conversely, when the J line is below 20, it may indicate an overly pessimistic market with an opportunity for oversold conditions. These signals can assist traders in determining when to buy or sell.
In summary, the SuperJ indicator, derived from the combination of VWMA, ALMA, and TVMA, provides traders with a valuable tool for identifying overbought and oversold conditions, predicting price reversals, and generating high-quality trading signals. Its application as a "buy low, sell high" strategy element is highly effective in maximizing trading opportunities and optimizing profitability.

[blackcat] L2 Range Action Verification Index (RAVI) with 3 SMAThe Range Action Verification Index (RAVI) is a technical indicator used in trading to measure the strength of a trend. It compares two simple moving averages (SMAs) to determine the market's momentum.
To calculate RAVI, we subtract the shorter SMA from the longer SMA, and then divide the result by the longer SMA. This value is then multiplied by 100 to express it as a percentage.
The RAVI indicator helps traders identify whether the market is in a trending or range-bound phase. When the RAVI value is positive, it indicates a bullish trend, suggesting that the market is in an uptrend. Conversely, a negative RAVI value indicates a bearish trend or a downtrend.
Traders can use the RAVI indicator in several ways. Here are a few common strategies:
1. **Trend confirmation**: Traders can use RAVI to confirm the strength of a trend identified by other indicators or price patterns. If the RAVI value aligns with the direction of the trend, it provides additional confirmation.
2. **Overbought and oversold conditions**: Traders can use extreme RAVI values to identify overbought or oversold conditions in the market. When the RAVI value reaches high positive or negative levels, it suggests that the market may be due for a reversal or a retracement.
3. **Divergence**: Traders can look for divergences between the RAVI indicator and the price action. For example, if the price makes a higher high, but the RAVI value makes a lower high, it could indicate a weakening trend and a potential reversal.
As with any technical indicator, it is essential to use RAVI in conjunction with other tools and analysis techniques to make informed trading decisions. Traders should also consider factors such as market conditions, risk management, and other supporting indicators to validate their trading strategies.
In this indicator, an additional simple moving average (SMA) is introduced to consider long-term bias. This modification allows the Range Action Verification Index (RAVI) to be used as a volatility filter. By comparing the shorter SMA with this longer SMA, traders can gain insights into the market's volatility and adjust their trading strategies accordingly. This longer SMA helps provide a broader perspective on the market's trend and can be particularly useful for identifying and filtering out periods of high volatility. It is called "L2 Range Action Verification Index (RAVI) with 3 SMA". It calculates the RAVI value based on three simple moving averages (SMA). The code also includes calculations for the upper and lower bands, as well as color gradient settings. Finally, it plots the RAVI values and a midline.
It calculates the Range Action Verification Index (RAVI) using three Simple Moving Averages (SMA). The RAVI measures the difference between two SMAs divided by a third SMA, and then multiplied by 100.
The code starts with defining input parameters such as length, multiplier, and lengths for the three SMAs. Then it assigns the closing price to a variable called "price".
Next, it calculates the three SMAs using the "ta.sma" function from TradingView's built-in technical analysis library. The first SMA uses "sma1Length", the second SMA uses "sma2Length", and the third SMA uses "sma3Length".
After that, it calculates the RAVI by subtracting sma2 from sma1, dividing it by sma3, and multiplying it by 100.
Then it calculates additional values like basis (using another SMA), deviation (using standard deviation), upper band (basis + dev), and lower band (basis - dev).
Finally, it plots these values on a chart using different colors for each line. It also creates an array of gradient colors based on RSI values calculated from another indicator called ALMA. This gradient color is used to colorize the RAVI line.
Overall, this script helps visualize and analyze market trends based on moving averages and their relationship with price movements.

[blackcat] L1 NinjaTrader ChannelNinjaTrader is a popular charting software widely used for trading analysis and execution in financial markets such as stocks, futures, and forex. It provides rich features and tools to assist traders in technical analysis, trade strategy development, and trade execution. When I discovered a built-in channel technical indicator in NinjaTrader and became interested in it but didn't understand its principles, I utilized my extensive development experience to simulate a similar version based on its characteristics, naming it "Ninja Channel" for reference only. First, I observed the characteristics and behavior of the built-in channel indicator. Pay attention to how it calculates and plots the channels, as well as its parameter settings and usage methods. This information can help me better understand the principles and functions of this indicator. Then, I attempted to simulate a similar channel indicator using my existing knowledge of technical analysis tools. I used charting tools and indicators to plot and calculate the upper and lower boundaries of the channel according to my needs and preferences. Please remember that this simulated version is for reference only; there is no guarantee that it will be exactly identical to the built-in channel indicator in NinjaTrader. The original built-in indicator may have more complex calculation methods with more precise results. Therefore, before engaging in actual trading activities, it is recommended that you carefully study and understand the principles and usage methods of the original indicator.
The Ninja Channel belongs to a type of technical indicator used for analyzing price range fluctuations and trends. It constructs an upper-lower boundary channel based on high-low points or moving average line fluctuations of prices to assist traders in determining overbought/oversold zones, trend strength/weaknesses,and price reversal points.
The main uses of Ninja Channel include:
1.Trend determination: The Ninja Channel helps traders determine price trends.When prices are located above half partofthechannel,it indicates an uptrend; when prices are located below half partofthechannel,it indicates adowntrend. Traders can formulate corresponding trading strategies based on trend analysis.
2.Overbought/oversold zones: The upper and lower boundaries of the Ninja Channel can be used to determine overbought and oversold zones.When prices touch or exceed the upper boundary of the channel, it may indicate an overbought market condition with a potential price pullback or reversal; when prices touch or fall below the lower boundary of the channel, it may indicate an oversold market condition with a potential price rebound or reversal.Traders can develop counter-trend or reversal trading strategies based on these overbought/oversold zones.
3.Dynamic support and resistance: The upper and lower boundaries of the Ninja Channel can be seen as dynamic support and resistance levels.When prices approach the upper boundary ofthechannel,theupperboundarymay act asresistance, limiting upward price movement; when prices approachthelowerboundaryofthechannel,thelowerboundarymayactassupport,limiting downward price movement.Traderscanmake trading decisions based on these dynamic supportandresistancelevels.
Of course, for this newly created indicator,some aspects are still unfamiliar.However,the learning process can refer to some common channel-type technical indicators including Bollinger Bands,Keltner Channels,and Donchian Channels. Each indicator has its unique calculation method and parameter settings.Traderscan choose suitable indicators according to their own needsandpreferences.
In summary,NinjaChannel is a type of technical indicator used for analyzingprice range fluctuationsandtrends.It helps traders determine trends,overbought/oversoldzones,anddynamic support/resistance levels in order to formulate appropriate trading strategies.However,technicalindicatorsareonly auxiliary tools.Traderstill needsto consider other factorsandsrisk managementstrategiesinorder tomakemore informedtradingdecisions.

[blackcat] L2 Market Facilitation IndexThe Market Facilitation Index (MFI) is a technical indicator that measures the ease with which the market is able to move based on the volume traded. It was developed by Dr. Bill Williams as part of his trading system.
The MFI is calculated by taking into account the difference between the current typical price (average of high, low, and close) and the previous typical price, multiplied by the volume. This difference is then divided by the sum of volume over a specified period.
The MFI helps traders to identify periods of high or low market facilitation. High MFI values indicate that the market is facilitating trade and moving with ease, suggesting increased activity and potential trading opportunities. Conversely, low MFI values suggest a lack of market facilitation, indicating decreased activity and potential consolidation or sideways movement.
Traders can use the MFI in conjunction with other technical indicators and price analysis techniques to make informed trading decisions. It can be used to confirm trends, identify potential reversals, and assess the strength of market movements.
The Market Facilitation Index provides valuable insights into market dynamics, as it focuses on the relationship between price movement and trading volume. By incorporating volume data into its calculations, the MFI captures the impact of volume on market activity.
This indicator is particularly useful in identifying periods of market consolidation or range-bound trading. When the MFI shows low values, it suggests that market participants are hesitant and there may be a lack of clear trends. Traders can interpret this as a potential signal to avoid entering new positions or to tighten their stop-loss levels.
Conversely, when the MFI indicates high values, it signifies that the market is experiencing high levels of activity and price movement. This can be an indication of a strong trend, and traders may look for opportunities to enter positions in line with the prevailing market direction.
In addition to identifying market trends and potential reversals, the MFI can also help traders gauge the strength of price movements. By comparing the MFI values during different price swings or trends, traders can assess whether the market is experiencing increasing or decreasing levels of facilitation. This information can be valuable in determining the overall momentum and sustainability of a trend.
It's important to note that while the Market Facilitation Index can be a useful tool in technical analysis, it should not be used in isolation. Like any indicator, it has its limitations and may not always accurately reflect market conditions. Therefore, it is advisable to combine the MFI with other technical indicators, chart patterns, and fundamental analysis to gain a more comprehensive understanding of the market.
In conclusion, the Market Facilitation Index is a powerful technical indicator that measures the ease with which the market is able to move based on trading volume. It helps traders identify periods of high or low market facilitation, confirm trends, identify potential reversals, and assess the strength of market movements. However, it should be used in conjunction with other analysis methods for comprehensive market evaluation.

[blackcat] L3 Supertrend of Nadaraya-Watson EnvelopeThe Nadaraya-Watson Envelope is a statistical technique used in finance and time series analysis. It is derived from the Nadaraya-Watson estimator, which is a non-parametric regression method.
In the context of the tradingview pine script provided, the Nadaraya-Watson Envelope is calculated based on the Volume Weighted Exponential Moving Average (VWEMA). The VWEMA is a type of moving average that takes into account both the price and volume of an asset. It is calculated by multiplying the closing price of the asset by its volume, then applying an exponential moving average to the result. This weighted moving average gives more importance to periods with higher trading volume.
The Nadaraya-Watson Envelope consists of an upper and lower envelope, which are calculated by applying a smoothing factor (alpha) to the standard deviation of the VWEMA. The standard deviation measures the volatility of the VWEMA, and the smoothing factor determines the width of the envelope. By adjusting the smoothing factor, traders can customize the sensitivity of the envelope to market conditions.
The Nadaraya-Watson Envelope can be used to identify potential overbought and oversold conditions in the market. When the price of an asset moves close to or beyond the upper envelope, it may indicate that the asset is overbought and due for a price correction. Conversely, when the price moves close to or below the lower envelope, it may indicate that the asset is oversold and due for a price rebound. Traders can use these signals to make informed decisions about buying or selling assets.
Additionally, the Nadaraya-Watson Envelope can be used to generate trading signals. For example, when the price crosses above the upper envelope, it may indicate a buy signal, suggesting that the price will continue to rise. Conversely, when the price crosses below the lower envelope, it may indicate a sell signal, suggesting that the price will continue to decline. Traders can use these signals in conjunction with other technical indicators and analysis to make well-informed trading decisions.
In summary, the Nadaraya-Watson Envelope is a powerful tool in technical analysis that combines the Volume Weighted Exponential Moving Average with upper and lower envelopes. It helps traders identify potential overbought and oversold conditions in the market and generate trading signals. By incorporating this technique into their analysis, traders can gain valuable insights into market dynamics and improve their trading strategies.
