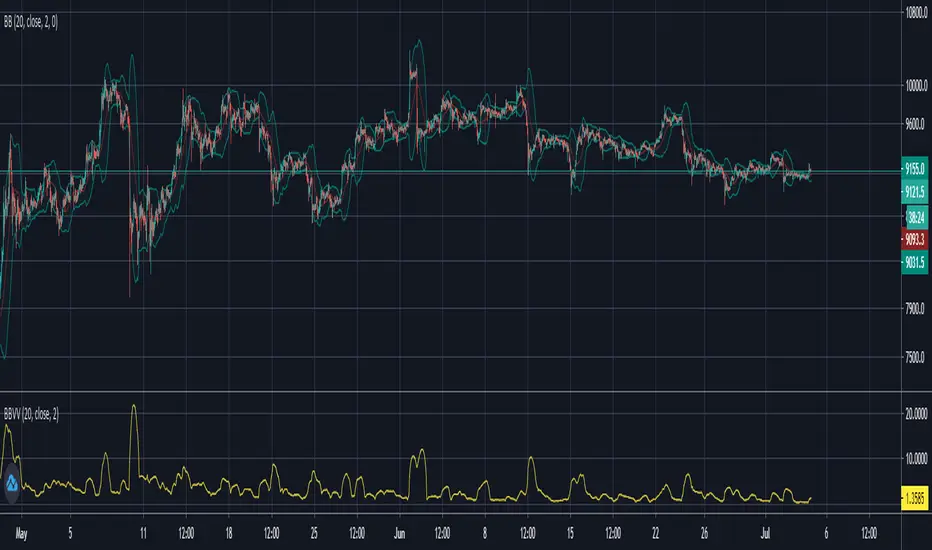
BBVV Low IndicatorThis is an indicator that flags the lowest Bollinger Bands Width value for a set number of bars back.
This is based on my BBVV script seen here
Each dot on the BBVV indicator marks the rolling "X"-period low in BBVV value. You can set "X" as any number of bars back in the settings of this indicator.
This can be used to accurately predict when periods of high-volatility could come into play due to continually contracting Bollinger Bands on a time-frame that you can set manually.
Created from a request from a user.
布林带(BB)

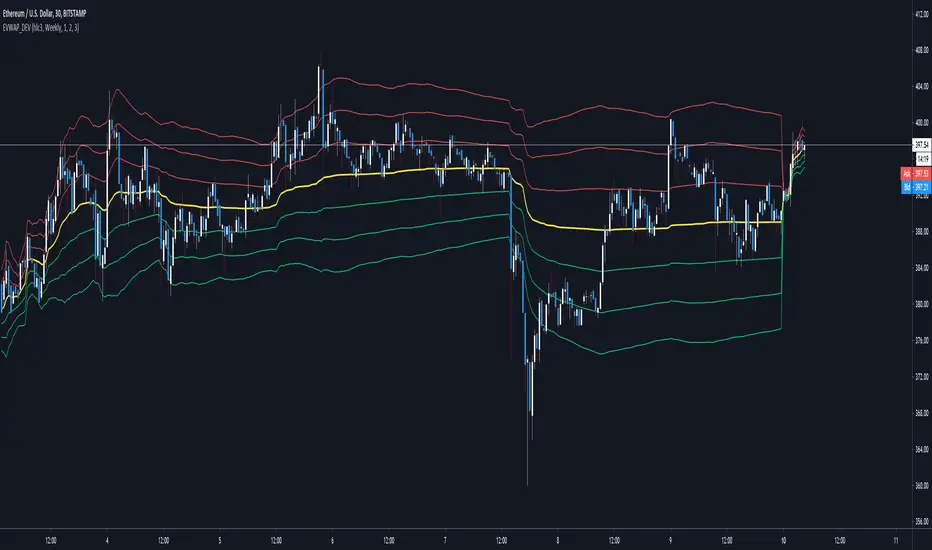
Exponential VWAP & DeviationsExponential Volume Weighted Average Price and Deviations.
Selectable intervals (daily/weekly/monthly/yearly vwap). Options to change deviation multipliers and display interval closing values for the previous interval.
Uses volume weighted EMA for the interval as the basis/vwap & exponential deviations calculated using the exponential vwap as the mean.
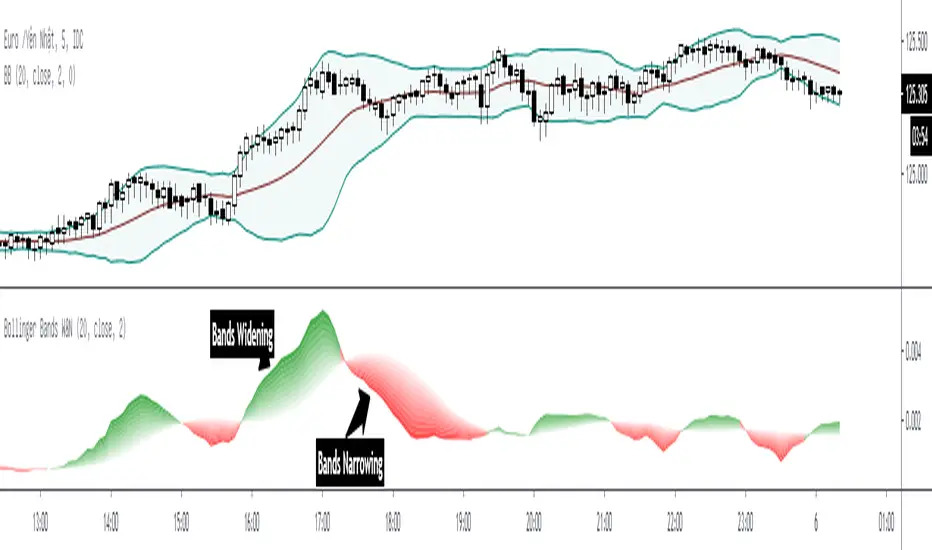
Bollinger Bands Wide & Narrow* Bollinger Bands Wide & Narrow apply a Simple Moving Average (SMA) on Bollinger Bands Width with same period of middle bands to regconize the bands are widening or narrowing.
* "Bands Widening" is marked by green shade.
* "Bands Narrowing" is marked by red shade.
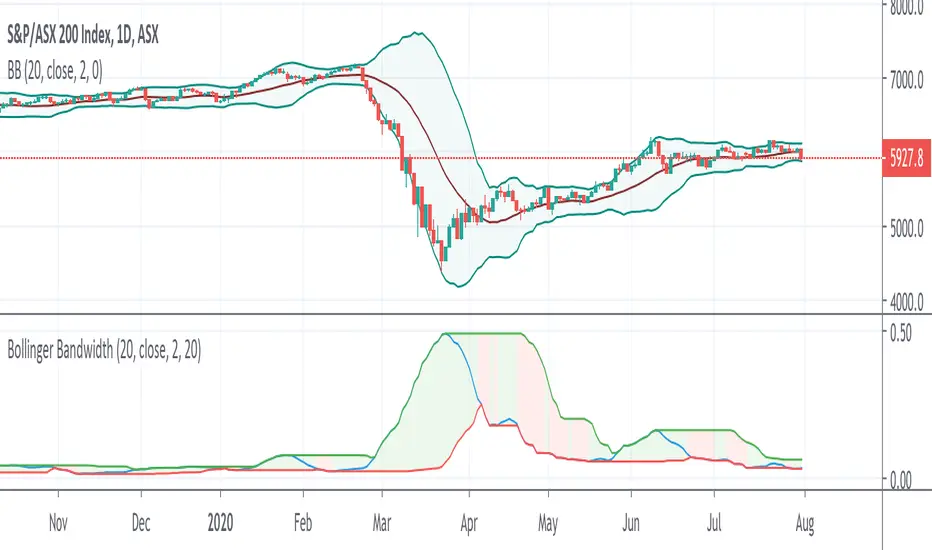
Bollinger Bandwidth - Bulge and squeezeThis is Bollinger bandwidth indicator:
Bandwidth = high-low/main
I have added lowest and highest of N periods to programmatically identify bulge and squeeze. When bandwidth at N periods low, it is in squeeze. If bandwidth at N periods high, it is in bulge.
CDub's BolBands SetupUses a set of Bollinger Bands (user defined deviation, user defined deviation * 2) to determine possible entry set ups.
Signals are triggered when price crosses the first band (closest to the baseline MA) in the desired direction.
baseline can be your take profit 1 target
The inside band determines entry and can be used as a take profit 2 target (Opposite side of baseline)
The outside band is a suggested stop loss target (Same side of baseline) and can be used as a take profit 3 target (Opposite side of baseline)
Suggestions are welcome!
-CDub

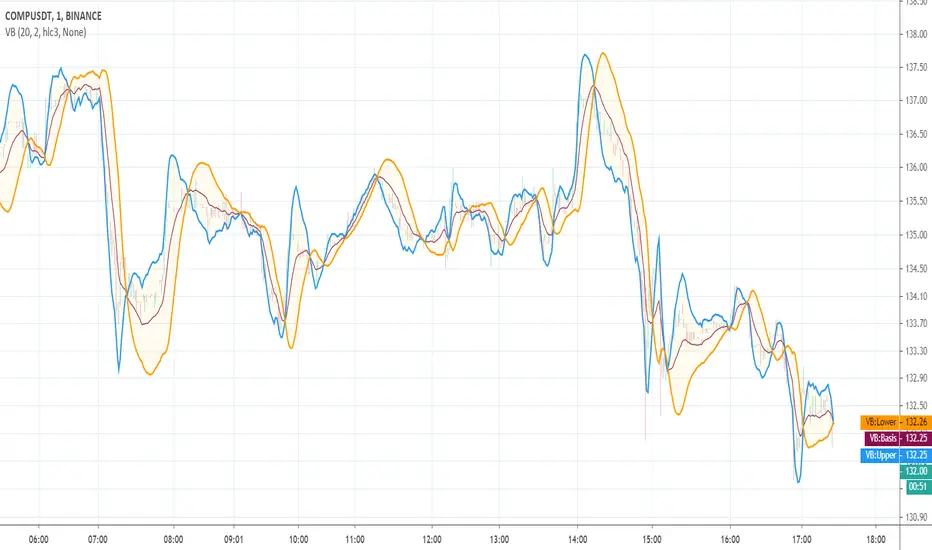
Vortex BandsA slighty modified version of Better Bollinger Bands. The idea of the experiment was to do a thing like the well-known Vortex Indicator, but an overlay:
Obvious trading rules are:
go Long when the blue line is above other two
go Short when the orange line is above other two
stop when price crosses the basis line
The tool is EXPERIMENTAL . Good luck!
Bollinger band 1+2Bollinger band with 1 and 2 standard deviation
Default with 21 SMA
Also count number of candlesticks of previous trend when crossing 1 standard deviation

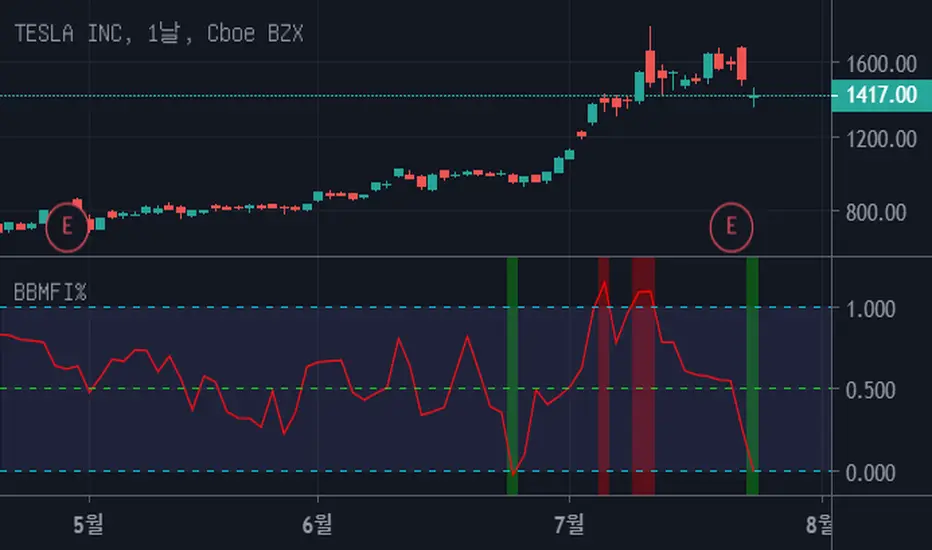
Bollinger Bands Money Flow Index %This script is similar to the previous one "Bollinger Bands Money Flow Index" but it's a little easier to interpret.
Fix the top line of the "BBMFI" to 1, and the bottom line to 0.
Indicates where "Money Flow Index" is located between the top and bottom lines.
If it's bigger than 1, it's overbuying. If it's less than 0, it's overselling.
Consider a trade if you are out of range from 0 to 1.
It's also a good trade timing to out of range and come back in.
Bollinger Bands Money Flow IndexThis script embodies the application of the Bollinger Band and Money Flow Index in John A. Bollinger's book "Bollinger on Bollinger Bands."
"Bollinger on Bollinger Bands" suggests a relatively method of analysis by applying the Bollinger Band to an indicator.
Here's one of the indicators, Money Flow Index.
Money Flow Index is an indicator of overbuying and overselling by reflecting the volume of transactions.
"Bollinger on Bollinger Bands" suggests using the Bollinger Band to create relative top and bottom lines for various indicators, such as Money Flow Index.
Original Money Flow Index is considered to be over-purchased if it is more than 80% and over-selling if it is less than 20%.
But if you put a bolinger band on it, you can set the standard for higher or lower over-selling and over-selling in a sustained bullish, bearish market.
This script uses the following values as the default values as recommended by "Bollinger on Bollinger Bands".
Money Flow Index for 10 days.
a bollinger band of forty days
standard deviation of 2
The above values are suitable for most stocks and markets, but sometimes there is too much or too little data inside the Bollinger Band.
It is recommended to modify each value little by little to adjust 85% to 90% of the total data to fit inside the Bollinger Band.
If the value is higher than the top line, it is considered over-purchased, and a red background color appears.
If the bottom line is crossed down, it is considered over-sold and the green background color appears.

Double Bollinger BandThe double bollinger band indicator uses a normal bollinger band with a multitude of 2 and on outer band with a multitude of 3. The indicator shows momentum by the price being stuck between the higher or lower bands. If price is in the middle then it is a neutral zone. The band's moving average is a default of 20 sma but included there are two extra simple moving averages just as extra indicators. This is my first published code and the code is messy; however, it gets the job done nice and simple. (:
Enjoy!

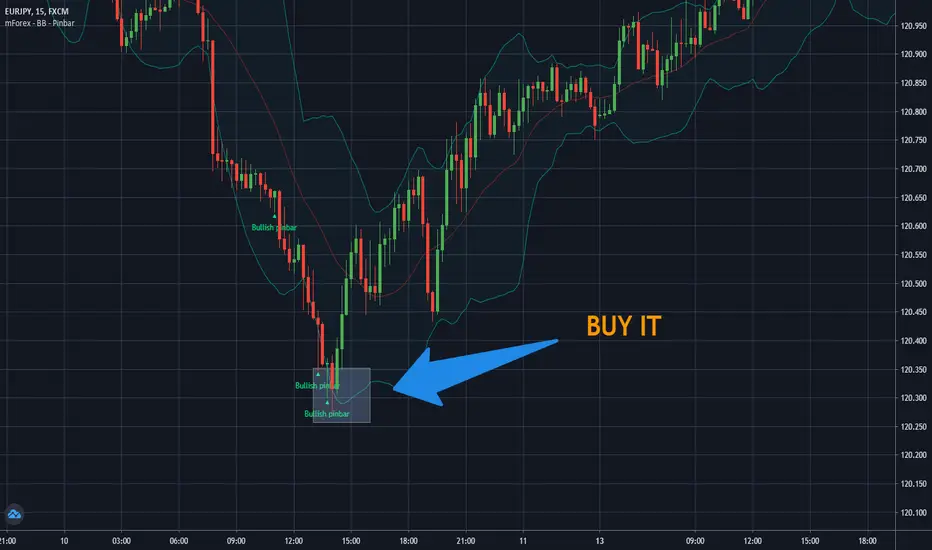
mForex - Bollinger Bands - Pinbar scalping systemTransaction setup parameters
Time frame: M5, M15
Currency pair: Any except XAU/USD
Trading strategies
=== BUY ===
Price break out of the lower Bollinger Bands
The Pinbar reversal candlestick appears and closes the candle on the lower Bollinger Bands
Stop loss: Nearest bottom + 3-5 pips
Profit target: 10-20 pips
=== SELL ===
Price break out of the upper Bollinger Bands
The Pinbar reversal candle appeared and closed below the upper
Stop loss: Nearest peak + 3-5 pips
Profit target: 10-20 pips
* If you have any questions or suggestions for this strategy, feel free to ask us.
Bollinger Band Reversal StudyThis strategy was inspired by ParallaxFX.
This strategy attempts to predict when a price reversal will happen. It uses bollinger bands, stochastics and candle formations.
The idea is that when an indecision candle, such as a doji, crosses outside the bollinger bands, then is followed by another candle that pushed sharply back inside the bands, you have a setup.
These setups are marked with green arrows to go long and red arrows to go short. Wait until the next candle begins before acting. The arrow may come and go as the price fluctuates, so wait until the candle closes.
Another play is when the same setup occurs, but on the middle bollinger band instead of the outer band.
These setups are marked with blue arrows to go long and yellow arrows to go short. Wait until the next candle begins before acting. The arrow may come and go as the price fluctuates, so wait until the candle closes.
Closing can happen a number of ways. You can use a predetermined risk-reward or look to sell when the price reaches another band.
In summary.
Go long when a green or blue arrow appears.
Go Short when a red or yellow arrow appears.
Green arrows show signs of reversal from lower BB.
Blue arrows show signs of reversal from middle BB.
Red arrows show signs of reversal from upper BB.
Yellow arrows show signs of reversal from middle BB.
Wait for candle with arrow to close before taking trade.

Median Absolute Deviation Filtered SMA & BBMedian Absolute Deviation (MAD) is a robust measurement of variability and more resilient against outliers and small samples.
This experiment uses MAD as a means of filtering outliers from an SMA calculation. First we construct the equivalent of a Bollinger Band, but based on the median as the basis and a multiple( k ) of MAD as the outlier cutoff.
k can be set a number of ways. As a simple multiple (3 - very conservative / 2.5 - moderately conservative / 2 - poorly conservative). Alternatively MAD can be used as an estimator of standard deviation by using a multiple of 1.4826 (SD1 - 1.4826 / SD2 - 2.9652 / SD3 - 4.4478).
Once we have a cutoff range an SMA is calculated with the outliers filtered out. Additionally a Bollinger band can be output using the filtered SMA as the basis and a multiple of the MAD instead of SD for the bands.

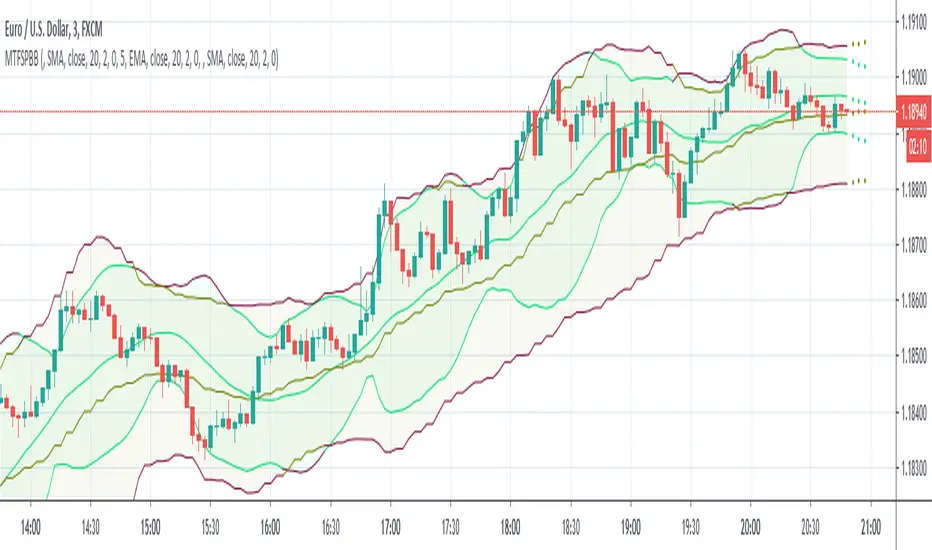
MultiTimeFrame Shifting Predictive Bollinger BandsThis is the optimized version of my MTFSBB indicator with capability of possible bands prediction in case of negative shifting (to the left).
Make me happy by using it and sending me your ideas about the prediction.
Bollinger Band Volatility Spread VisualizerThis indicator was created to see the total dollar (or whatever currency pair) amount spread between the upper and lower Bollinger Bands. This knowledge of knowing this spread can be used to indicate upcoming periods of high volatility in a market. The fundamental idea behind predicting periods of high volatility is backed up by the idea that periods of low volatility are followed by periods of high volatility and vice versa.
Based on this knowledge, the numerical spread of the Bollinger Bands, as shown in the indicator, we can deduce that when the value is super low, we can expect a period of high volatility AKA: big move incoming.
This indicator is not fully finished because this was my first time coding in Pinescript and I wanted to post the basic indicator first.
My future plans for improving this indicator include:
Adding customization as an option to choose your personal BBands settings that this indicator is based off of
Potentially converting this indicator as a TradingView Strategy where a signal would go off when the spread reaches a certain threshold
3MAs & BB, Time-Res, Low-VolTriple MAs with EMA/SMA option, and specific timeframe options.
Very customizable.
Bollinger Bands
If BollingerBand Width is lowest in 100 bars it fills background.

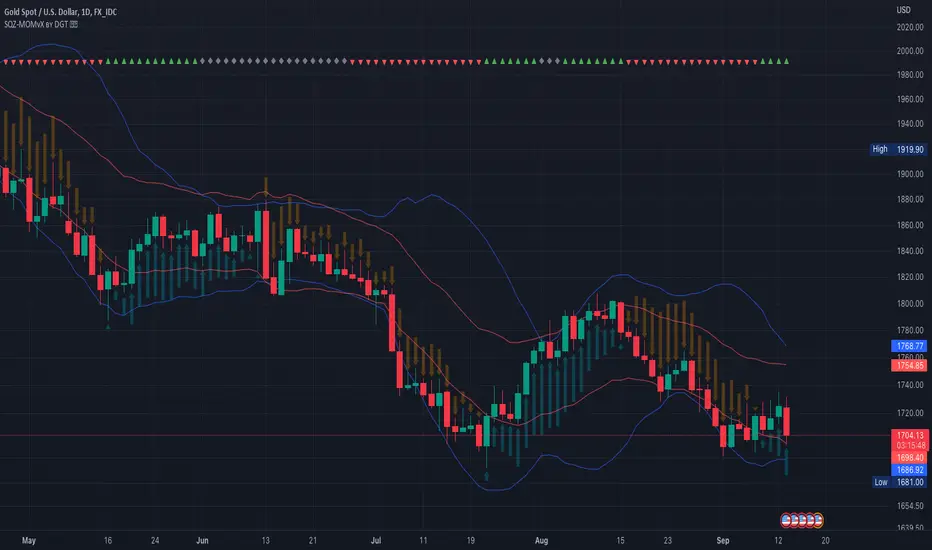
Squeeze Momentum Indicator [LazyBear] vX by DGTModified version of Squeeze Momentum Indicator visualizing on Price Chart
author: LazyBear, modified by KıvançÖZBİLGİÇ
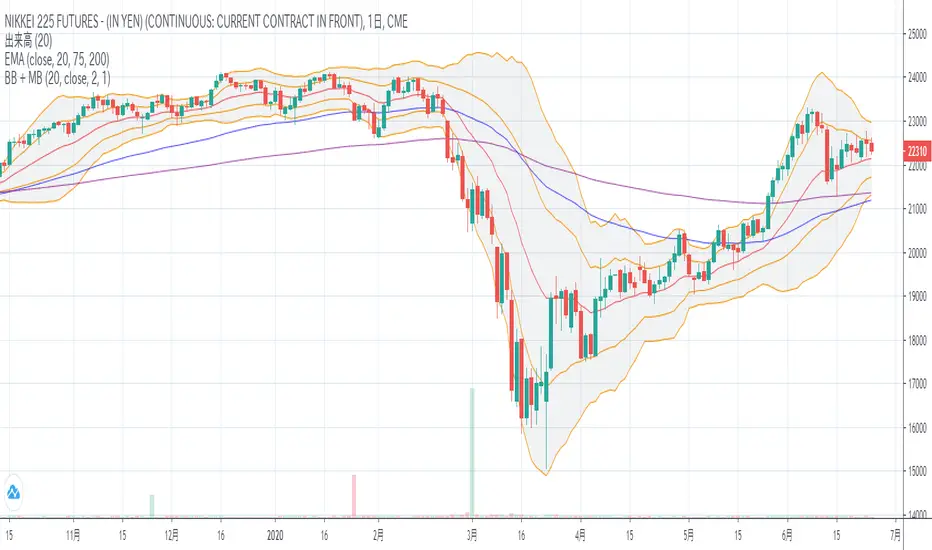
Bolinger Band + Mid Band using EMAEMA become more popular than SMA.
EMA reacts faster than SMA.
Mid Band helps you to find out trend.
Ichimoku ++ public v0.9Description:
The intention of this script is to build/provide a kind of work station / work bench for analysing markets and especially Bitcoin . Another goal is to get maximum market information while maintaining a good chart overview. A chart overloaded with indicators is useless because it obscures the view of the chart as the most important indicator. The chart should be clear and market structure should be easy to see. In addition, some indicator signals can be activated to better assess the quality of signals from the past. The chart environment or the chart context is important for the quality of a signal.
The intention of this script is not to teach someone how to trade or how to use these Indicators but to provide a tool to analyse markets better and to help to draw conclusions of market behaviour in a higher quality.
A general advise:
Use the included indicators and signals in a confluent way to get stoploss, buy and sell entry points. SR clusters can be identified for use in conjunction with fractals as entry and exit pints. My other scripts can also help. Prefer 4 hours, daily and a longer time frame. There is no "Holy Grail" :).
If someone is new to trading you should learn about the indicators first. Definitely learn about Ichimoku Cloud Indicator.
Integrated indicators are:
Ichimoku Cloud and signals
Parabolic SAR and signal
ATR stop
Bollinger Bands
EMA / SMA and background color as signal
Williams Fractals and signal
Puell Multiple signal

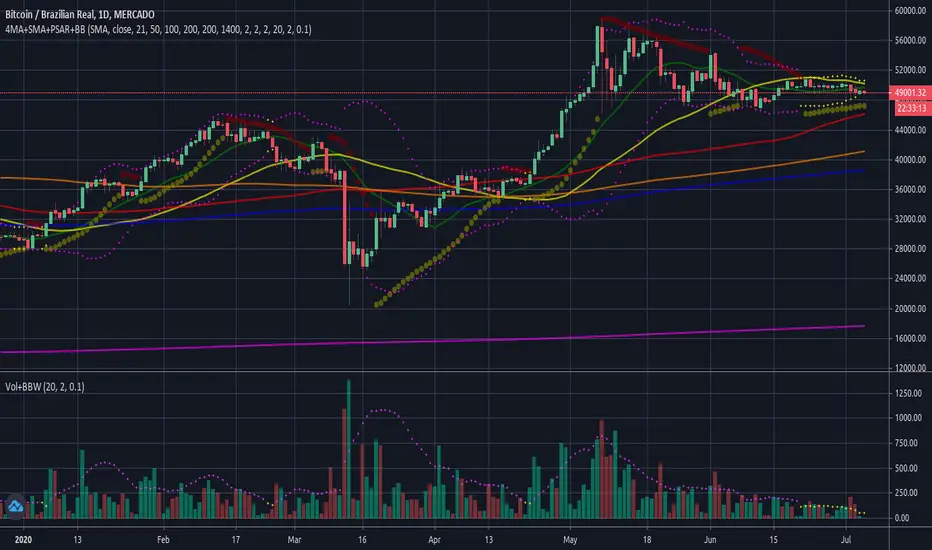
Double BB + Multi Ema Use this indicator to identify the market trend, possible dynamic Supports or Resistances and possible setbacks or corrections.
Take the Moving Averages (50,75,100,200) as a reference to identify if the market is bullish or bearish.
Have as reference the Moving Averages (8,15,20,25) as possible dynamic Supports or Resistances.
Have the BB as a reference, to identify possible setbacks or changes in trends.

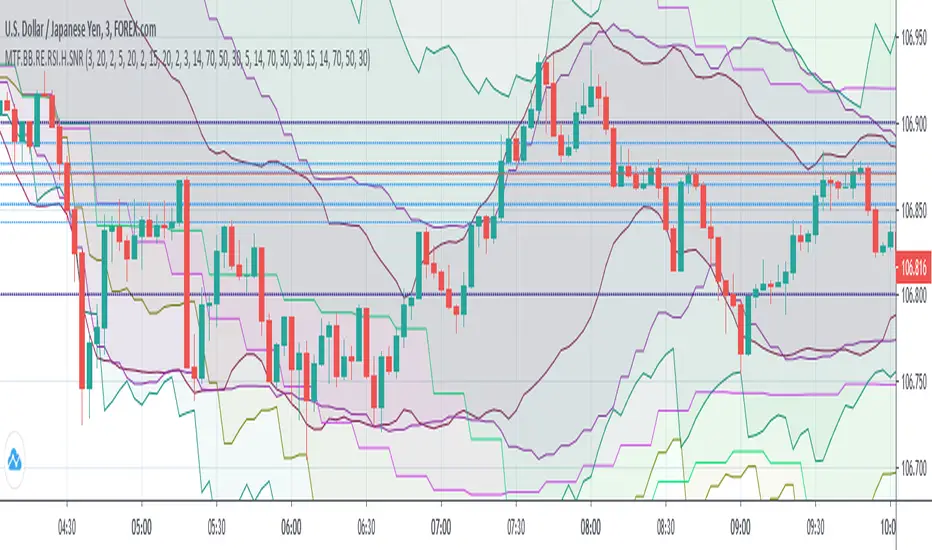
(MTF) Bollinger Bands + RE RSIs + Hidden Supports & ResistancesI merged some of my previous written indicators, because a combination of multi-timeframe Bollinger Bands, RE RSI and Resistance/Support levels could help a lot.
Don't forget to add my other useful indicator (Classical SnR) to the chart to maximize your profit!