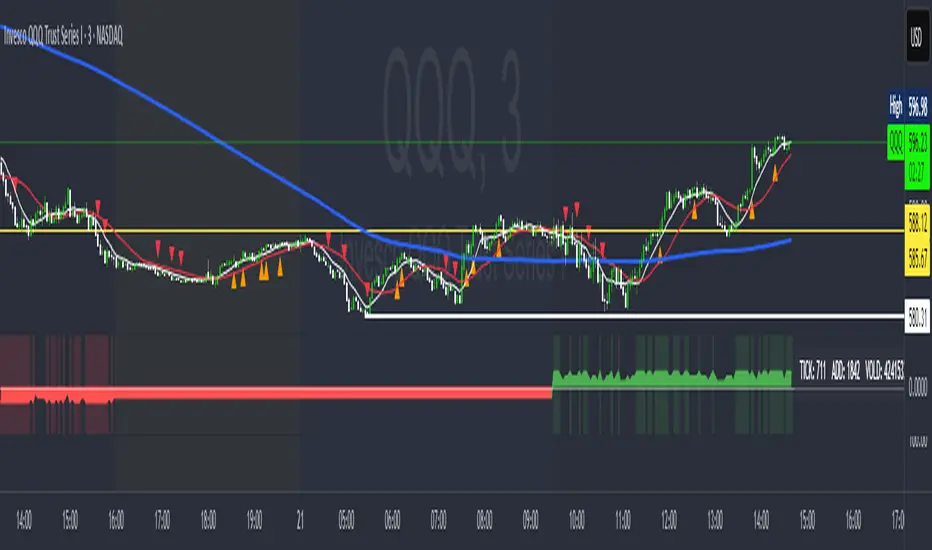
MarketMafia Internals (TICK / ADD / VOLD)this indicator has been built to give the over all heartbeat of the market. Keeping you from fake outs . Pine Script®指标由bonnevalfoods提供6
FOX ScreenerFOX Screener is a multi-indicator market scanner designed to analyze up to 10 symbols simultaneously and display their technical conditions in a clean, real-time table. It helps traders quickly identify bullish, bearish, and neutral setups based on a combined signal system. The screener evaluates each symbol using: RSI (Overbought/Oversold levels) MACD (Momentum direction) EMA Difference (Short–Long trend bias) Bollinger Bands (Volatility-based reversal zones) Price, High, Low (For quick reference) Each indicator generates its own BUY/SELL/NEUTRAL reading, and the script consolidates them into a Total Signal with color-coded highlighting: BUY when bullish signals dominate SELL when bearish signals dominate NEUTRAL when signals are mixed Disclaimer: The information provided is for educational and informational purposes only. It does not constitute financial or investment advice. Trading and investing in stocks involves risk, including the possible loss of capital. Any decisions to buy, sell, or hold securities are the sole responsibility of the reader. Past performance is not indicative of future results. Always do your own research and, if necessary, consult with a licensed financial advisor before making investment decisions. Pine Script®指标由AlphaFox-Traders提供3
Risk-Managed StrategyRisk-Managed Strategy is a complete algorithmic trading framework that blends multiple technical systems—RSI, MACD, EMA crossover, Bollinger Bands, and SuperTrend—into a unified signal engine. The script dynamically calculates position size based on capital, risk percentage, ATR-based stop loss, and reward-ratio targets. It features: -Multi-indicator signal voting (BUY / SELL / NEUTRAL) - Dynamic capital tracking across trades - Automatic position sizing based on risk amount - Auto-generated Stop Loss and Take Profit using recent highs/lows - On-chart SL, TP, and CMP plotting for clarity This strategy is designed for traders who want a professional, rule-based system that balances accuracy, risk control, and automation. Disclaimer: The information provided is for educational and informational purposes only. It does not constitute financial or investment advice. Trading and investing in stocks involves risk, including the possible loss of capital. Any decisions to buy, sell, or hold securities are the sole responsibility of the reader. Past performance is not indicative of future results. Always do your own research and, if necessary, consult with a licensed financial advisor before making investment decisions. Pine Script®策略由AlphaFox-Traders提供4
Scout Regiment - D17# Scout Regiment - D17 Indicator ## English Documentation ### Overview Scout Regiment - D17 is a comprehensive TradingView indicator that combines multiple technical analysis tools into one powerful overlay indicator. It provides traders with market structure analysis, divergence detection, volume profiling, smart money concepts, and session analysis. ### Key Features #### 1. **EMA (Exponential Moving Averages)** - **Purpose**: Trend identification and dynamic support/resistance levels - **Configuration**: 13 customizable EMAs with adjustable periods - **Default Active EMAs**: EMA 3 (21), EMA 5 (55), EMA 7 (144), EMA 8 (233) - **Uses**: Identify trend direction, entry/exit points, and trend strength - **Color Coding**: Different colors for easy visual distinction #### 2. **TFMA (Timeframe Moving Averages)** - **Purpose**: Multi-timeframe trend analysis - **Features**: - 3 EMAs on higher timeframes - Dynamic labels showing trend direction - Price difference percentage display - Customizable timeframe settings - **Default Settings**: 21-period timeframe with lengths 55, 144, and 233 - **Benefits**: Align trades with higher timeframe trends #### 3. **DFMA (Daily Frame Moving Averages)** - **Purpose**: Daily timeframe perspective on any chart - **Features**: Similar to TFMA but specifically for daily analysis - **Default Timeframe**: 1D (Daily) - **Use Case**: Long-term trend confirmation and positioning #### 4. **PMA (Price Moving Averages)** - **Purpose**: Price channel analysis with filled areas - **Configuration**: 7 customizable moving averages with fill zones - **Default Lengths**: 12, 144, 169, 288, 338, 576, 676 - **Visual**: Color-filled zones between selected MAs for channel trading #### 5. **VWAP (Volume Weighted Average Price)** - **Purpose**: Institutional trading levels and fair value - **Features**: - Multiple anchor periods (Session, Week, Month, Quarter, Year, etc.) - Standard deviation bands - Corporate event anchoring (Earnings, Dividends, Splits) - **Use Case**: Identify institutional support/resistance and mean reversion opportunities #### 6. **Divergence Detector** - **Purpose**: Identify potential trend reversals - **Supported Indicators**: MACD, MACD Histogram, RSI, Stochastic, CCI, Williams %R, Bias, Momentum, OBV, SOBV, VWmacd, CMF, MFI, and external indicators - **Divergence Types**: - Regular Bullish/Bearish - Hidden Bullish/Bearish - **Features**: - Automatic divergence line drawing - Customizable detection parameters - Color-coded alerts #### 7. **Volume Profile & Node Detection** - **Purpose**: Identify key price levels based on volume distribution - **Features**: - Volume Profile with POC (Point of Control) - Value Area High (VAH) and Value Area Low (VAL) - Peak and trough volume node detection - Highest/lowest volume node highlighting - **Lookback**: Configurable (default 377 bars) - **Use Case**: Identify support/resistance zones and liquidity areas #### 8. **Smart Money Concepts** - **Purpose**: Track institutional trading patterns - **Features**: - Market Structure (BOS - Break of Structure, CHoCH - Change of Character) - Internal and Swing structures - Strong/Weak Highs and Lows - Equal Highs/Lows detection - Fair Value Gaps (FVG) - **Modes**: Historical or Present (latest only) - **Use Case**: Trade with institutional flow #### 9. **Trading Sessions** - **Purpose**: Analyze market behavior during different global sessions - **Available Sessions**: - Asian Session - Sydney, Tokyo, Shanghai, Hong Kong - European Session - London, New York, NYSE - **Features**: - Session boxes with high/low visualization - Real-time countdown timers - Volume and price change tracking - Information table with session statistics - **Customization**: Choose which sessions to display, colors, and box styles ### How to Use #### For Trend Following: 1. Enable EMAs 3, 5, 7, and 8 2. Use TFMA for higher timeframe confirmation 3. Look for price above/below key EMAs for trend direction 4. Use VWAP as additional confirmation #### For Reversal Trading: 1. Enable Divergence Detector with MACD Histogram and Bias 2. Look for divergences at key support/resistance levels 3. Confirm with Smart Money CHoCH signals 4. Use Volume Profile nodes as entry/exit targets #### For Intraday Trading: 1. Enable Trading Sessions 2. Focus on high-volume sessions (London, New York overlap) 3. Use session highs/lows as support/resistance 4. Trade Fair Value Gaps during active sessions #### For Swing Trading: 1. Use DFMA for daily trend 2. Enable PMA for channel identification 3. Look for price reactions at volume profile value areas 4. Confirm with swing structure breaks ### Best Practices 1. **Don't Overcrowd**: Enable only the components you need for your strategy 2. **Multi-Timeframe Analysis**: Always check higher timeframe TFMA/DFMA 3. **Confluence**: Look for multiple signals confirming the same direction 4. **Volume Confirmation**: Use Volume Profile to validate price action 5. **Session Awareness**: Be aware of which session is active for volatility expectations ### Performance Optimization - Disable unused features to improve chart loading speed - Use "Present Mode" for Smart Money Concepts if historical data isn't needed - Reduce Volume Profile lookback period on slower devices ### Alerts The indicator includes alert conditions for: - All divergence types (8 conditions) - Smart Money structure breaks (8 conditions) - Equal highs/lows detection - Fair Value Gaps formation --- ## 中文说明文档 ### 概述 Scout Regiment - D17 是一款综合性TradingView指标,将多个技术分析工具整合到一个强大的叠加指标中。它为交易者提供市场结构分析、背离检测、成交量分析、聪明钱概念和时区分析。 ### 核心功能 #### 1. **EMA(指数移动平均线)** - **用途**:趋势识别和动态支撑阻力位 - **配置**:13条可自定义周期的EMA - **默认启用**:EMA 3(21)、EMA 5(55)、EMA 7(144)、EMA 8(233) - **应用**:识别趋势方向、进出场点位和趋势强度 - **颜色编码**:不同颜色便于视觉区分 #### 2. **TFMA(时间框架移动平均线)** - **用途**:多时间框架趋势分析 - **特点**: - 3条更高时间框架的EMA - 显示趋势方向的动态标签 - 价格差异百分比显示 - 可自定义时间框架设置 - **默认设置**:21周期时间框架,长度为55、144和233 - **优势**:使交易与更高时间框架趋势保持一致 #### 3. **DFMA(日线框架移动平均线)** - **用途**:在任何图表上提供日线时间框架视角 - **特点**:与TFMA类似,但专门用于日线分析 - **默认时间框架**:1D(日线) - **使用场景**:长期趋势确认和定位 #### 4. **PMA(价格移动平均线)** - **用途**:价格通道分析与填充区域 - **配置**:7条可自定义的移动平均线,带填充区域 - **默认长度**:12、144、169、288、338、576、676 - **视觉效果**:选定MA之间的彩色填充区域,用于通道交易 #### 5. **VWAP(成交量加权平均价格)** - **用途**:机构交易水平和公允价值 - **特点**: - 多个锚定周期(交易日、周、月、季度、年等) - 标准差波段 - 企业事件锚定(财报、分红、拆股) - **使用场景**:识别机构支撑阻力和均值回归机会 #### 6. **背离检测器** - **用途**:识别潜在趋势反转 - **支持指标**:MACD、MACD柱状图、RSI、随机指标、CCI、威廉指标、乖离率、动量、OBV、SOBV、VWmacd、CMF、MFI及外部指标 - **背离类型**: - 常规看涨/看跌背离 - 隐藏看涨/看跌背离 - **特点**: - 自动绘制背离连线 - 可自定义检测参数 - 颜色编码警报 #### 7. **成交量分布与节点检测** - **用途**:基于成交量分布识别关键价格水平 - **特点**: - 成交量分布图与POC(控制点) - 价值区域高点(VAH)和低点(VAL) - 峰值和低谷成交量节点检测 - 最高/最低成交量节点突出显示 - **回溯期**:可配置(默认377根K线) - **使用场景**:识别支撑阻力区域和流动性区域 #### 8. **聪明钱概念** - **用途**:追踪机构交易模式 - **特点**: - 市场结构(BOS-突破结构、CHoCH-结构转变) - 内部和摆动结构 - 强/弱高低点 - 等高/等低检测 - 公允价值缺口(FVG) - **模式**:历史模式或当前模式(仅最新) - **使用场景**:跟随机构资金流动交易 #### 9. **交易时区** - **用途**:分析不同全球时段的市场行为 - **可用时段**: - 亚洲时段 - 悉尼、东京、上海、香港 - 欧洲时段 - 伦敦、纽约、纽交所 - **特点**: - 时段方框显示高低点 - 实时倒计时 - 成交量和价格变化追踪 - 时段统计信息表格 - **自定义**:选择显示哪些时段、颜色和方框样式 ### 使用方法 #### 趋势跟随策略: 1. 启用EMA 3、5、7和8 2. 使用TFMA进行更高时间框架确认 3. 观察价格在关键EMA上方/下方确定趋势方向 4. 使用VWAP作为额外确认 #### 反转交易策略: 1. 启用背离检测器(MACD柱状图和乖离率) 2. 在关键支撑阻力位寻找背离 3. 用聪明钱CHoCH信号确认 4. 使用成交量分布节点作为进出场目标 #### 日内交易策略: 1. 启用交易时区 2. 关注高成交量时段(伦敦、纽约重叠时段) 3. 使用时段高低点作为支撑阻力 4. 在活跃时段交易公允价值缺口 #### 波段交易策略: 1. 使用DFMA确定日线趋势 2. 启用PMA识别通道 3. 观察价格在成交量分布价值区域的反应 4. 用摆动结构突破确认 ### 最佳实践 1. **避免过度拥挤**:仅启用策略所需的组件 2. **多时间框架分析**:始终检查更高时间框架的TFMA/DFMA 3. **汇合点**:寻找多个信号确认同一方向 4. **成交量确认**:使用成交量分布验证价格行为 5. **时段意识**:了解当前活跃时段以预期波动性 ### 性能优化 - 禁用未使用的功能以提高图表加载速度 - 如果不需要历史数据,对聪明钱概念使用"当前模式" - 在较慢设备上减少成交量分布回溯期 ### 警报 指标包含以下警报条件: - 所有背离类型(8个条件) - 聪明钱结构突破(8个条件) - 等高/等低检测 - 公允价值缺口形成 --- ## Technical Support For questions or issues, please refer to the TradingView community or contact the indicator creator. ## 技术支持 如有问题,请参考TradingView社区或联系指标创建者。Pine Script®指标由lwmxmpyp提供已更新 30
BB Long/Short Signal SEZERBB ye göre aşırı hareket noktalarını algılayıp long-short sinyal üretir. Pine Script®指标由karabugulsezer提供11
CPA2 PROCrypto Professional Analyzer (CPA) - Instructions Purpose: CPA is a Multi-Factor Weighted System designed to confirm signals by analyzing three key areas simultaneously: Trend Alignment, Volume Support, and Momentum Strength. Signal Types: Strong Buy/Sell: Highest confidence signals, confirmed by all major factors. Buy/Sell: Standard signals, confirmed by the majority of factors. Key Features: Risk Flags: Look for PUMP, DUMP, or FAKE (Fake Breakout) alerts to avoid potential traps. Trend Health: Monitor the ribbon colors; they indicate the overall health and direction of the EMA trend alignment. Risk Management: Use the plotted TP1 and TP2 levels (Take Profits) for planning your exits. Pro-Tip: Adjust the 'Risk Level' setting in the indicator inputs to filter signals (e.g., set to 'Low' for stricter signal requirements).Pine Script®指标由innoalgos提供77661
RSI Divergence (Regular + Hidden, @darshakssc)This indicator detects regular and hidden divergence between price and RSI, using confirmed swing highs and swing lows (pivots) on both series. It is designed as a visual analysis tool, not as a signal generator or trading system. The goal is to highlight moments where price action and RSI momentum move in different directions, which some traders study as potential early warnings of trend exhaustion or trend continuation. All divergence signals are only drawn after a pivot is fully confirmed, helping to avoid repainting. The script supports four divergence types: Regular Bullish Divergence Regular Bearish Divergence Hidden Bullish Divergence Hidden Bearish Divergence Each type is drawn with a different color and labeled clearly on the chart. Core Concepts Used 1. RSI (Relative Strength Index) The script uses standard RSI, calculated on a configurable input source (default: close) and length (default: 14). RSI is treated purely as a momentum oscillator – the script does not enforce oversold/overbought interpretations. 2. Pivots / Swings The indicator defines swing highs and swing lows using ta.pivothigh() and ta.pivotlow(): A swing high forms when a bar’s high is higher than a specified number of bars to the left and to the right. A swing low forms when a bar’s low is lower than a specified number of bars to the left and to the right. The same pivot logic is applied to both price and RSI. Because pivots require “right side” bars to form, the indicator: Waits for the full pivot to be confirmed (no forward-looking referencing beyond the rightBars parameter). Only then considers that pivot for divergence detection. This helps prevent repainting of divergence signals. How Divergence Is Detected The script always uses the two most recent confirmed pivots for both price and RSI. It tracks: Last two swing lows in price and RSI Last two swing highs in price and RSI Their pivot bar indexes and values A basic minimum distance filter between the pivots (in bars) is also applied to reduce noise. 1. Regular Bullish Divergence Condition: Price makes a lower low (LL) between the last two lows RSI makes a higher low (HL) over the same two pivot lows The RSI difference between the two lows is greater than or equal to the user-defined minimum (Min RSI Difference) The two low pivots are separated by at least Min Bars Between Swings Interpretation: Some traders view this as bearish momentum weakening while price prints a new low. The script only marks this structure; it does not assume any outcome. On the chart: Drawn between the previous and current price swing lows Labeled: “Regular Bullish” Color: Green (by default in the script) 2. Regular Bearish Divergence Condition: Price makes a higher high (HH) between the last two highs RSI makes a lower high (LH) over the same two pivot highs RSI difference exceeds Min RSI Difference Pivots are separated by at least Min Bars Between Swings Interpretation: Some traders see this as bullish momentum weakening while price prints a new high. Again, the indicator simply highlights this divergence. On the chart: Drawn between the previous and current price swing highs Labeled: “Regular Bearish” Color: Red 3. Hidden Bullish Divergence Condition: Price makes a higher low (HL) between the last two lows RSI makes a lower low (LL) over the same two lows RSI difference exceeds Min RSI Difference Pivots meet the minimum distance requirement Interpretation: Some traders interpret hidden bullish divergence as a potential trend continuation signal within an existing uptrend. The indicator does not classify trends; it just tags the pattern when price and RSI pivots meet the conditions. On the chart: Drawn between the previous and current price swing lows Labeled: “Hidden Bullish” Color: Teal 4. Hidden Bearish Divergence Condition: Price makes a lower high (LH) between the last two highs RSI makes a higher high (HH) over those highs RSI difference exceeds Min RSI Difference Pivots meet the minimum distance filter Interpretation: Some traders associate hidden bearish divergence with potential downtrend continuation, but again, this script only visualizes the structure. On the chart: Drawn between the previous and current price swing highs Labeled: “Hidden Bearish” Color: Orange Inputs and Settings 1. RSI Settings RSI Source – Price source for RSI (default: close). RSI Length – Period for RSI calculation (default: 14). These control the responsiveness of the RSI. Shorter lengths may show more frequent divergence; longer lengths smooth the signal. 2. Swing / Pivot Settings Left Swing Bars (leftBars) Right Swing Bars (rightBars) These define how strict the pivot detection is: Higher values → fewer, more significant swings Lower values → more swings, more signals Because the script uses ta.pivothigh / ta.pivotlow, a pivot is only confirmed once rightBars candles have closed after the candidate bar. This is an intentional design to reduce repainting and make pivots stable. 3. Divergence Filters Min Bars Between Swings (Min Bars Between Swings) Requires a minimum bar distance between the two pivots used to form divergence. Helps avoid clutter from pivots that are too close to each other. Min RSI Difference (Min RSI Difference) Requires a minimum absolute difference between RSI values at the two pivots. Filters out very minor changes in RSI that may not be meaningful. 4. Visibility Toggles Show Regular Divergence Show Hidden Divergence You can choose to display: Both regular and hidden divergence, or Only regular divergence, or Only hidden divergence This is useful if you prefer to focus on one type of structure. 5. Alerts Enable Alerts When enabled, the script exposes four alert conditions: Regular Bullish Divergence Confirmed Regular Bearish Divergence Confirmed Hidden Bullish Divergence Confirmed Hidden Bearish Divergence Confirmed Each alert fires after the corresponding divergence has been fully confirmed based on the pivot and bar confirmation logic. The script does not issue rapid or intrabar signals; it uses confirmed historical conditions. You can set these in the TradingView Alerts dialog by choosing this indicator and selecting the desired condition. Visual Elements On the main price chart, the indicator: Draws a line between the two price pivots involved in the divergence. Adds a small label at the latest pivot, describing the divergence type. Colors are used to differentiate divergence categories (Green/Red/Teal/Orange). This makes it easy to visually scan the chart for zones where price and RSI have diverged. What to Look For (Analytical Use) This indicator is intended as a visual helper, especially when: You want to quickly see where price made new highs or lows while RSI did not confirm them in the same way. You are studying momentum exhaustion, shifts, or continuation using RSI divergence as one of many tools. You want to compare divergence occurrences across different timeframes or instruments. Important: The indicator does not tell you when to enter or exit trades. It does not rank or validate the “quality” of a divergence. Divergence can persist or fail; it is not a guarantee of reversal or continuation. Many traders combine divergence analysis with: Higher timeframe context Trend filters (moving averages, structure) Support/resistance zones or liquidity areas Volume, structure breaks, or other confirmations Disclaimer This script is provided for educational and analytical purposes only. It does not constitute financial advice, trading advice, or investment recommendations. No part of this indicator is intended to suggest, encourage, or guarantee any specific trading outcome. Users are solely responsible for their own decisions and risk management.Pine Script®指标由darshakssc提供已更新 1212695
Correa del perroCalcula la distancia entre el precio y su media móvilPine Script®指标由soypepediaz提供1118
Institutional Demand SpotterInstitutional Demand Spotter( 50d average *1.5 > ) Pine Script®指标由leetaegoo94提供3
Multi-Timeframe Stochastic (4x) z Podświetlaniem - PawelA script that provides information when most of the stocks are in the overbought or oversold zone.Pine Script®指标由ZawodSpekulant提供9
Liquidity Sweep & Reversal MapLiquidity Sweep & Reversal Map (LSRM) is a visual tool designed to help traders study how price interacts with key liquidity areas such as daily highs, daily lows, previous-day levels, and potential sweep zones. Its purpose is to map structure, highlight volatility around major reference points, and visualize how price behaves after taking liquidity. This indicator does not attempt to predict market direction. It simply identifies conditions where price has interacted with a known reference level and marks that interaction for user analysis. 🔍 What This Indicator Shows 1. Key Liquidity Reference Levels The script automatically draws and updates the following levels: TH — Today’s High TL — Today’s Low PDH — Previous Day High PDL — Previous Day Low These levels are widely monitored by many traders and can be helpful when studying liquidity behavior and intraday volatility. 2. Liquidity Sweeps A liquidity sweep occurs when: Price briefly moves beyond a major high or low And then closes back within the prior range The indicator marks detected sweep interactions with: BS (Bullish Sweep) when liquidity is taken below a low SS (Bearish Sweep) when liquidity is taken above a high A sweep only appears after the bar has closed, helping users analyze completed price structure. 3. Optional Sweep Zones When enabled, the tool draws a shaded zone between: The swept wick The reference level This can help highlight areas where liquidity was taken. 4. Volume & Candle Filters The indicator includes optional filters such as: Relative volume spikes Strong candle body requirement These filters are provided only to refine the visual highlight of sweeps; they do not constitute trading signals. 🎛 Customization Users can configure: Instrument presets Sweep buffers Volume sensitivity Line visibility and thickness Label display Zone visibility All settings are optional and intended for chart annotation only. ⚠️ Important Notes This tool is not a trading system, signal generator, or strategy. It does not provide buy/sell advice or predict future price movement. All markings are visual aids for chart study and structural analysis only. Users should rely on their own judgment and independent analysis when making trading decisions. Pine Script®指标由darshakssc提供59
Vince/Williams Market Internals SuiteThis indicator is a powerhouse combination of three distinct market internal strategies developed by Ralph Vince and Larry Williams. Instead of using three separate scripts to monitor market health, this tool consolidates them into a single dashboard that analyzes NYSE "New Lows" data to detect structural rot, capitulation, and crash risks. The first component is the Volatility Vulnerability monitor, which identifies when the market structure is decaying. It looks for an extended period where the number of New Lows fails to drop to negligible levels. If you see an Orange Circle while price is above the 50 SMA, it is a major warning that the uptrend is hollow and prone to a crash. Conversely, a Blue Circle below the 50 SMA suggests the weakness is already priced in, offering a contrarian entry signal. The second component is the Selling Climax signal. This identifies moments of pure terror where New Lows hit extreme levels (default 20%). The script marks these panic days with Orange Diamonds, but the real value is the Green Diamond that appears immediately when the panic subsides, often signaling a sharp V-bottom. Finally, the Bloodbath Rule runs in the background as a defensive filter. When the background turns red (marked by a Red Cross), it means New Lows have breached the "danger" threshold (default 4%). During these periods, internal selling pressure is accelerating, and you should strictly avoid entering new long positions until the background clears. Note: This script relies on broad market data (ADVN/DECN/LOWN) and works best on Daily timeframes.Pine Script®指标由suresh789提供已更新 9
Simple VP Shape DetectorSimple VP Shape Detector is a lightweight Pine Script tool designed to help traders quickly identify the four major Volume Profile shapes commonly used in orderflow and auction-market theory: D-Shape (Balanced Profile) P-Shape (Short-Covering / Buyer-Dominant) B-Shape (Long-Liquidation / Seller-Dominant) Thin Profile (Trend Profile) This indicator uses candle statistics (range, body size, volume distribution approximation, and directional movement) to estimate the underlying shape of the volume profile when the full Volume Profile tool is not available. ✔️ What this indicator does Analyzes recent bars to estimate volume concentration vs. price movement Flags possible VP shapes using simple logic Displays labels above/below candles showing: “D” → Balanced “P” → Buyer-heavy “B” → Seller-heavy “T” → Trending / Thin profile Helps traders quickly identify auction conditions ✔️ Why this is useful Volume Profile tools require premium data or heavy visual processing. This script provides a simple, fast, CPU-light alternative that still captures the essential behavior of profile shapes. ✔️ How shapes are detected D-Shape: small directional movement + larger body clustering P-Shape: strong upward move + volume weighted to upper half B-Shape: strong downward move + volume weighted to lower half Thin: long range candles with little internal consolidation ⚠️ Disclaimer This script is an approximation. It does NOT replace full Volume Profile tools. It is designed as an educational / supplemental tool for market structure analysis.Pine Script®指标由YUHUNGTsai提供14
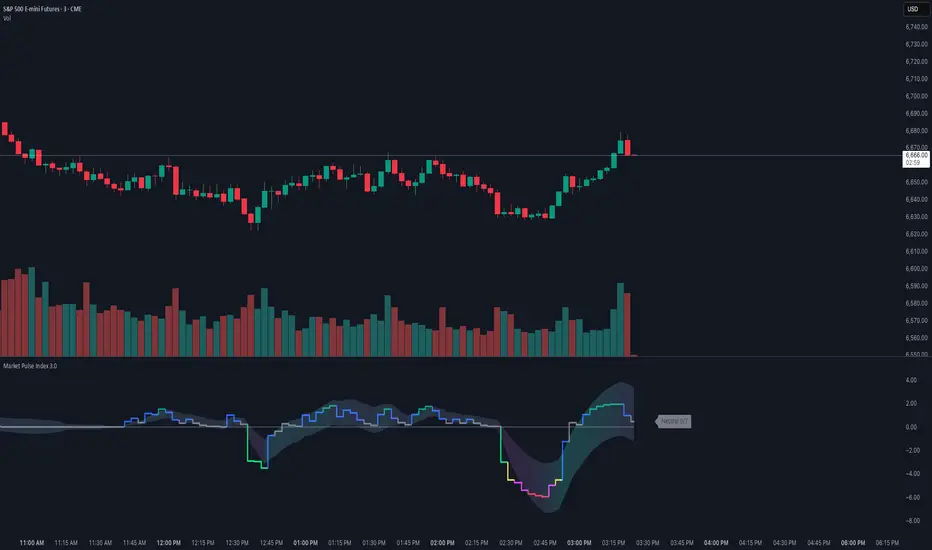
Market Pulse IndexOverview Market Pulse Index condenses intraday market breadth into a single, color-coded score from -7 to +7 on intraday timeframe charts. It analyzes gap behavior and the markets internals into a single “pulse” line with an optional adaptive envelope that reacts to session volatility. Designed for U.S. regular hours (09:30–16:00 ET), it actively highlights real-time regime shifts. Unified Sentiment Score (-7…+7): Fast, visual proxy for broad intraday risk-on/off. Intraday Session Awareness: Resets logic and envelopes each cash session; plots during 09:30–15:55 ET. Gap Regime Intelligence Internals: VOLD, ADD, NYSE TICK Momentum, NASDAQ TICK Momentum, TICK Counter, and UVOL/DVOL. Filtered vs. Raw Data Modes: Choose smoother Filtered (dynamic moving average) or immediate raw data for maximum responsiveness. Adaptive Envelope: Session-aware bands with gradient fill that reflects trend acceleration/deceleration. Configurable Visuals: Pick Bull/Bear colors and envelope transparency; non-overlay pane keeps price clean. Calculation Timeframe Override: Optionally compute on a fixed TF (e.g., 5m) while viewing any chart TF. Conclusion Market Pulse Index bridges multiple intraday breadth streams into one decisive line—ideal for confirming bias, filtering setups, and spotting regime transitions. Use the score and envelope together: strong positive readings with expanding envelope favor risk-on continuation, while deep negatives with persistent breadth weakness warn of risk-off conditions. Pair with your entries, levels, and risk controls for a complete intraday framework.Pine Script®指标由EnsoAlphaChad提供18
TernTable: Crypto SectorsTernTables:CryptoSecs This was hung on my Sector ETFs script to see if I could filter some noise from crypto by applying a GICS (Global Industry Classification Standard) style sector model to the crypto markets. Crypto classification is certainly a little more nuanced so not completely straightforward. It was designed to filter a researched and organised view of generally recognised cryptocurrency sectors and their confirmed constituent components. The main purpose was a shot at displaying live crypto market data on my chart with instantaneous visual analysis, using leader laggard colour logic for performance indication, plus bullish bearish colour logic using the header for instant visual sector strength analysis. This was never going to be an exhaustive tool of course and amazingly only or two of the sector lists wont fit on your laptop screen without zooming but it’s UI versatility both in custom display and custom threshold functionality is very effective. Viewing a coin on your watchlist with its sector overlayed in the chart brings the optional visual alert function into consideration. All basic but all effective and all customisable Can't ignore the educational value either it’s teaching by osmosis what the sectors do and which coins go where clues to why. As an after thought - I added a live stock market filter for 20 sector-specific ETFs like SPY, QQQ, XLV, XLF, allowing the comparison of the live performance of traditional financial sectors to live crypto sector data without leaving your chart. Not certain how often it will need to be updated and any feedback re the legitimacy and accuracy of its components is kindly welcomed it is up to date at date of publishing. It’s pretty easy to use, here is a list what you're getting with sector classifications with brief descriptions CMC 20 CoinMarketCap Top 20: the largest cryptos by market cap. Great starting point to see what the overall market is doing ETFs All major U.S.-listed Bitcoin & Ethereum ETFs. Lets you compare crypto performance directly with traditional finance Layer 0 Foundational interoperability protocols (Polkadot, Cosmos, ICP, etc.). These are the “bridges” that allow different blockchains to communicate Layer 1 Independent base-layer blockchains that run their own consensus and security (Bitcoin, Ethereum, Solana, Cardano, TON, etc.). Layer 2 Scaling networks built on top of Layer 1s to increase speed and lower fees (Arbitrum, Optimism, Base, Polygon, zk-rollups, etc.) Layer 3 Application-specific chains or rollups designed for one purpose (gaming chains, DeFi-specific, social, etc.) Web3 The “ownership internet”: gaming tokens, NFTs, metaverse land, music/streaming platforms, social tokens, and creator-economy projects DeFi Decentralised Finance: lending platforms, decentralized exchanges, derivatives, yield aggregators, and insurance protocols Decentralised Storage Blockchain-based alternatives to AWS/Google Cloud (Filecoin, Arweave, Storj, etc.) Oracles Data providers that feed off-chain information (prices, weather, sports results) into smart contracts Privacy Privacy coins and protocols that obfuscate transaction details (Monero, Zcash, Beam, etc.) Yield & Lending Protocols focused purely on lending, borrowing, and yield generation DEX Pure decentralized exchanges (Uniswap, SushiSwap, Jupiter, GMX, etc.) DAO Governance tokens of major decentralized autonomous organizations (Maker, Lido, Aave, ENS, etc.) Infrastructure / Middleware The picks-and-shovels layer: node services, RPC providers, indexing, cross-chain bridges, etc Real World Assets (RWA) Tokenised traditional assets: treasuries, real estate, private credit, stablecoins backed by real-world collateral Restaking & Liquid Restaking EigenLayer ecosystem and liquid-restaking tokens (eigen, ether.fi, Pendle, etc.). Currently the fastest-growing narrative Traditional Sector ETFs Classic U.S. sector ETFs (SPY, QQQ, XLF, XLE, XLV, XLY, etc.). Extra layer of analysis by comparing live stock market conditions with livecrypto market conditions A list of the UI Toggles * Sector Dropdown • Select Sector: Choose the sector to display (e.g., CMC 20, Layer 1, DeFi, etc.) * Custom Tickers • Enter Tickers: Input custom coin tickers (e.g., BTCUSD, ETHUSD) to track specific assets * Show % Change Row • Toggle On/Off: Display the % change row for each sector/coin * Show Current Price Row • Toggle On/Off: Display the current price for each sector/coin * Show Price-Diff Row • Toggle On/Off: Display the price difference (current price - previous day's price) * Show Spacer Row • Toggle On/Off: Add a spacer row between data rows for clarity * Table Position • Select Position: Choose the position of the data table on your chart (Top Left, Top Right, etc.) Visual Options: * Show Sector Name • Toggle On/Off: Display the sector name pane label on chart * Custom Bull/Bear Threshold • Toggle On/Off: Set a custom threshold for bullish/bearish sector performance • Threshold (%): Set the percentage threshold (e.g., 50%) for bullish/bearish classification * Show Live % in Header • Toggle On/Off: Display the live percentage change in the table header * Dynamic Decimal Formatting • Toggle On/Off: Enable dynamic formatting for numbers display. * Sort by % Change • Toggle On/Off: Sort sectors by % change in performance * Enable Alerts • Toggle On/Off: Enable alerts based on performance thresholds * Alert Threshold (%) • Set Threshold: Define the percentage threshold (e.g.,70%) for triggering alerts * Cooldown (bars) • Toggle On/Off: Enable cooldown to prevent alerts from triggering too quickly • Cooldown Duration: Set the cooldown period in bars (e.g., 10 bars) * % Threshold Mode • Toggle On/Off: Enable % Threshold Mode to filter sectors based on a percentage change threshold • Threshold %: Set the percentage for filtering sectors (e.g., only show sectors with > 5% change) A lot of toggles probably left once favourites are set but this UI interface does allow experimentation with the utility of channelling raw live data through custom designed filters. Just saying ! I need to include this of course This indicator provides sector-based organisation and real-time performance visualisation for cryptocurrencies. It is not intended to predict price movements or guarantee outcomes. Crypto assets carry significant risk, including loss of capital. Past performance does not guarantee future results. All data and sector classifications are best-effort and may be incomplete, inaccurate, or outdated. Nothing in this script should be interpreted as financial advice. You are solely responsible for your own trading decisions. That’s it really, I am currently pleased with how this indicator turned out, if you have a crypto trading toolkit put this in it. Pine Script®指标由Edgear提供已更新 4
Percentage Distance from 200-Week SMA200-Week SMA % Distance Oscillator (Clean & Simple) This lightweight, no-nonsense indicator shows how far the current price is from the classic 200-week Simple Moving Average, expressed as a percentage. Key features: • True percentage distance: (Price − 200w SMA) / 200w SMA × 100 • Auto-scaling oscillator (no forced ±100% range → the line actually moves and looks alive) • Clean zero line • +10% overbought and −10% oversold levels with subtle background shading • Real-time table showing the exact current percentage • Small label on the last bar for instant reading • Alert conditions when price moves >10% above or below the 200-week SMA Why 200-week SMA? Many legendary investors and hedge funds (Stan Druckenmiller, Paul Tudor Jones, etc.) use the 200-week SMA as their ultimate long-term trend anchor. Being +10% or more above it has historically signaled extreme optimism, while −10% or lower has marked deep pessimism and generational buying opportunities. Perfect for Bitcoin, SPX, gold, individual stocks – works on any timeframe (looks especially good on daily and weekly charts). Open-source • No repainting • Minimalist & fast Enjoy and trade well!Pine Script®指标由notoriousBlue提供3
RED-E Index and ETF ConverterThis indicator provides real-time conversion between major US stock market indices and their corresponding ETFs, displaying current prices, calculated conversions, and market sentiment in an easy-to-read dashboard format. WHAT IT DOES: Tracks three major index-ETF pairs and shows bi-directional conversions: SPX (S&P 500 Index) ↔ SPY (SPDR S&P 500 ETF) NDX (NASDAQ-100 Index) ↔ QQQ (Invesco QQQ ETF) RUT (Russell 2000 Index) ↔ IWM (iShares Russell 2000 ETF) HOW IT WORKS: The script uses request.security() to fetch real-time price data from each instrument and applies standard conversion ratios: SPX to SPY: ~1:10 ratio NDX to QQQ: ~1:40 ratio RUT to IWM: ~1:10 ratio Market sentiment is determined by comparing current price to previous bar, displaying BULLISH (green ▲), BEARISH (red ▼), or NEUTRAL (gray ●). KEY FEATURES: Real-time price tracking for all six instruments Bi-directional conversion calculations Visual sentiment indicators based on price movement Customizable dashboard position Adjustable font sizes Toggle individual index pairs on/off Color-coded sections Clean professional table layout USAGE: Add the indicator to any chart. The dashboard will display in the bottom left corner by default. Use the settings to: Change dashboard position Adjust font size Show/hide specific index-ETF pairs Customize sentiment colors This tool is useful for traders who: Trade both indices and ETFs Want to quickly compare index vs ETF pricing Monitor multiple market segments simultaneously Need at-a-glance sentiment across major indices Note: Conversion ratios are approximate and based on standard tracking ratios. Actual ETF prices may vary slightly due to tracking error, fees, and market conditions. Disclaimer: This indicator is for educational and informational purposes only. It does not constitute financial advice. The creator is not a financial advisor, and users should consult with a licensed financial professional before making any investment decisions. Use at your own risk.Pine Script®指标由rogers1906提供25
Sector Performance (2x12 Grid, labeled)Sector Performance Dashboard that tracks short-term and multi-interval returns for 24 major U.S. market ETFs. It renders a clean, color-coded performance grid directly on the chart, making sector rotation and broad-market strength/weakness easy to read at a glance. The dashboard covers t wo full rows of liquid U.S. sector and thematic ETFs, including: Row 1 (Core Market + GICS sectors) SPY, QQQ, IWM, XLF, XLE, XLRE, XLY, XLU, XLP, XLI, XLV, XLB Row 2 (Extended industries / themes) XLF, XBI, XHB, CLOU, XOP, IGV, XME, SOXX, DIA, KRE, XLK, VIX (VX1!) Key features include: Time-interval selector (1–60 min, 1D, 1W, 1M, 3M, 12M) Automatic rate-of-return calculation with inside/outside-bar detection Two-row, twelve-column grid with dynamic layout anchoring (top/middle/bottom + left/center/right) Uniform white text for clarity, while inside/outside candles retain custom colors Adaptive transparency rules (heavy/avg/light) based on magnitude of % change Ticker label normalization (cleans up prefixes like “CBOE_DLY:”) Pine Script®指标由nonjene33提供已更新 36
Market Breadth Decision HelperMarket Breadth Decision Helper (NYSE/NASDAQ VOLD, ADD, TICK) Combines NYSE VOLD, NASDAQ VOLD (VOLDQ), NYSE/NASDAQ ADD, and TICK into a single intraday dashboard for tactical bias and risk management. Tiered pressure scale (sign shows direction, abs(tier) shows intensity): 0 = Neutral, 1 = Mild, 2 = Strong, 3 = Severe, 4 = Panic. On-chart legend makes this explicit. Table view highlights value, tier, bull/bear point contributions, and notes (PANIC, OVERRIDE, DIVERGENCE). VOLD and ADD panic trigger “stand down”; VOLD ±2 triggers bull/bear overrides; NYSE vs NASDAQ ADD divergence triggers “scalp only.” Bull/bear points: VOLD 2 pts, ADD NYSE 2 pts, ADD NASDAQ 1 pt, TICK 1 pt. ≥3 pts on a side lifts that side’s multiplier to 1.5. Bias flips Bullish/Bearish only if a side leads and has ≥2 pts; otherwise Neutral. Breadth modes: PANIC_NO_TRADE → DIVERGENCE_SCALP_ONLY → VOLD_OVERRIDE_BULL/BEAR → NORMAL/NO_EDGE. Intraday context: tracks current session day_high / day_low for the chart symbol. JSON/Alert export (optional) sends raw values plus *_tier and *_tier_desc labels (NEUTRAL/MILD/STRONG/SEVERE/PANIC) with sign/magnitude hints, so agents/bots never have to guess what “1 vs 2 vs 3 vs 4” mean. Customizable bands for VOLD/ADD/TICK, table styling, label placement, and dashboard bias input to align with higher-timeframe context. Best use Quick read on internal participation and pressure magnitude. Guardrails: respect PANIC and overrides; treat divergence as “scalp only.” Pair with your strategy entries; let breadth govern when to press, scale back, or stand down. Symbols (defaults) VOLD (NYSE volume diff), VOLDQ (NASDAQ volume diff), ADD (NYSE), ADDQ (NASDAQ), TICK (NYSE). Adjust in Inputs as needed. Alerts Panic, divergence, strong bullish/bearish breadth. Enable JSON export to feed algo/agent workflows.Pine Script®指标由SaltyCod提供已更新 20
🔰BGL Algo Break out and Trend Indicator publicdesigned for public use no charges identifying chart trendsPine Script®指标由TrendScalperwithAI提供250
EMA Trend Alignment (10/20/50) with MTF & SignalsBullish Crossovers 10>20>50 and Bearish Crossover 10<20<50Pine Script®指标由saldivarm227提供6
🔰BGL Algo Trendline filterfor all with trendline filter identifies the trendPine Script®指标由TrendScalperwithAI提供71
Mag 8 ± VWAP AlertI have been following Mag 7 plus Avgo for directional indicators for overall market. This is a chart that displays those over or under vwap and alerts can be added, ie 4 of 8 are under vwap, etc. Pine Script®指标由Jones516提供5