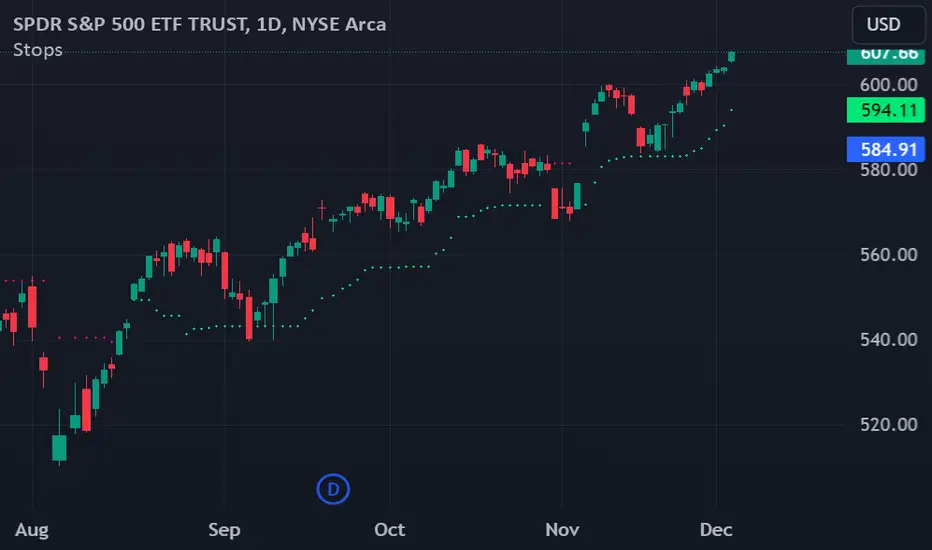
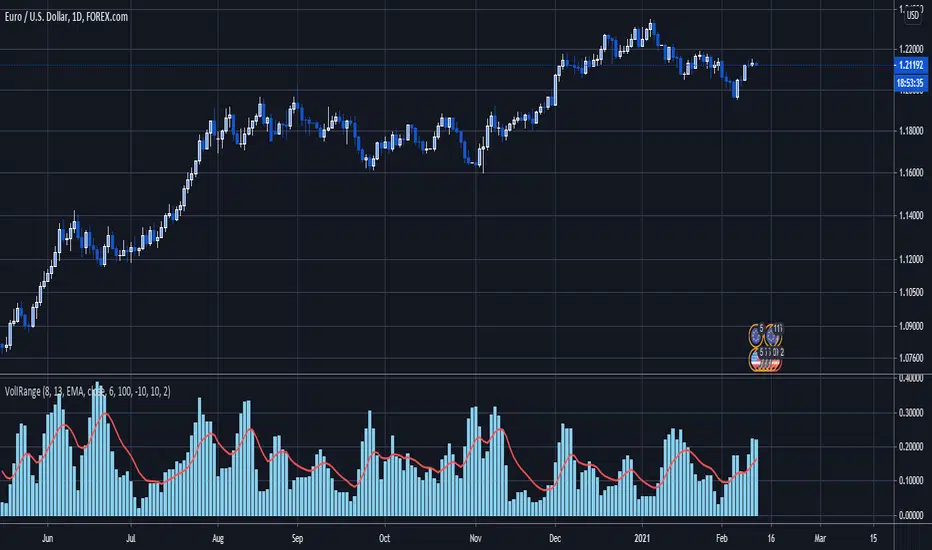
Chande Volatility-Based Trailing Stops This indicator is developed from a description outlined in the Chande - Kroll book, "The New Technical Trader". It is designed to help control risk by plotting two lines that function as long and short trailing stops.
How does it work?
"These stops are derived from recent highest high or lowest low. They adjust based on volatility. However, to avoid giving up a sizable chunk of profit before the stop is hit, it is modified in such a way that the stop can only advance with price, not retreat. This will lock in a greater portion of potential profits..."
Settings:
The default settings are those described in the book. They are described as being best for intermediate term trades. Use the multiplier to tighten or loosen the stop. A smaller multiplier will result in tighter stops. It is recommended to adjust this value for your preferred timeframe. You can toggle the trailing stop lines on or off as well as cross over marker.
Chande
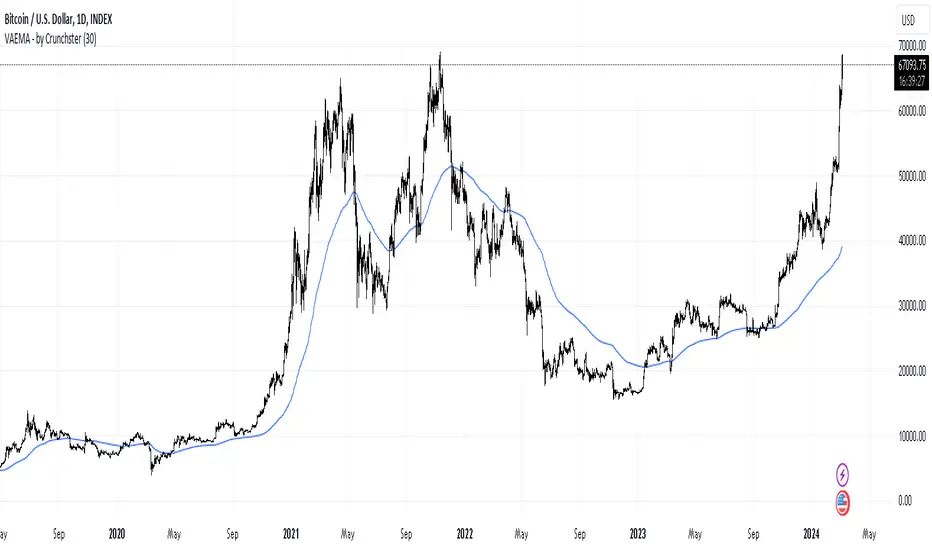
Volatility Adjusted EMA - by CrunchsterApplies recent volatility adjustment to the exponential moving average, where the smoothing factor is 2/(N + 1) - N being the lookback period or span
Volatility of recent 30 days returns is calculated using standard deviation with a thirty day lookback.
Increased smoothing compared to a standard EMA, which also adjusts to market conditions, as first described by Chande in 1991.
Activity & Chop ScoreRelease Notes:
The Activity and Chop Score was designed to help traders quickly determine if a market is active and/or choppy (not moving with any urgency). Slow and chopping markets should be approached with caution or avoided.
How does it work? The Activity Score incorporates momentum and the linear regression. Momentum (change in price over time) is compared over a long and short time period. Active markets are when those are moving together. This is combined with a linear regression of the price to determine the Correlation Coefficient (r^2) to measure of trend strength. The score is a is the average of the two momentum values, normalized by the standard deviation, and scaled by the trend (r^2 value). Chop is defined as divergence between long and short momentum periods. The divergences (chop) are quantified with a Jaccard Similarity Score, normalized by the standard deviation, and averaged to create a score.
How can you use it? This indicator is best used on lower timeframes. Activity Scores Values below 1 are considered low and values over 2 are high. Avoid markets where the Activity Score is below 1. There is an alert threshold in the options. Pivots are worth paying attention too as well as they indicate the start and stop of a recent move. You can compare markets or assets with the Chop Score. You make chose to avoid those with higher Chop Score. The position of the two lines relative to each other are useful. Ideally, the Activity Score is higher than the Chop Score. As with any indicators, it should be used in combination with others that best suits your trading style.

Weekday Change & Volume Average TableHaving a reference point for comparing with current data has always been an important task in market analysis. This script tried to give a better understanding based on weekdays.
This script shows that in the current ticker, what is the average movement of the price (High-Low) and volume for each weekday. Depending on the market and the exchange it should be different.
The Interesting point is that, for example in BINANCE:BTCUSDT , on Saturday and Sunday, volume is about 30% less and the price movement is about 20% less.
The script can be used on any timeframe and any symbol, just remember that the data shown is based on the candles on the chart, so it is different also based on your tradingview's account since Historical bars available for Basic is 5K, Pro & Pro+ is 10K and Premium is 20K; And in lower timeframes it is calculating more recent data.

Adaptive Fisherized CMOIntroduction
Heyo, here is another no-repaint adaptive fisherized indicator.
I added Inverse Fisher Transform, Ehlers dominant cycle analysis and smoothing to the Chande Momentum Oscillator (CMO).
Usage
The CMO is a momentum oscillator which shows the usual movement of an asset.
I recommend to use it from a lower timeframe with a higher timeframe set.
Signals
(Signal mode will come soon.)
Zero Line
CMO crosses above zero line => enter long
CMO cross below zero line => ente short
Overbought/Oversold
CMO crosses above bottom band => enter long
CMO crosses under top band => enter short
MA (Maybe this signals will vary. Then, check update notes.)
CMO crosses above MA => enter long
CMO crosses below MA => enter short
Enjoy and share your experience with it!
More to read: CMO Explanationsp

STD-Stepped VIDYA w/ Quantile Bands [Loxx]STD-Stepped VIDYA w/ Quantile Bands is a VIDYA moving average with Standard Deviation step filtering on either/neither/both price and VIDYA. Also included are quantile bands to identify breakouts/breakdowns/reversals.
What is VIDYA?
Variable Index Dynamic Average Technical Indicator ( VIDYA ) was developed by Tushar Chande. It is an original method of calculating the Exponential Moving Average ( EMA ) with the dynamically changing period of averaging.
What is Quantile Bands?
In statistics and the theory of probability, quantiles are cutpoints dividing the range of a probability distribution into contiguous intervals with equal probabilities, or dividing the observations in a sample in the same way. There is one less quantile than the number of groups created. Thus quartiles are the three cut points that will divide a dataset into four equal-size groups ( cf . depicted example). Common quantiles have special names: for instance quartile, decile (creating 10 groups: see below for more). The groups created are termed halves, thirds, quarters, etc., though sometimes the terms for the quantile are used for the groups created, rather than for the cut points.
q-Quantiles are values that partition a finite set of values into q subsets of (nearly) equal sizes. There are q − 1 of the q-quantiles, one for each integer k satisfying 0 < k < q. In some cases the value of a quantile may not be uniquely determined, as can be the case for the median (2-quantile) of a uniform probability distribution on a set of even size. Quantiles can also be applied to continuous distributions, providing a way to generalize rank statistics to continuous variables. When the cumulative distribution function of a random variable is known, the q-quantiles are the application of the quantile function (the inverse function of the cumulative distribution function) to the values {1/q, 2/q, …, (q − 1)/q}.
Included:
3 types of signal options
Alerts
Bar coloring
Loxx's Expanded Source Types

STD Aadaptive, floating RSX Dynamic Momentum Index [Loxx]STD Aadaptive, floating RSX Dynamic Momentum Index is an attempt to improve Chande's original work on Dynamic Momentum Index. The full name of this indicator is "Standard-Deviation-Adaptive, floating-level, Dynamic Momentum Index on Jurik's RSX".
What Is Dynamic Momentum Index?
The dynamic momentum index is used in technical analysis to determine if a security is overbought or oversold. This indicator, developed by Tushar Chande and Stanley Kroll, is very similar to the relative strength index (RSI). The main difference between the two is that the RSI uses a fixed number of time periods (usually 14), while the dynamic momentum index uses different time periods as volatility changes, typically between five and 30.
What is RSX?
RSI is a very popular technical indicator, because it takes into consideration market speed, direction and trend uniformity. However, the its widely criticized drawback is its noisy (jittery) appearance. The Jurk RSX retains all the useful features of RSI, but with one important exception: the noise is gone with no added lag.
Differences
RSX is used instead of RSI for the calculation, producing a much smoother result
Standard deviation is used to adapt the RSX calculation
Floating levels are used instead of fixed levels for OB/OS
Included
-Change bar colors

Adaptive, Relative Strength EMA (RSEMA) [Loxx]TASC's May 2022 edition Traders' Tipsl includes the "Relative Strength Moving Averages" article authored by Vitali Apirine. This is the code implementing the Relative Strength Exponential Moving Average (RS EMA) indicator introduced in this publication.
This indicator adds onto Vitali Apirine's work by including three different types of momentum used to calculate RSEMA as well as fixed and adaptive cycle calculations to be used as dynamic inputs to calculate momentum. The purpose of these additional calculation methods is to attempt to filter out noice and track trends by using different methods and inputs to calculation momentum.
Momentum methods
-Wilder relative strength
-Chande momentum
-Momentum component of Jurik's RSX RSI
Cycle calculation methods
-Fixed
-Vertical horizontal filter
-Ehlers' Autocorrelation Dominant Cycle
What is Wilder relative strength?
The Relative Strength Index (RSI), developed by J. Welles Wilder, is a momentum oscillator that measures the speed and change of price movements. The RSI oscillates between zero and 100. Traditionally the RSI is considered overbought when above 70 and oversold when below 30.
What is Chande momentum?
Chande Momentum was designed specifically to track the movement and momentum of a security. It calculates the difference between the sum of both recent gains and recent losses, then dividing the result by the sum of all price movement over the same period.
What is the momentum component of Jurik's RSX RSI?
RSI is a very popular technical indicator, because it takes into consideration market speed, direction and trend uniformity. However, the its widely criticized drawback is its noisy (jittery) appearance. The Jurk RSX retains all the useful features of RSI , but with one important exception: the noise is gone with no added lag. For our purposes here, we derive momentum minus the lag.
Vertical horizontal filter?
Vertical Horizontal Filter (VHF) was created by Adam White to identify trending and ranging markets. VHF measures the level of trend activity, similar to ADX in the Directional Movement System. Trend indicators can then be employed in trending markets and momentum indicators in ranging markets.
What is autocorrelation?
Ehlers Autocorrelation is used in the calculation of dominant cycle length to be injected into standard technical analysis tools to improve TA accuracy. Its main purpose is to eliminate noise from the price data, reduce effects of the “spectral dilation” phenomenon, and reveal dominant cycle periods.
As the first step, Autocorrelation uses Mr. Ehlers’s previous installment, Ehlers Roofing Filter, in order to enhance the signal-to-noise ratio and neutralize the spectral dilation. This filter is based on aerospace analog filters and when applied to market data, it attempts to only pass spectral components whose periods are between 10 and 48 bars.
Autocorrelation is then applied to the filtered data: as its name implies, this function correlates the data with itself a certain period back. As with other correlation techniques, the value of +1 would signify the perfect correlation and -1, the perfect anti-correlation.
Happy trading!

Aroon Oscillator of Adaptive RSI [Loxx]Aroon Oscillator of Adaptive RSI uses RSI to calculate AROON in attempt to capture more trend and momentum quicker than Aroon or RSI alone. Aroon Oscillator of Adaptive RSI has three different types of RSI calculations and the choice of either fixed, VHF Adaptive, or Band-pass Adaptive cycle measures to calculate RSI.
Arron Oscillator:
The Aroon Oscillator was developed by Tushar Chande in 1995 as part of the Aroon Indicator system. Chande’s intention for the system was to highlight short-term trend changes. The name Aroon is derived from the Sanskrit language and roughly translates to “dawn’s early light.”
The Aroon Oscillator is a trend-following indicator that uses aspects of the Aroon Indicator (Aroon Up and Aroon Down) to gauge the strength of a current trend and the likelihood that it will continue.
Aroon oscillator readings above zero indicate that an uptrend is present, while readings below zero indicate that a downtrend is present. Traders watch for zero line crossovers to signal potential trend changes. They also watch for big moves, above 50 or below -50 to signal strong price moves.
Wilders' RSI:
The Relative Strength Index (RSI) is a well versed momentum based oscillator which is used to measure the speed (velocity) as well as the change (magnitude) of directional price movements. Essentially RSI, when graphed, provides a visual mean to monitor both the current, as well as historical, strength and weakness of a particular market. The strength or weakness is based on closing prices over the duration of a specified trading period creating a reliable metric of price and momentum changes. Given the popularity of cash settled instruments (stock indexes) and leveraged financial products (the entire field of derivatives); RSI has proven to be a viable indicator of price movements.
RSX RSI:
RSI is a very popular technical indicator, because it takes into consideration market speed, direction and trend uniformity. However, the its widely criticized drawback is its noisy (jittery) appearance. The Jurk RSX retains all the useful features of RSI, but with one important exception: the noise is gone with no added lag.
Rapid RSI:
Rapid RSI Indicator, from Ian Copsey's article in the October 2006 issue of Stocks & Commodities magazine.
RapidRSI resembles Wilder's RSI, but uses a SMA instead of a WilderMA for internal smoothing of price change accumulators.
VHF Adaptive Cycle:
Vertical Horizontal Filter (VHF) was created by Adam White to identify trending and ranging markets. VHF measures the level of trend activity, similar to ADX DI. Vertical Horizontal Filter does not, itself, generate trading signals, but determines whether signals are taken from trend or momentum indicators. Using this trend information, one is then able to derive an average cycle length.
Band-pass Adaptive Cycle
Even the most casual chart reader will be able to spot times when the market is cycling and other times when longer-term trends are in play. Cycling markets are ideal for swing trading however attempting to “trade the swing” in a trending market can be a recipe for disaster. Similarly, applying trend trading techniques during a cycling market can equally wreak havoc in your account. Cycle or trend modes can readily be identified in hindsight. But it would be useful to have an objective scientific approach to guide you as to the current market mode.
There are a number of tools already available to differentiate between cycle and trend modes. For example, measuring the trend slope over the cycle period to the amplitude of the cyclic swing is one possibility.
We begin by thinking of cycle mode in terms of frequency or its inverse, periodicity. Since the markets are fractal ; daily, weekly, and intraday charts are pretty much indistinguishable when time scales are removed. Thus it is useful to think of the cycle period in terms of its bar count. For example, a 20 bar cycle using daily data corresponds to a cycle period of approximately one month.
When viewed as a waveform, slow-varying price trends constitute the waveform's low frequency components and day-to-day fluctuations (noise) constitute the high frequency components. The objective in cycle mode is to filter out the unwanted components--both low frequency trends and the high frequency noise--and retain only the range of frequencies over the desired swing period. A filter for doing this is called a bandpass filter and the range of frequencies passed is the filter's bandwidth.
Included:
-Toggle on/off bar coloring
-Customize RSI signal using fixed, VHF Adaptive, and Band-pass Adaptive calculations
-Choose from three different RSI types
Happy trading!
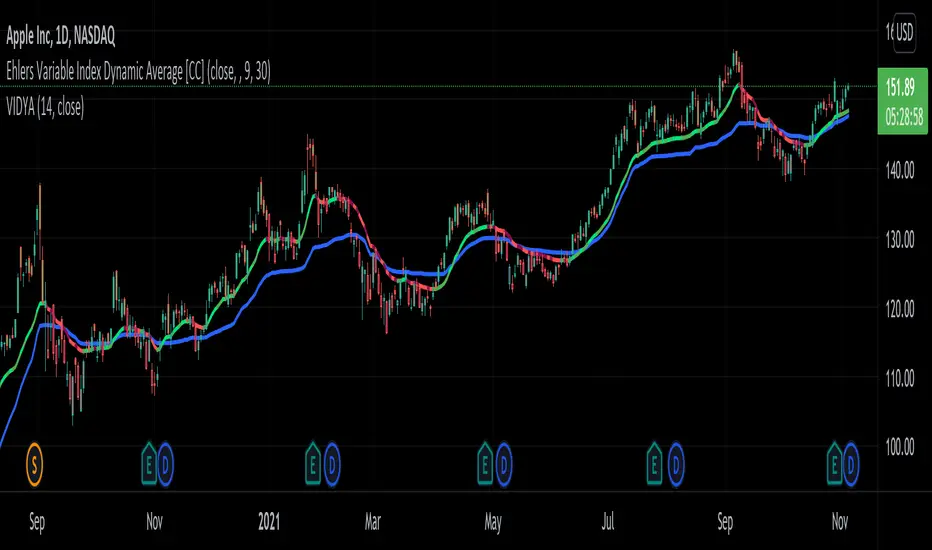
Ehlers Variable Index Dynamic Average [CC]The Variable Index Dynamic Average was created by Tushar Chande and this is a variation of that original formula created by John Ehlers. As you can see I have included the default Vidya from a script by @everget and as you can see the Ehlers version is able to follow the price much closer. I have included strong buy and sell signals in addition to normal ones and so darker colors are strong signals and lighter colors are normal ones. Buy when the line turns green and sell when it turns red.
Let me know if there are any other scripts you would like to see me publish!
CT Reverse Chande Momentum OscillatorIntroducing the Caretakers Reverse Chande Momentum Oscillator.
The Chande momentum oscillator is a technical momentum indicator which calculates the difference between the sum of recent gains and the sum of recent losses and then divides the result by the sum of all price movement over the same period.
It is used to gauge “pure momentum”.
It bears similarities to other momentum indicators such as the Stochastic, Rate of Change and the Relative Strength Index, but other unique features render it a handy tool in the traders handset.
The CMO was developed by Tushar Chande.
The author introduced the indicator in his 1994 book “The New Technical Trader “.
The CMO has a normal range of values between +100 and -100.
I have reverse engineered the CMO formula to derive a dual purpose function.
The function can calculate the chart price at which the CMO will reach a particular CMO scale value.
The function can also calculate the chart price at which the CMO will equal its previous value.
I have employed this function here to give the price level where the CMO will equal :
Upper alert level ( default 50 )
Zero-Line
Lower alert level ( default -50 )
Previous CMO value
These crossover levels are displayed via an optional infobox with choice of user selected info.
The advantage of knowing the exact prices that this will happen should give the user an additional edge and precision in risk management.
Traditionally traders and analysts will consider:
Positives values above 50 indicate an “overbought” condition
Negative values below -50 indicate an “oversold” condition
Common traditional ways to derive signals from the CMO :
When the CMO crosses above the zeroline, a buy signal is generated.
When the CMO crosses below the zeroline, a sell signal is generated.
When the SMI crosses below -50 and then moves back above it, a buy signal is generated.
When the SMI crosses above +50 and then moves back below it, a sell signal is generated.
Traditionally, traders also look for divergences between the CMO and price action.
Chande Momentum oscillating in a narrower band around the zero line, with no penetration of the Overbought and Oversold levels indicates a ranging market.
This should not be confused with Chande Momentum oscillating between either the Overbought and the zero line, or the Oversold level and the zero line, which indicates a strong up, or down-trend.
It is traditionally considered that the strongest trend signals are from failed swing patterns.
It measures momentum on both up and down days and does not smooth results, triggering more frequent oversold and overbought penetrations.
The CMO is often used to determine overall market trendiness in conjunction with the SMI where the SMI is used to determine the direction of the trend, and also with volume indicators to show if the momentum carries significant selling or buying pressure.

Volatility Index of Range Verification█ OVERVIEW
This is a volatility indicator created by extending concepts from Tushar Chande's Range Action Verification Index (RAVI).
█ CONCEPTS
This indicator constructs range of the RAVI indicator. It uses this range to build a histogram that represents how fast the range is changing, or a measure of volatility. A line is then constructed, either from a moving average or standard deviation depending on the settings that can serve as an action trigger.
█ INPUTS
• Fast MA Period: the period of the quickest moving average that is used to build the RAVI indicator line
• Slow MA Period: the period of the slowest moving average that is used to build the RAVI indicator line
• MA Type: the type of moving average to use, either Simple or Exponential
• Price Source: the type of price source to use; close, high, low, hlc3, etc.
• Lookback Period: how far back to construct the minimum and maximum of the range
• Standard Range: the standard range of the indicator. a smaller range will exaggerate differences in the columns, and vice-versa
• Volatility Period: the period used for the trigger line moving average
• Std. Deviation Mode?: Whether the trigger line will plot using a moving average or a multiple of Standard Deviation.
• Deviation Multiplier: How many deviations to use if the trigger line is in Std. Deviation Mode
Indicator: Weight Of Middle [xQT5]This is my original indicator that was inspired by "Mayer Multiple" and "Chande Forecast Oscillator" (CFO).
I decided to search truth of trend power with SMA and LinReg and found it in a somewhere of the middle. Also, I added a limit area, where you need to keep a more attention, because it can show a potential reversal.
You can change parametrs with a your own look.
One more signal for indicator:
- If "WOM" is above "1" - it's a bullish direction;
- If "WOM" is below "1" - it's a bearish direction.
Enjoy it!

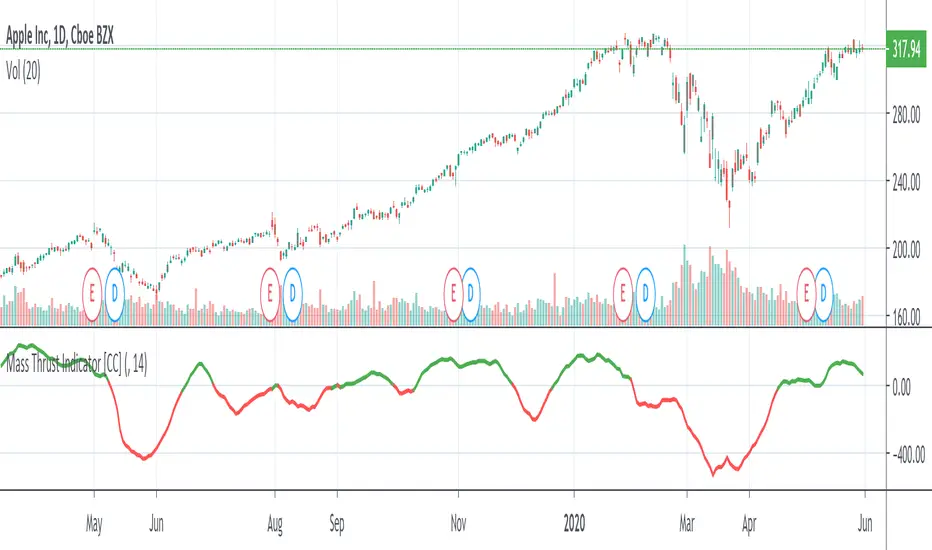
Mass Thrust OscillatorThis is a custom indicator that turns my Mass Thrust Indicator into an oscillator which is loosely based on Tushar S. Chande's Market Thrust Oscillator (Stocks & Commodities V. 10:8 (347-350))
Let me know if you would like a custom script or if you want to see me publish any other indicators!

Mass Thrust IndicatorThis is a custom indicator of mine that I based loosely on Tushar S. Chande's Market Thrust Indicator (Stocks & Commodities V. 10:8 (347-350)). Buy the stock if the indicator is green and sell when it turns red.
Let me know if you would like to see more scripts or if you have custom requests!
Midpoint OscillatorThe Midpoint Oscillator was created by Tushar Chande Ph.D. (Stocks & Commodities V. 9:11 (431-434)) and it does a great job of tracking extreme changes in the price. Buy when the line is green and sell when it turns red.
Let me know if you would like me to write more scripts!

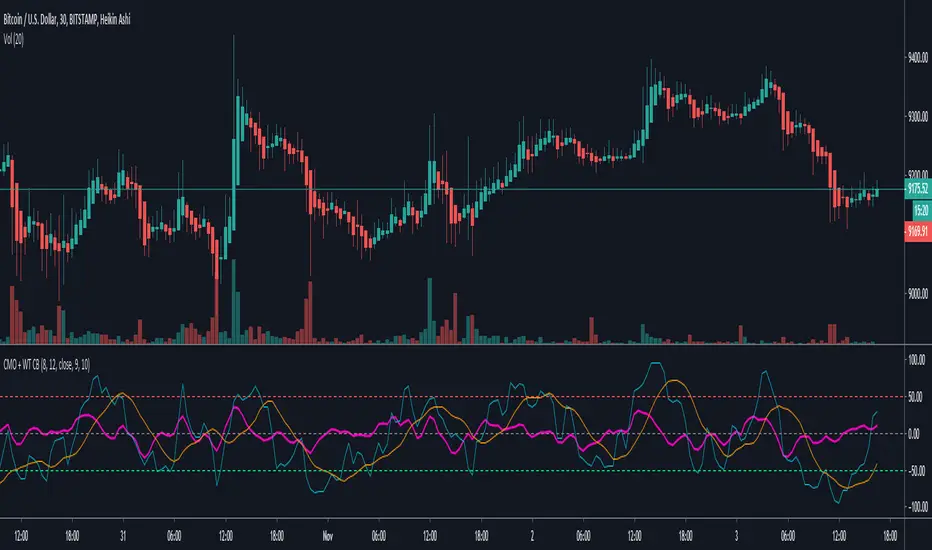
Chande Momentum Oscillator + WaveTrend Oscillator [ChuckBanger]This is a combination of Lazybears WaveTrend Oscillator (purple line) and Chande Momentum Oscillator (blue line with the orange line as a signal line). Use WaveTrend as a confirmation tool. It is consider as a selling point when CMO is over the red horizontal dotted line. The opposite applies if CMO line is under the red horizontal dotted line.
You can also use this with WaveTrand to confirm the sell or buy point. When WT line is over center line and CMO has crossed over it's signal line. It is a buy point. The opposite applies if WT line is under the center line and CMO is under its signal line.
CKSDHi. It's simply histogram that shows divergence between the lines of the Chande Kroll Stop ind (built-in TradingView ind). I noticed that the lines intersect or are very close to each other if the volatility decreases. You can use MA like the main line or just 5, 10 lines how I do. Sorry for code Im not a programmer

Combo Strategy 123 Reversal & CMO & WMA This is combo strategies for get a cumulative signal.
First strategy
This System was created from the Book "How I Tripled My Money In The
Futures Market" by Ulf Jensen, Page 183. This is reverse type of strategies.
The strategy buys at market, if close price is higher than the previous close
during 2 days and the meaning of 9-days Stochastic Slow Oscillator is lower than 50.
The strategy sells at market, if close price is lower than the previous close price
during 2 days and the meaning of 9-days Stochastic Fast Oscillator is higher than 50.
Second strategy
This indicator plots Chandre Momentum Oscillator and its WMA on the
same chart. This indicator plots the absolute value of CMO.
The CMO is closely related to, yet unique from, other momentum oriented
indicators such as Relative Strength Index, Stochastic, Rate-of-Change,
etc. It is most closely related to Welles Wilder?s RSI, yet it differs
in several ways:
- It uses data for both up days and down days in the numerator, thereby
directly measuring momentum;
- The calculations are applied on unsmoothed data. Therefore, short-term
extreme movements in price are not hidden. Once calculated, smoothing
can be applied to the CMO, if desired;
- The scale is bounded between +100 and -100, thereby allowing you to clearly
see changes in net momentum using the 0 level. The bounded scale also allows
you to conveniently compare values across different securities.
Combo Strategy 123 Reversal & Chande Momentum OscillatorThis is combo strategies for get a cumulative signal.
First strategy
This System was created from the Book "How I Tripled My Money In The
Futures Market" by Ulf Jensen, Page 183. This is reverse type of strategies.
The strategy buys at market, if close price is higher than the previous close
during 2 days and the meaning of 9-days Stochastic Slow Oscillator is lower than 50.
The strategy sells at market, if close price is lower than the previous close price
during 2 days and the meaning of 9-days Stochastic Fast Oscillator is higher than 50.
Second strategy
This indicator plots Chande Momentum Oscillator. This indicator was
developed by Tushar Chande. A scientist, an inventor, and a respected
trading system developer, Mr. Chande developed the CMO to capture what
he calls "pure momentum". For more definitive information on the CMO and
other indicators we recommend the book The New Technical Trader by Tushar
Chande and Stanley Kroll.
The CMO is closely related to, yet unique from, other momentum oriented
indicators such as Relative Strength Index, Stochastic, Rate-of-Change,
etc. It is most closely related to Welles Wilder`s RSI, yet it differs
in several ways:
- It uses data for both up days and down days in the numerator, thereby
directly measuring momentum;
- The calculations are applied on unsmoothed data. Therefore, short-term
extreme movements in price are not hidden. Once calculated, smoothing
can be applied to the CMO, if desired;
- The scale is bounded between +100 and -100, thereby allowing you to
clearly see changes in net momentum using the 0 level. The bounded scale
also allows you to conveniently compare values across different securities.
WARNING:
- For purpose educate only
- This script to change bars colors.
Combo Strategy 123 Reversal & Chande Forecast Oscillator This is combo strategies for get a cumulative signal.
First strategy
This System was created from the Book "How I Tripled My Money In The
Futures Market" by Ulf Jensen, Page 183. This is reverse type of strategies.
The strategy buys at market, if close price is higher than the previous close
during 2 days and the meaning of 9-days Stochastic Slow Oscillator is lower than 50.
The strategy sells at market, if close price is lower than the previous close price
during 2 days and the meaning of 9-days Stochastic Fast Oscillator is higher than 50.
Second strategy
The Chande Forecast Oscillator developed by Tushar Chande The Forecast
Oscillator plots the percentage difference between the closing price and
the n-period linear regression forecasted price. The oscillator is above
zero when the forecast price is greater than the closing price and less
than zero if it is below.
WARNING:
- For purpose educate only
- This script to change bars colors.

Trend Scores + Volume-Weighted Trend ScoresHere is a simple indicator based on Tushar Chande's TrendScore .
The main purpose of the TrendScore is to determine the strength and direction of a trend, which it does by comparing the current price to the prices within a user-defined window of historical prices.
In the input menu, the user defines the starting and ending period. The current price is then compared to each historical price. If the current price is greater than the given historical price, then the TrendScore is incremented, while it is decremented if it is below the given historical price. TrendScore values fluctuate between a maximum of 100 and a minimum of -100, with 100 meaning that the current price is greater than each historical price in the window and a value of -100 meaning the inverse is true.
We then use the same process to calculate the volume trend score by passing in volume to the 'getTrendScore' function. Lastly, the indicator also also calculates a 'volume-weighted trend score'. This is simply the average of the price trend score and the volume trend score. It is not plotted by default, but users can set the input option to true in the input menu and it will be plotted as a yellow line (as seen in the bottom chart).
The Chart:
The trend scores for price are plotted as a histogram. We've summarized the meaning behind its color changes below:
-If ( trendScore == 100)
then color = dark green
-if ( trendScore < 100 and trendScore is increasing)
then color = light green
-if ( trendScore > 0 and trendScore is DECREASING)
then color = pink
-if ( trendScore < 0)
then color = red
The volume trend score is plotted as a blue line. We felt that using a similar coloring system for the volume trend scores would over-crowd the chart and take away from the simplicity that makes this indicator useful. The volume-weighted trend score is plotted as a yellow line.
The main price bars change color based on the price trend score to make the values easier to visualize as well.
Interpretation:
This is a pretty versatile indicator. We summarized the ways in which traders can use it:
-Enter Long Positions when the trend score crosses zero from negative to positive territory.
-Exit Long Positions when the trend score was previously 100 and begins decreasing (ie bar color changes from dark green to pink).
-Spot bearish divergences when price trend score is 100 or relatively high and the volume trend score decreases significantly.
-Identify bullish divergences when price trend score is relatively low and volume trend score is increasing.
~Happy Trading~

Momentum TraderThis study combines two versatile momentum indicators :
Chande Momentum Oscillator:
-Measures trend strength, with higher absolute values meaning greater strength.
-Also tracks divergence. When price increases, but is not accompanied by an increase in Chande Momentum Oscillator values, it signifies bearish divergence and a reversal is likely to follow.
-Shown as the teal and pink histogram.
Percentage Price Oscillator:
-Similar to the MACD, except that it expresses the difference between the two moving averages in terms of a percentage. This makes it a little easier to visualize.
-PPO values greater than zero indicate an uptrend, as that means the fast EMA is greater than the slow (and vice versa).
Entry and Exit Conditions:
Enter When:
1) Chande Momentum crosses over zero from negative to positive territory. AND
2) It has been less than 3 bars since Chande Momentum was less than the lower green line. AND
3) Chande Momentum is rising(positive slope).
Exit When:
1) Chande Momentum is greater than the upper line. AND
2) It has been less than 6 bars since the PPO value was greater than the upper bound. AND
3) PPO is less than 5 (meaning the difference between the two EMA's is less than 5%). AND
4)PPO has a negative slope.
This study comes with alert conditions for long entries and exits.
~Happy Trading~
