Ultra CMF + Stoch. and Choppiness IndexThis is a fairly complex, but powerful indicator that combines 3 different indicators.
1. Chaikin Money Flow (CMF)-
Oscillator that uses the sum of Money Flow Volume (MFV) values over n periods to determine and compare the amount of
buying/selling pressure. We modified the CMF's scale so that values fluctuate between {-100, 100} for easier visualization.
If (CMF > 0)
then (buying pressure > selling pressure)
If (CMF < 0)
then (buying pressure < selling pressure)
Thus, CMF can be a valuable tool for confirming both uptrends and downtrends, as well as identifying divergences as a negative CMF
value in the midst of an uptrend indicates lack of strength.
In addition, we set bounds for the CMF values to prevent whipsaws during periods of horizontal price movement.
The CMF is shown on the bottom of the chart as the teal and fuchsia histogram.
Teal bars means (CMF < 0) and fuchsia bars means (CMF > 0).
2. Choppiness Index -
The Choppiness Index is another oscillator that works synergistically with the Chaikin Money Flow to prevent entries during choppy
conditions (when there is no clear trend direction and movement is horizontal). Although it is blind to the actual direction of the
price movement, we use it to distinguish periods of consolidation from "trendy" markets. Values fluctuate between {0, 100}, with 50
acting as the center-point. We've also set thresholds for chop values that are utlized to optimize entry and exit timing.
The Choppiness Index is plotted as the green and pink circle line at the top of the chart. If movement is choppy(choppy > 50), then
circles are pink. If choppiness is low(chop < 50), then the circles are green.
3. Fast and Slow Stochastics -
Lastly, we use a fast and a slow stochastic momentum oscillator. This is a fairly common approach, as it allows us to detect signals
on a wider range of sensitivity.The slow stochastic confirms the high quantity of signals generated by the more hyper-sensitive
fast stochastic.
The fast and slow K and D values are not plotted on the graph by default, but users can change that in the inputs to choose which
ones to show on the graph(as shown in the bottom pane). The upper and lower bounds can also be chosen to increase/decrease
signal sensitivity.
All values such as lengths, bounds, etc. can be changed by users through the input options.
The Graph:
Chaikin Money Flow - Shown as the teal and pink zero-centered oscillator at the bottom of the chart. Bars are teal when CMF is less than
zero and fuchsia when CMF value is greater than 0. Users can choose whether the CMF is plotted by changing the 'plotCMF' input.
-The CMF histogram is shown in the second and third panes.
Choppiness Index - Plotted as the pink and teal line of circles at the top of the chart. Circles are pink if they are above 50 (high chop) and
teal when they are below 50 (low chop). Users can choose whether it is plotted through the 'plotChop' input.
-The Choppiness Index is shown in the second and third panes.
Stochastics - Not plotted by default, but users can choose to have them shown by adjusting the values in the input options menu. If you want,
there is an option to plot both fast and slow K and D values (4 total lines) and the upper and lower bounds that are used to determine entries
and exits.
NOTE: I tried to show all the ways that you can choose to display all the different indicators in the different panes, but there are a million
different ways you can choose to have the chart laid out through changing the inputs. You could have it be as simple as plotting just the 'B'
and 'S' for entries and exits or a complex graph with the CMF, Chop, and stochastics all plotted together.
HOW TO USE:
There is a set of conditionals for each of the three indicators to determine both entry and exit points. To simplify this, we decided to divide them
into red circles for exit conditions and green squares for entry conditions.
LONG ENTRIES:
1. If the conditions for the stochastics are met, a green square is plotted at the top of the chart.
2. If the conditions for the CMF are met, a green square is plotted at the center of the chart.
3. If the conditions for Choppiness Index are met, a blue circle is plotted at the bottom.
TRADE WHEN: There is a green square at the top, green square in the middle, and a blue circle at the bottom.
A GREEN 'B' IS PLOTTED IN THE CENTER OF THE GRAPH WHEN THE ABOVE REQUIREMENTS ARE TRUE...Enter position at that point.
LONG EXIT:
1. If the conditions for the stochastics are met, a red circle is plotted at the top of the chart.
2. If the conditions for CMF are met, a red circle is plotted at the center of the chart.
3. If the conditions for Choppiness Index are met, a blue circle is plotted the bottom.
TRADE WHEN: There is a red circle at the top, red circle in the middle, and blue circle at the bottom.
A RED 'S' IS PLOTTED AT THE CENTER OF THE GRAPH WHEN THE ABOVE REQUIREMENTS ARE TRUE....Exit Position at that point.
ALERTS:
An alert is sent when all buy conditions are met, informing the trader to enter a long position.
The same is done for sell conditions.
Like I said earlier, there are tons of input options to change this indicator to fit your specific use, as well as display options. I've tailored the settings
for trading BTC/USD, but it is a very versatile indicator and can be adapted for whatever you're trading.
波动指数(CHOP)

Flow Trend Indicator Strategy V2Incorporated some strategies into one strategy. Every strategy can be tested using the TV StrategyTester.

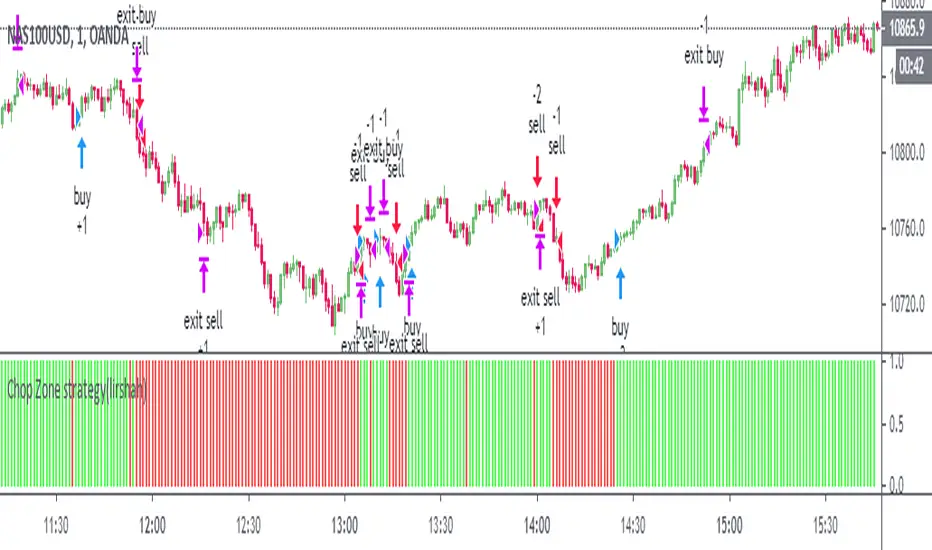
Chop Zone strategy(lirshah)This is a visual indicator designed to identify trends and choppiness.
the Chop Zone illustrates the difference between close price and its EMA by converting its values to colors.
this strategy has best performance on H1 timeframe and has a good results on several crypto pair.
Choppiness IndexThis is another implementation of the Chop index that also has a smoothed chop.
Marked for more visibility the extreme and danger zone crosses.
Colored areas for better visibility.
Added alerts on danger and extreme zone crosses (up/down).
!!! Don't use it as RSI to see overbought and oversold

Trader Set - Choppiness Index HelperThis is simply a helper indicator that sits on the chart to mimic the color code of the choppiness index oscillator. It can be used when you maximize the chart to better focus on the chart and other parts of the system.
Please don't ask for getting access, these indicators are available only for my students. The English website and the related learning materials are under development and soon they will be published and I will announce it in the comment section of every related indicator.

Trader Set - Choppiness IndexFinally made this work as desired, time to publish another super useful script in the tool set for my methodology. This indicator easily shows when the market is moving as a CHOPPY market so that traders either don't take position or be very cautious with their positions.

Action Section, Volatility Choppiness Indicator (by ChartArt)Here is a solution to find entry points to trade. This indicator highlights price sections with low choppiness, where both the ADX (Average Directional Index) indicator shows strong movement (up or down!) in the price and a customized Money Flow indicator (which uses only the change of the volume not the change of the price, hence a Volume Flow indicator), also shows volatility is present. Using higher filter values than the default setting of "30" reduces the noise, but also shows less 'action sections'. Vice versa using values lower than "30" increases the amount and duration of action sections which are shown.
The "action section" indicator does not show the direction if the price is going up or down. It shows if there is enough action worthy the time to trade (lower odds of a neutral sideways trend). Therefore in addition a Heikin-Ashi based price change indicator can optionally be plotted, which shows the actual direction of the price.
Action Section, High Volume Volatility & Low Price Choppiness Indicator
This indicator works only on charts which have volume data.

FREE INDICATOR: CHOPPINESS INDEX "TREND DETECTION FROM CHAOS"About:
The Choppiness Index was created by E.W. Dreiss out of chaos theory, and attempts to gauge the current market's trendiness.
I've seen a few versions of this floating around, but this was built off the true version as described in the original 1993 release, you can read more about it here: www.edwards-magee.com
Usage:
Values above 61.8 are considered very choppy, values below 38.2 are considered very trendy, but values along the entire scale can help you determine position sizing, or even weather you should be getting into this trade or not.
If you are looking for a new way to know weather the market is trending, about to trend, or just going sideways, this very handy indicator for algorithmic trading may be your answer.
Grab the source code here: pastebin.com
Installation video by @ChrisMoody here : blog.tradingview.com
░░░░░░░░░░░░░░░ Feel free to follow me to keep up with my latest scripts! ░░░░░░░░░░░░░░░
░░░░░░░░░░░░ PLEASE THUMB UP OR STAR IF YOU LIKE THIS INDICATOR! ░░░░░░░░░░░░
I'd like as many people as possible to get it :)
