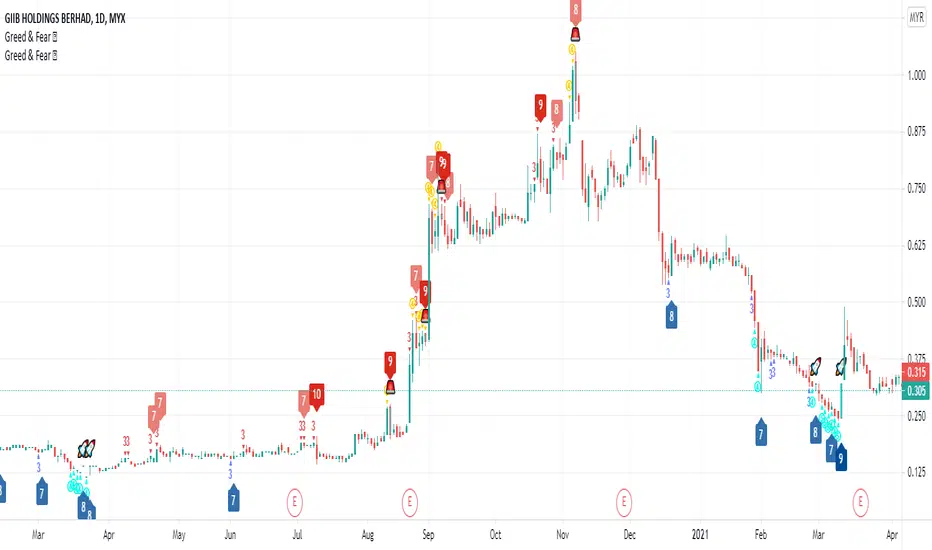
Greed and Fear ScoreHi All,
This is Greed and Fear Score script. The uses of this indicator is to let users know what is the state for each bar closed.
Warren Buffett once said that it is wise for investors to be “fearful when others are greedy, and greedy when others are fearful.
Greed & Fear Score (range from 1 - 5) has taken multiple measurements into consideration such as CCI, MFI, RSI, RVI and William %R.
The range of score is from 1 - 5 indicating weak to strong.
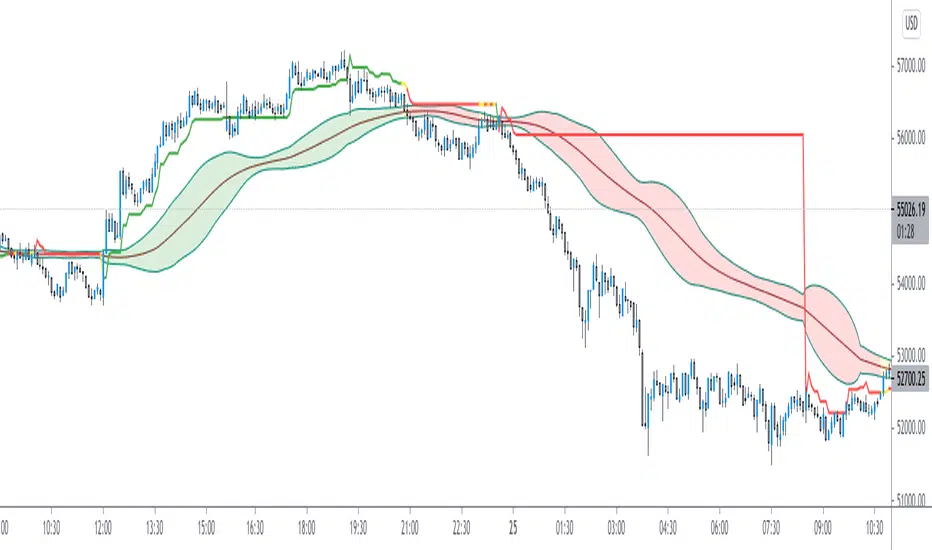
Red/Yellow represents Greed score.
Blue/Light Blue represents Fear score.
The Bull & Bear Transition Score (range from 1 - 10) is to measure how strong power needed to reverse the Greed or Fear State.
It is a powerful tool that incorporates CMF, MFI, CCI, MOMENTUM, OBV, RSI, RVI, WILLIAN %R, PRICE OSCILLATOR and Relative Volume.
How to use Bull & Bear Transition Score?
The higher the Bull & Bear Score, the more likely it will change from one state to another.
How to find BEST opportunity? Here comes the special symbol.
User can choose best fit combination by using filtering.
顺势指标(CCI)
CCI45/SMA50 indy for 30 min SP500SPCFD:SPX
The script determines entry points using 45 period CCI and 50 period SMA.
Long condition: When CCI crosses up 150 treshold while price above 50 period SMA
Short condition: When CCI crosses down -150 treshold while price below 50 period SMA
Trades are executed above/below 1 point of high/low for long/short positions. Stops are just 1 point below/above of SMA. After 4 points of profit stops should be tightened. If you do not plan to hold the position for a long time, it can produce quick profit within 5-6 bars namely 2.5-3 hour. Otherwise you can manage the trade using SMA as trailing stop. This can be treated as a strategy of scalping which turns out a trend trading eventually if conditions good.
Have a nice trading

CCI Breakout TraderWorks well on Bitcoin or most altcoins on a 15min chart or higher.
What is this exactly?
This is an indicator that uses horizontal RSI + EMA lines with a CCI line on top of it to provide optimal entry and exit positions for trading. There is also a breakout indicator based on the width of Bollinger Bands.
How to use:
If the blue stream passes upwards on the red heading to the white - it's heading towards a good BUY signal. To be safe you wait until it passes above the white line, then BUY LONG. Another signal to buy long is when the blue stream passes above the white and green lines.
Selling is essentially the opposite, if the blue stream is passing down from the green or white lines, then it's time to sell and exit your trade.
If you need help knowing when to enter and exit a trade the indicator will draw a grey candle on your chart to signal it's time to exit a long trade and it will draw a purple candle when it's time to enter a long.
--
Breakout alert:
If you see a green vertical bar it's a warning that there is a potential breakout in price coming for whichever coin you are looking at. The price breakout could go either direction, so make sure you watch the blue stream.
--
Important tips:
The direction of the green/white/red lines are important - if they are heading down that means it might not be the best time to enter your trade, even if the blue stream crosses up on the red and/or white lines.
The colored horizontal lines are there to let you know if the blue stream is near the bottom of those lines (anywhere from hline 15 to 50) and heading upwards, you will more likely have a longer positive trade. If the blue stream is above 60 hline and it looks like a good trade (passing up on the red and white lines), expect to have a shorter trade.
I use this for swing trading various crypto currencies, once you learn how to read it, you can catch amazing uptrends really early and you can exit trades before some big drops happen.

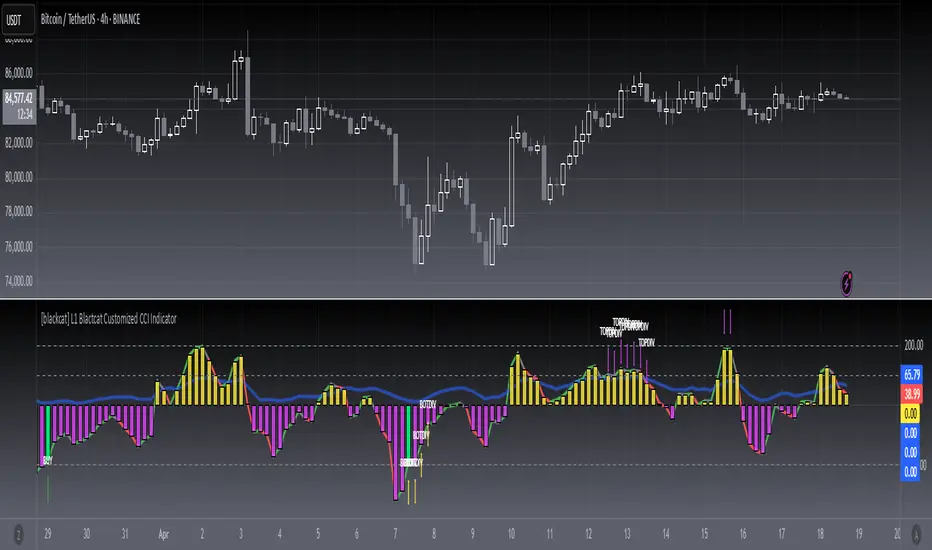
[blackcat] L1 Blackcat Customized CCI IndicatorLevel: 1
Background
This CCI indicator is blackcat customized version with enhanced features.
Function
This CCI use green line to indicate strong long trend with cci values > 0 and red line to indicate weak long trend with cci values <0. It also use yellow and fuchsia candles to present the strong and weak long trend. A green candle is used to indicate long entry, while a red candle is usded to indicate long flatten signal.
Key Signal
green line --> strong long trend
red line --> weak long trend
blue line --> trend strength indicator
SELL label --> flatten long or short entry
BUY label --> long entry
TOPDIV label --> top divergence indicator
BOTDIV label --> bottom divergence indicator
Remarks
Feedbacks are appreciated.
Readme
In real life, I am a prolific inventor. I have successfully applied for more than 60 international and regional patents in the past 12 years. But in the past two years or so, I have tried to transfer my creativity to the development of trading strategies. Tradingview is the ideal platform for me. I am selecting and contributing some of the hundreds of scripts to publish in Tradingview community. Welcome everyone to interact with me to discuss these interesting pine scripts.
The scripts posted are categorized into 5 levels according to my efforts or manhours put into these works.
Level 1 : interesting script snippets or distinctive improvement from classic indicators or strategy. Level 1 scripts can usually appear in more complex indicators as a function module or element.
Level 2 : composite indicator/strategy. By selecting or combining several independent or dependent functions or sub indicators in proper way, the composite script exhibits a resonance phenomenon which can filter out noise or fake trading signal to enhance trading confidence level.
Level 3 : comprehensive indicator/strategy. They are simple trading systems based on my strategies. They are commonly containing several or all of entry signal, close signal, stop loss, take profit, re-entry, risk management, and position sizing techniques. Even some interesting fundamental and mass psychological aspects are incorporated.
Level 4 : script snippets or functions that do not disclose source code. Interesting element that can reveal market laws and work as raw material for indicators and strategies. If you find Level 1~2 scripts are helpful, Level 4 is a private version that took me far more efforts to develop.
Level 5 : indicator/strategy that do not disclose source code. private version of Level 3 script with my accumulated script processing skills or a large number of custom functions. I had a private function library built in past two years. Level 5 scripts use many of them to achieve private trading strategy.
QQE-CCI Hello guys;
This indicator is a simple combination of two oscillators "Quantitative Qualitative Estimation Signals"(based on RSI) and "Commodity Channel Index".
To summarize, the method of signaling from this indicator is that by observing the "Long" signal and CCI cross with the midline upwards simultaneously, we open the buy position; and if we see the "Short" signal and CCI cross with the midline down at the same time, we open a sell position.
I have designed this indicator for use in Binary options; 70% of the trades I have made based on this indicator signals have been successful.
I put my telegram ID here incase if U need, txt me :)
@QQECCi

Dual Commodity Channel IndexDual Channel Commodity Index comprised of two single CCI indicators with all tweakable parameters: lengths and factoring.
All in one [Liubam]Hey tradingviewers!
This is an All in one Indicator for those who can't add too many indicators on your charts. Inspired by ©LonesomeTheBlue "Indicators all in one" script. I found a lot of very interesting scripts on the public library and I decided to make a tool with some of the greatest IMO, adding some modifications to improve the indicators. With this tool you can plot 1 of 6 different indicators by selecting it from a drop-down list (on the indicator settings).
All the credit goes to it's respective owners (taggeds).
THIS INDICATOR INCLUDES:
1. Classic RSI with some OB/OS tools:
The relative strength index (RSI) is a popular momentum indicator displayed as an oscillator (a line graph that moves between two extremes) that measures the magnitude of recent price changes to evaluate overbought or oversold conditions, in other words it shows signals about bullish and bearish price momentum. I added some visual improvements to help you finding the OB/OS zones.
2. Classic CCI with some OB/OS tools.
The Commodity Channel Index (CCI) is a momentum-based oscillator used as market indicator to help determine market movements that may indicate buying or selling. Added some vistual improvements to the chart.
3. ADX and DMI oscillator with the keylevel coded by @console:
The Average Directional Index (ADX) is non-directional indicator used by some traders to determine the strength of a trend. When the ADX line is rising (Above the keylevel) trend strength is increasing, and the price moves in the direction of the trend whether up or down. Otherwise, low ADX (Below the keylevel) is usually a sign of accumulation or distribution (Range). Non-trending doesn't mean the price isn't moving. It may not be, but the price could also be making a trend change or is too volatile for a clear direction to be present.
Suggested settings of the keylevel is 23-25.... REMEMBER: The trend may be your friend.
4. MFI
The Money Flow Index (MFI) is a technical oscillator for identifying overbought or oversold signals in an asset. Unlike conventional oscillators such as the RSI, the Money Flow Index incorporates both price and volume data, as opposed to just price. It can also be used to spot divergences which warn of a trend change in price.
5. Stochastic:
A stochastic oscillator is range-bound, meaning it is always between 0 and 100. This makes it a useful indicator of overbought and oversold conditions. Traditionally, readings over 80 are considered in the overbought range, and readings under 20 are considered oversold. However, these are not always indicative of impending reversal; very strong trends can maintain overbought or oversold conditions for an extended period. Instead, traders should look to changes in the stochastic oscillator for clues about future trend shifts. I added some features for this popular indicator to show the stochastic crosses.
6. The famous Squeeze momentum Indicator made by @Lazybear:
This is derivate of John Carter's "TTM Squeeze" volatility indicator and its very strong when using with trending indicator such a ADX. Black line (or no-line) on the midline show that the market just entered a squeeze ( Bollinger Bands are with in Keltner Channel). This signifies low volatility , market preparing itself for an explosive move (up or down). Gray line signify "Squeeze release". Mr.Carter suggests waiting till the gray line after a blackline, and taking a position in the direction of the momentum (for ex., if momentum value is above zero, go long). Exit the position when the momentum changes.
------------------------------------------------------------------------------------------------------------------------------------------------------------------------------------------------------------------------------------------------
This script is source code protected, but you can add to your favorite list to use it. Also you can add twice to use 2 different indicators at the same time (E.g. Squeeze Momentum Indicator + ADX)
An additional indicator I made (MA Hunterz + InfoPanel) is needed to not miss good entry points.
Your valuable comment and feedback is much appreciated...
And remember indicators can be really helpfull but always use Price Action.

CCI Overbought & OversoldThe Commodity Channel Index (CCI) is a momentum-based oscillator used to help determine when an investment vehicle is reaching a condition of being overbought or oversold
Developed by Donald Lambert, this technical indicator assesses price trend direction and strength, allowing traders to determine if they want to enter or exit a trade, refrain from taking a trade, or add to an existing position. In this way, the indicator can be used to provide trade signals when it acts in a certain way.
KEY TAKEAWAYS
The Commodity Channel Index (CCI) is a technical indicator that measures the difference between the current price and the historical average price.
When the CCI is above zero, it indicates the price is above the historic average. Conversely, when the CCI is below zero, the price is below the historic average.
The CCI is an unbounded oscillator, meaning it can go higher or lower indefinitely. For this reason, overbought and oversold levels are typically determined for each individual asset by looking at historical extreme CCI levels where the price reversed from
This script calculates Commodity Channel Index (CCI) value and fills background of price action chart with colors:
Green zone indicates oversold zone where you can enter position
Red zone indicates overbought zone where a positions should be closed

MTF Oscillators [Anan]Hello friends,
This is my own MTF oscillator framework verion.
You can control in everything from indicator settings suck as (Source, Length, OB/OS Zones, Show/Hide Timeframes and all Timeframes are supported).
List of supported oscillators:
RSX
RSI
MFI
CCI

CCI MTF Pane [Anan]Hello friends,
This is CCI MTF Pane:
Green Line : CCI >= 0
RED Line : CCI < 0
Green Dot : CCI Oversold >= 100
Red Dot : CCI Overbought <= -100
You can modify these values from indicator settings.
Crypto rsi cci mf stoch rsi oscillators all in one strategyThis is a strategy based on the popular oscillator like RSI, CCI, MF and Stochastic RSI oscillators.
In this situation I use a very high length , 100 candles, and the middle point between overbought and oversold levels at 50.
The entry for long is when all oscilators are above 50, and the exit is when they are below 50 + plus some minor modifications
If you have any questions, please message me a private message !

CCI Super BandsCCi Super Bands ,
Is an Indicator to plot Commodity Channel Index Projections over the Price Chart
It's offers interesting price Analysis
There are two major parts to the indicator!
1. The Optimal CCI Line
2. A CCI Standard Deviation Bands
Color Codes Meaning:
Red : Strength in Bearish Intent
Green : Strength in Bullish Intent
Yellow : Consolidation estimations
Try to play with this indicator
and Enjoy
PRIME - Krypto Kiss+CCI+VPIntroducing from Prime Academy, the experimental "KryptO Kis$" algorithm, which combines our most powerful scripts all in one indicator. Available to the user are a full options platform to adjust parameters as well as individually blind indications for precise chart analysis. The following algorithms have been utilized:
* Prime Pulse (3 Candle System) - The original impulse and momentum indication system, it take rsi and tsi data to provide users with the indication of initial impulses, as well as a yellow candle to ascertain when there is a possible change of momentum in the current impulse.
* 5 SMA - The original Sniper Cross system seen from previous strategies, using the 4, 21, 50, 185, and 800 SMA's to determine changes of trend, continuation and support levels.
*CCI Indication on Chart - The system provides realtime CCI data in correlation to price positions within the general chart matrix, receiving system variables from various crosses on the 100 to -100 scale for CCI. Bullish and Bearish indications are clearly defined by separate colors.
* Volume Profile with tags - This system provides current volume data for the current time frame and sequence, also giving available tags at prices holding high volume orders, historically and present as indicated by the difference in length of indications. color saturations indicate the intensity of volume at the price in question .
* Shadow ZoneZ - Provides Support and resistance levels using rsi overbought and over sold data, sourced on the close of previous prices. Also embedded in the code is an additional volume confluence via indications of dotted lines with prices available, giving sequence positions of "Whales" and their support and resistance levels by order volume at price.
* An added bonus of the Shadow ZoneZ is the auto trend line and trend channel function , as well as the highlighted zones of liquidity waiting to be filled from previous impulses and lack of present retracements.
Any questions can be directed here on site via Direct Message. Any feedback is welcomed, and thank you in advance. Trade Well, Family!
- Dee Prime
//Disclaimer:
//Trading success is all about following your trading strategy and the indicators should fit within your trading strategy, and not to be traded upon solely
//The script is for informational and educational purposes only. Use of the script does not constitute professional and/or financial advice.
//You alone have the sole responsibility of evaluating the script output and risks associated with the use of the script.
//In exchange for using the script, you agree not to hold the publishing TradingView user liable for any possible claim for damages arising from any decision you make based on use of the script.
PRIME - R.o.c.M Ind. W/ TrendsThis experimental script is a variant of a model that allows a separate indicator window to be opened, revealing data for on balance volume, rsi, consumer commodity index and momentum indications. By use of the settings key, you can change the parameter of the source input as well as the desired lengths. After data compilation, the indicator will automatically draw any trend lines applicable to what is presented. The additional code is an attempt to allow the system to apply pivot points for alerts within the indicator itself.
Disclaimer:
Trading success is all about following your trading strategy and the indicators should fit within your trading strategy, and not to be traded upon solely
The script is for informational and educational purposes only. Use of the script does not constitute professional and/or financial advice. You alone have the sole responsibility of evaluating the script output and risks associated with the use of the script. In exchange for using the script, you agree not to hold the publishing TradingView user liable for any possible claim for damages arising from any decision you make based on use of the script

[SK] RSI/CCI Correlating OscillatorThe combination of RSI and CCI can be a powerful tool to efficiently signal the strength of the trend and upcoming reversals.
The magic comes when you're able to correlate both indicators correctly, this is the power I give you with the RSCCIO.
I've added additional features to each indicator that make signals more clear and easier to identify.
On the RSI
Directional color coding similar to what you can find on a MACD. This helps to identify the general trend ( above or below midline ) and the of the movement within.
For precise correlation the RSI is adjusted to a midline of 0. You can still enter the overbought/oversold levels as you'd expect on a regular RSI and it will be automatically adjusted.
On the CCI
Extreme strength / weakness color coding when the value exceeds the range makes signals more clear.
For precise correlation with the RSI, we need to scale down the value of the CCI with the Sensitivity Input. The default value works overall but feel free to play around to adjust the scale of the CCI movement.
---
RSI Relative Strength Index
The RSI is a momentum indicator that measures the magnitude of recent price changes. An asset is usually considered overbought when the RSI is above 70% and oversold when it is below 30%.
CCI Commodity Channel Index
The CCI was originally developed to spot trend changes. Use the CCI on the longer-term chart to establish the dominant trend and on the shorter-term chart to isolate pullbacks and generate trade signals.
TSI HMA CCIHi!
This strategy has TSI and CCI indicators with the CCI being based on a HMA instead of the Price.
There is a number of conditions that must combine to create buy or sell signals, but it is basically a couple of MA crossovers.
The strategy opens new orders on each candle if the conditions are met, Either direction, so it is hedging.
It wont open new orders if there is a floating loss, and so is constantly attempting to hold a floating profit (drawup instead of drawdown)
But It has a StopLoss (set by user) for closing of losing orders, and it closes all orders in basket style when account is in profit to users set amount target profit.
Low commission set to simulate swap but Forex pairs generally dont have commission like the crypto exchanges do. So if you use this on cryptos, remember to increase the commission to your brokers amount.
Crypto users will likely find that because this opens so many orders the commission could erase its profits.
So i recommend this for Forex only, and perhaps, only NZDUSD 4H chart. other pairs, change settings for.
The strategy has settings for testing on target time spans, so you could test it on just Jan-Feb 2020 for example, if you want, or from Jan 2020 to present day.
Have Fun! Open Script for copy/paste/edit/publish your own version :)

Commodity Channel Index + Relative Strength Index (Same Scale)Mashup, combining (adjusted) RSI and CCI.
These two indicators serve similar functions, but on different scales. I combined the two versions from the TradingView Built-In library into one chart, keeping the default setting for the CCI signal lines and fitting the RSI's default signal lines to them, so that they line up. I therefore adjusted the RSI to match the approximate range of the CCI and added additional lines to represent the maximum and minimum values of the RSI (0 - 100).
I did that by multiplying the RSI with 5, and subtracting 250.
Adjusted RSI = (RSI * 5) - 250
So the upper signal line (default: 70) now matches the line used for the CCI at 100. The lower signal line (default: 30) lines up with -100.
If you want to adjust them, you need to use the formula. I annotated the code if you want to dive deeper.
This indicator uses the original code and styling of the default Built-In RSI and CCI. Credit goes to the appropriate developers. My only intent is to mash up both of these indicators, making it easier to compare them.
Interpreting this indicator is the same as interpreting the underlying indicators. If you find any unexpected correlations, comment.
MTF CCI with timeframe control function and signal/alertJapanese below. / 日本語説明は下記
Summary
This indicator shows CCI of the current timeframe and another CCI from upper timeframe as MTF CCI with ability to show signals and set alerts when crossing upper/bottom bands.
For general use of CCI, please refer to the link below(by TradingView)
jp.tradingview.com
How is it different from other MTF CCI indicators?
Problems with other MTF CCI indicators are;
-If you set higher timeframe CCI(MTF CCI), it will also be shown on further higher time frames.
i.e. If you set 4hour chart’s CCI on 1 hour or lower time frame charts, it will also appear on daily and weekly chart, which is not necessary.
To tackle these problems, this indicator has incorporated functions below.
-To be able to control timeframes where MTF CCI is displayed to eliminate unnecessary information when you open higher time frame’s charts.
For example, if you select daily timeframe for MTF CCI, the CCI will be shown only on 4 hour or lower timeframes.
These are the values added on this indicator.
Specifications
-This indicator shows one CCI from the current timeframe and another CCI from another timeframe(MTF).
-For MTF CCI, you can select upper timeframe from monthly, weekly, daily, 4hour, 1hour, 30mins, 15mins, 5mins.
Again, if you select weekly for MTF, for instance, then MTF CCI will be displayed on daily or lower timeframes. Other timeframes work same.
-For both CCI(current timeframe) and CCI(MTF), signals will be shown when they cross over/under upper band and lower band, which you can control display on style tab of the indicator.
-Alert can be set same as signal conditions.
Please see the sample chart below.
Brown triangle is signal for CCI(current timeframe) and maroon signal is for MTF CCI.
--------------------------------------------------------------------------------------------------
現在時間軸のCCIと上位足のCCIを表示するマルチタイムフレームCCI(MTF CCI)インジケーターです。アッパーバンド、ロワーバンドと交差した時にシグナルを表示するとともに、アラートの設定も可能です。
CCIの一般的な使い方は以下のリンク(TradingView)を参照ください。
jp.tradingview.com
他のマルチタイムフレームCCIとの違い
他のマルチタイムフレームCCIのインジケーターでは、以下の問題に直面します。
・上位足のCCIを表示すると、さらに上位足でもそのCCIが表示され見にくくなる。
例: 4時間足のCCIを下位足で表示可能な様に設定すると、日足や週足でも表示され、チャートがノイズだらけに・・・
この問題に対して、このインジケーターでは、
・上位足のCCIを表示する時間軸を制御することで上位足で不必要な情報を表示させない。
という機能を加えることでこれらの問題を解決しています。
機能概要
・このインジケーターでは現在の時間軸のCCIと上位足から一つのCCIを表示します。
・上位足は月足、週足、日足、4時間足、1時間足、30分足、15分足、5分足から選択することが可能です。
・上位足のCCIは選択した時間軸未満の時間軸に表示されます。
例:
日足のCCI : 4時間足、1時間足、30分足、15分足、5分足、1分足チャートにのみ表示
4時間足のCCI : 1時間足、30分足、15分足、5分足、1分足チャートにのみ表示
・上位足のCCIは選択した時間軸未満の時間軸に表示されます。
・現在時間軸のCCI、MTF CCIともに、アッパーバンド/ロワーバンドと交差したタイミングでシグナルを表示することができます。(アッパーバンド/ロワーバンドそれぞれに対して上に交差、下に交差のタイミングで表示されます。不要なものはスタイル設定画面で非表示とすることができます。)
・シグナルは設定画面で表示・非表示の切り替えができます。
・シグナルと同じ条件でアラート通知の設定が可能です。
サンプルチャート
1時間足に4時間足のCCIを表示したものです。茶色の三角が現在時間軸のCCIのシグナル。赤の三角がMTF CCIのシグナルです。

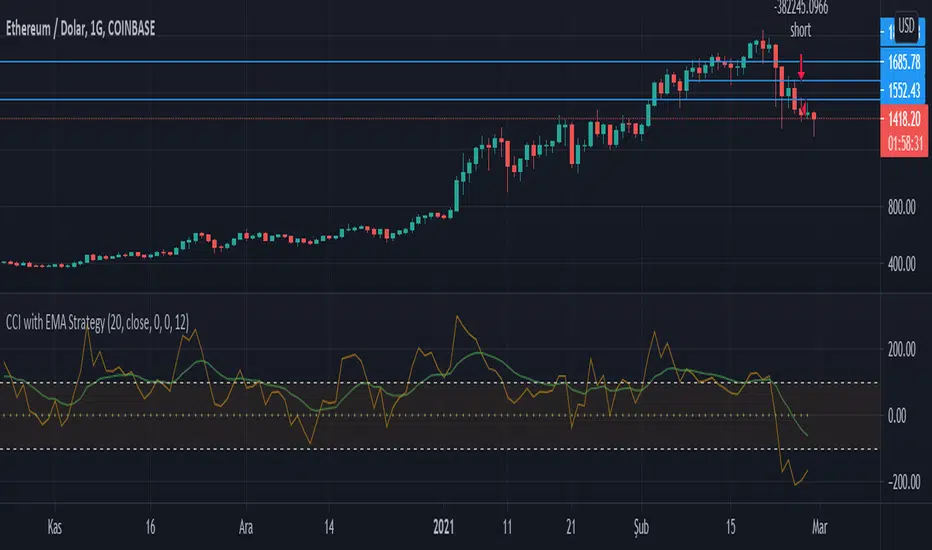
CCI with EMA StrategyI designed it as buy and sell when the cci 0 point cut, but you can optimize it by changing the buy sell points
I used moving average to smooth out cci's movements
Machine Learning: kNN-based Strategy (update)kNN-based Strategy (FX and Crypto)
Description:
This update to the popular kNN-based strategy features:
improvements in the business logic,
an adjustible k value for the kNN model,
one more feature (MOM),
a streamlined signal filter and
some other minor fixes.
Now this script works in all timeframes !
I intentionally decided to publish this script separately
in order for the users to see the differences.

Trend MagicTrend Magic is originally a MT platform (MetaTrader) indicator and it can be used with any forex trading systems / strategies for additional confirmation of trading entries or exits. Converted the MT platform code to TradingView Pine version 4. Also you can use Multiple Time Frame.
It also works well with Crypto and Stock Markets.
Trend Magic consists of two main calculation parts as momentum and volatility:
First part is ATR based (like ATR Trailing Stop) logic, second part is all about CCI which also determines the color of Trend Magic.
Blue: when CCI is positive
Red: when CCI is negative
Also added alert condition regarding price crosses :
when LOW CrossesAbove TM
and HIGH CrossesBelow TM
Enjoy
Kıvanç Özbilgiç

The WWG Plan Indicator V2█ OVERALL
This indicator was specifically created for the Walsh Wealth Group.
In short it is a fusion of some of the most basic and widely used indicators to show overbought patterns and trend reversals.
Its best usage is with LTF scalping and agressive profit taking but can also be used to find HTF dips and buy-zones.
█ FEATURES
Buy Signal (Buy):
Printed only with all confirmations triggered
Small Buy Signal (B1 & B2)
Printed if some of the confirmations are triggered and can be treated as DCA entries or for further
confirmation with other indicators and basic TA.
Crayons (Color Bars):
Blue: RSI is oversold
Olive: RSI and Stoch RSI are oversold
Yellow: RSI, Stoch RSI are oversold and lower Bollinger Bands are crossed by Low
Orange: RSI, Stoch RSI and CCI are oversold
Trailing SL:
If activated in the config, a trailing SL can be displayed on the chart based on ATR.
█ SETTINGS
The underlying indicators used are RSI, Stoch RSI, Bollinger Bands, MACD and CCI.
All possible configs can be changed in the config settings.
█ GENERAL INFORMATION
Depending on the settings, the indicator performance will be highly affected.
This indicator is only displaying highly oversold areas and events of trend reversal it is not a *God*-Signal and will print false positives.
█ ALERTS
An alert for the main buy-signal is implemented and can be used via the TV alert functionality.

StochRSI x RSI x CCI x EMAsWanted to put this out there. Kind of a rough explanation but basically I wanted to build an indicator that takes out emotions and is easy to read. The indicator is basically RSI, stochRSI, CCI, and EMAs into an easy to read package. The traffic lights at the end will tell you if stochRSI/RSI and price action above according to EMA ribbon are in agreement. RSI with a period of 2 also always seemed very useful to me but it was just extremely distracting to look at it. I tried to make many rules in this indicator to find as much confluence between RSI, stochRSI, CCI, and EMAs to help you make better decisions. What is shown on the indicator is not necessarily a buy/sell signal. It should be seen as a way to view strength of price and possible momentum changes.
I find that one of the biggest distractions of indicators is taking your eyes off what is really happening at the chart above. This indicator uses popular and well used tools and helps you to get an easier visual of what is happening.
Purple lines at top and bottom: Short RSI ob/os
Red/orange and blue/green lines at top and bottom: When stochRSI kd and CCI also crosses +/- 100 or 200
Blue background: when stochRSI k > d and short RSI crosses above 30
Red background: when stochRSI k < d and short RSI crosses below 70
Green crosses: StochRSI is above 80 and making higher highs
Red X crosses: StochRSI is below 20 and making lower lows
Red/green fill of stochRSI and purple/blue dots on RSI: When short RSI and stochRSI are both ob/os
Red/green fill of RSI: Green when Long rsi > 50, red when Long rsi < 50
60/40 lines: Possible support/resistance for RSI
Traffic lights
1st light: Long RSI > EMA and stoch RSI k>d or vice versa
2nd light: Price above EMA 1 and 2 or vice versa
3rd light: when lights 1 and 2 are in agreement
Hope you enjoy!
