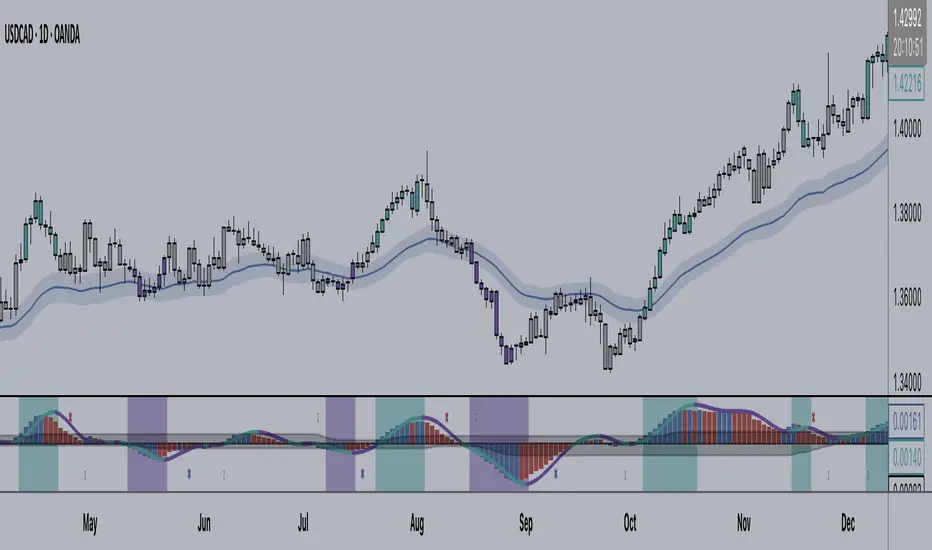
Dynamic Action Convergence DivergenceGoodbye MACD. Hello DACD.
The Dynamic Action Convergence Divergence (DACD) indicator presents a unique approach to understanding market trends and potential price reversals. This indicator is distinctly different from the currently published scripts in the following ways:
1. The DACD is rooted in the principles of the Average Directional Index (ADX) — especially as construed by the helpful work of @robertkowalski — but innovates by focusing on the divergence and convergence of the directional movement indicators (DI+ and DI-). This focus offers a more dynamic perspective on price action.
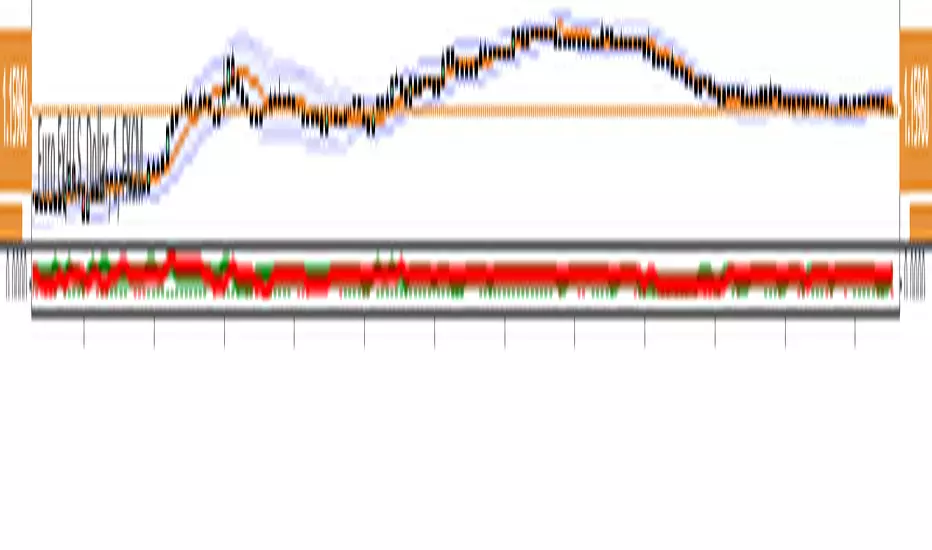
2. The DACD incorporates a histogram representation of the difference between DI+ and DI-, making it easier to visually interpret periods of divergence (potential reversal points) and convergence (potential continuation points).
3. It further enhances interpretation by applying a familiar color scheme to the histogram, allowing for an immediate visual understanding of the trend direction and its strength.
4. Unique to the DACD, it scales the difference between DI+ and DI-, applies a moving average, and then represents this as a line on the graph (referred to as "DI+ - DI-"). This line provides a smoothed view of the difference between DI+ and DI-, offering additional insight into the trend's characteristics.
5. Finally, a second moving average is calculated over the "DI+ - DI-" line, creating a signal line akin to the MACD's signal line. This signal line provides a benchmark to the "DI+ - DI-" line, indicating potential points of trend exhaustion and reversal.
The DACD can be used across various markets, including equities, commodities, forex, and cryptocurrencies, making it a versatile tool for any trader's arsenal. As with any technical indicator, the DACD should be used in conjunction with other indicators and forms of analysis to confirm signals and make more informed trading decisions.
The DACD excels in trending markets where it can highlight potential continuation and reversal points. However, during periods of consolidation or sideways moving markets, the DACD may provide less reliable signals. Therefore, it's essential to consider the overall market context when using the DACD.
The originality of the DACD lies in its novel application of the concepts from the ADX, its unique presentation style, and the additional moving averages applied to the difference between DI+ and DI-. These factors contribute to a unique trading indicator that stands apart from the crowd and offers new opportunities for technical analysis.
~~~
POSTSCRIPT: DACD VS MACD
Goodbye MACD. Hello DACD.
The MACD and DACD, while visually similar due to the familiar color scheme, are fundamentally different in their logic and data processing.
MACD is a trend-following momentum indicator, using the relationship between two moving averages of a security’s price. Its color scheme is well-recognized, assisting traders in quickly interpreting market momentum and potential trend shifts.
On the other hand, DACD, while maintaining a similar visual style for ease of adoption, is rooted in the principles of the Average Directional Index (ADX). It focuses on the divergence and convergence of the directional movement indicators (DI+ and DI-), providing a dynamic perspective on price action.
The familiar color scheme is purposefully used to facilitate easier transition for traders from MACD to DACD, despite their different underpinnings. This allows users to intuitively understand the new indicator while benefiting from its unique insight into market trends.
Continuation

+ Average Candle Bodies RangeACBR, or, Average Candle Bodies Range is a volatility and momentum indicator designed to indicate periods of increasing volatility and/or momentum. The genesis of the idea formed from my pondering what a trend trader is really looking for in terms of a volatility indicator. Most indicators I've come across haven't, in my opinion, done a satisfactory job of highlighting this. I kept thinking about the ATR (I use it for stops and targets) but I realized I didn't care about highs or lows in regards to a candle's volatility or momentum, nor do I care about their relation to a previous close. What really matters to me is candle body expansion. That is all. So, I created this.
ACBR is extremely simple at its heart. I made it more complicated of course, because why would I want anything for myself to be simple? Originally it was envisaged to be a simple volatility indicator highlighting areas of increasing and decreasing volatility. Then I decided some folks might want an indicator that could show this in a directional manner, i.e., an oscillator, so I spent some more hours tackling that
To start, the original version of the indicator simply subtracts opening price from closing price if the candle closes above the open, and subtracts the close from the open if the candle closes below the open. This way we get a positive number that simply measures candle expansion. We then apply a moving average to these values in order to smooth them (if you want). To get an oscillator we always subtract the close from the open, thus when a candle closes below its open we get a negative number.
I've naturally added an optional signal line as a helpful way of gauging volatility because obviously the values themselves may not tell you much. But I've also added something that I call a baseline. You can use this in a few ways, but first let me explain the two options for how the baseline can be calculated. And what do I mean by 'baseline?' I think of it as an area of the indicator where if the ACBR is below you will not want to enter into any trades, and if the ACBR is above then you are free to enter trades based on your system (or you might want to enter in areas of low volatility if your system calls for that). Waddah Attar Explosion is another indicator that implements something similar. The baseline is calculated in two different ways: one of which is making a Donchian Channel of the ACBR, and then using the basis as the baseline, while the other is applying an RMA to the cb_dif, which is the base unit that makes up the ACBR. Now, the basis of a Donchian Channel typically is the average of the highs and the lows. If we did that here we would have a baseline much too high (but maybe not...), however, I've made the divisor user adjustable. In this way you can adjust the height (or I guess you might say 'width' if it's an oscillator) however you like, thus making the indicator more or less sensitive. In the case of using the ACBR as the baseline we apply a multiplier to the values in order to adjust the height. Apologies if I'm being overly verbose. If you want to skip all of this I have tooltips in the settings for all of the inputs that I think need an explanation.
When using the indicator as an oscillator there are baselines above and below the zero line. One funny thing: if using the ACBR as calculation type for the baselines in oscillator mode, the baselines themselves will oscillate around the zero line. There is no way to fix this due to the calculation. That isn't necessarily bad (based on my eyeball test), but I probably wouldn't use it in such a way. But experiment! They could actually be a very fine entry or confirmation indicator. And while I'm on the topic of confirmation indicators, using this indicator as an oscillator naturally makes it a confirmation indicator. It just happens to have a volatility measurement baked into it. It may also be used as an exit and continuation indicator. And speaking of these things, there are optional shapes for indicating when you might want to exit or take a continuation trade. I've added alerts for these things too.
Lastly, oscillator mode is good for identifying divergences.
Above we have the indicator set to directional, or oscillator, mode. Baselines are Donchian Channels. I changed the default EMA length from 4 to 24 in this case, otherwise all the settings are default, as in the main image for the indicator (which is clearly set to non-directional). The indicator is set to requiring an advancing signal line for background and bar colors. Background color is not on by default. Candle colors, as you can see are aqua when above the top baseline (and only when the signal line is advancing, as per the settings), magenta when below the bottom baseline, and grey for anything else. The red and blue X's are exit signals. There are two types: one, when the signal line weakens and, two, when the ACBR crosses above or below the signal line. There are also arrows. These are continuation signals (ACBR crossing signal line).
Same image as above, but the baselines are set to ACBR rather than Donchian Channels.
Again, the same image, but with everything but the ACBR Baseline turned off. You can see how this might make for an excellent confirmation indicator, but for the areas of chap. Maybe run a second instance of the indicator on your chart as a volatility indicator, as you would not be using it in that way in this instance.
Here I have bar coloring turned off except for signal line crosses NOT requiring the signal line to be advancing. Background coloring is also turned on. You can see that these all line up with continuation signals, or exits for purple candles.
Same image as above but requiring the signal line to be advancing. You can see that continuation signals are not contingent upon the signal line to be advancing. I had it setup that way at first, but of course it still gave false signals, so I thought more signals (not that there are many) is better than fewer. To be sure, just because the indicator shows a continuation signal does not mean you should always take it.
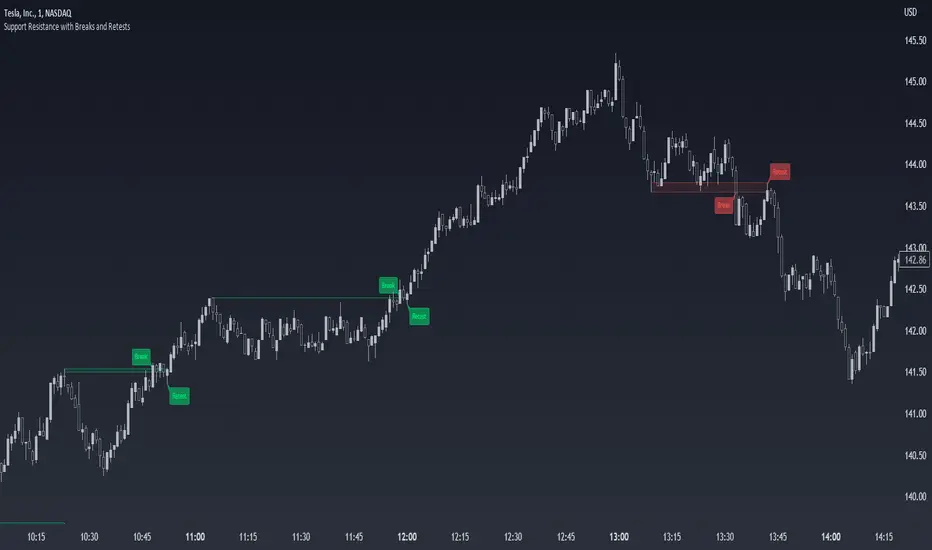
Support Resistance with Breaks and RetestsThe Break and Retest indicator strives to provide a visual aid for spotting areas of continuation and pullbacks. Support and resistance levels are drawn out automatically and have sequential conditions in place to determine a breakout following an eventual retest. Additionally, there are methods in place that try and detect liquidation events and still output a retest.
Although there are options to adjust repaint settings, "potential labels" are structured in a way to detect live ongoing retest events and therefore will be the only thing in the script that will be forced to repaint.
🔳 Settings
Lookback Range: Lookback period to trigger a new support/resistance level when pivot conditions are met.
Bars Since Breakout: How many bars since breakout in order to detect a retest.
Retest Detection Limiter: Whenever a potential retest is detected, the indicator knows that a retest is about to happen. In that given situation, this input grants the ability to raise the limit on how many bars are allowed to be actively checked while a potential retest event is active. For example, if you see the potential retest label, how many bars do you want that potential retest label to be active for to eventually confirm a retest?
🔳 Repaint Options
By default, the break and retest system uses the current close value to determine a condition. (Repaints by default)
On: Allows repainting
Off - Bar Confirmation: Prevents repainting and generates alerts when the bar closes. (1 candle later)
Off - High & Low: Prevents repainting, but in return utilizes both the high and low values instead of the close which may yield a higher outcome and inaccurate results.
🔳 How it works
In the background, calculations aren't searching for the perfect retest within the zone but instead focuses its attention towards price fluctuation around the zones. This allows the indicator to yield more results than it would otherwise.
The chart below provides an example of how potential retests are established. These are updated constantly until a retest is confirmed, and deleted if not. If a potential retest is active and the next candle drops below the value when the potential retest was detected, a retest is placed..
🔳 Alerts
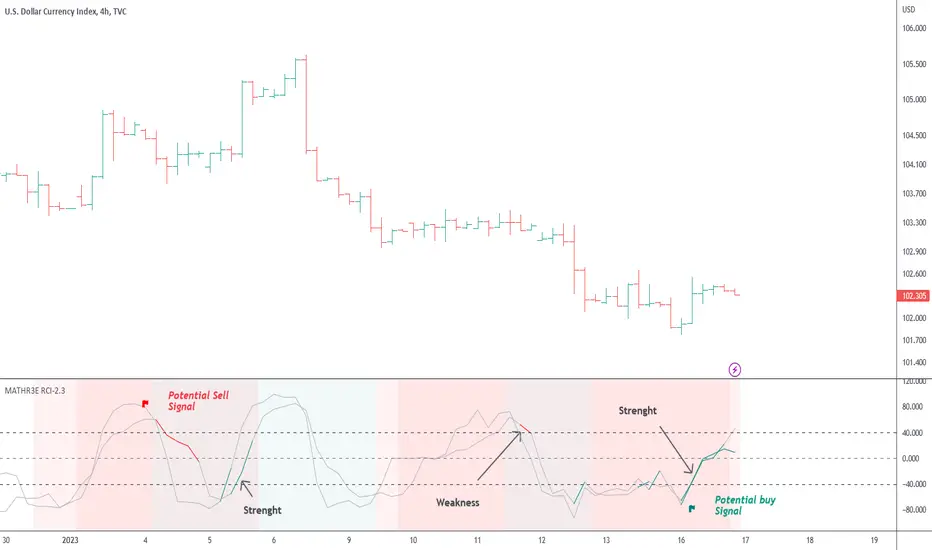
MATHR3E Range Conquest Index█ OVERVIEW
MATHR3E Range Conquest Index (RCI) is an arithmetic oscillator for trend analysis.
█ CONCEPTS
Disclaimer
MATHR3E RCI indicator is intended for advanced traders and may fit your profile, whether you are a day trader or a long-term investor.
It was originally developed by a renowned market analyst and documented in numerous books. Among them is the author Jason Perl.
It is recommended to have read the trading techniques mentioned in the books covering this indicator beforehand.
Introduction
MATHR3E RCI can serve several purposes:
• By helping to confirm price reversals.
• By giving low risk potential entry indication
• By outlining the emergence of a price trend
How to use
MATHR3E RCI is a dual oscillator.
Each oscillator compares the price evolution of a given day with that of two trading days earlier.
They differ in the amount of trading bars taken into account when calculating the RCI.
Oscillator values fluctuate between overbought and oversold levels
The time spent above or below these levels is compared to the Duration Analysis parameter (in bars).
When it is greater than this Duration, an excessive move is underway which usually require the oscillator to return to the neutral zone.
Strengths or weaknesses are then detected when the oscillator returns to its zone of excess by marking a mild reading, i.e. spending less time than the duration analysis parameter.
█ FEATURES & BENEFITS
Versatile
The indicator is designed to work with other indicators by the same author, including the identification of exhaustion points.
This indicator can be applied to any market or time frame.
Price Oscillator Qualifier
Identify low-risk buy or sell opportunities with
• Qualified upside breakouts
• Qualified downside breakouts
Fully Customizable
Multiples settings available to configure
• Oscillator Periods
• Duration Analysis
• Overbought and oversold reading
Alerts
Get notified on:
• Weakness signal
• Strength signal
• POQ signals
Neo's %KIn my opinion the %K is the only part of the stochastic that you actually need. It's the fast RSI, so it responds much better to large price movements and reveals divergence a lot sooner than %D. The %D has no real confluence with the rest of my strategy so, I only use %K.

Divergence HunterThis script searches multiple divergences based on the wave trend indicator
You could combine support and resistance to identify with the bearish divergence a Potential Top.
Bullish divergence on the other hand could indicate that the market found its bottom and you should keep your eye open for an long entry.
If you are already short and took some profit the hidden bearish divergence could indicate a continuation of the downtrend. Could also be used together with Fib-Retracement to find a reentry or an add for your current entry.
Hidden bull divs could be used to find a reentry in the current up trending move or of course could be used as and add for your current position.
If you want to try it or have questions leave me a message.
DISCLAIMER: No sharing, copying, reselling, modifying, or any other forms of use are authorized for the documents, script / strategy, and the information published with them. This informational planning script / strategy is strictly for individual use and educational purposes only. This is not financial or investment advice. Investments are always made at your own risk and are based on your personal judgement. I am not responsible for any losses you may incur. Please invest wisely.
BenTrading bullish trend continuation sweepThis script uses simple features to indicate where a trend may continue.
It uses market structures and monitors breaks of swing highs and swing lows.
If there is a break upwards, the alert will give signal when there is a sweep that forms in the biased direction (see chart - alert will trigger on candle close).
For it to send alerts you must right click the indicator and apply alert - "once per bar".
This indicator only shows bullish signals, while there is another indicator that can be used alongside it to indicate bearish trend continuation with the same features.

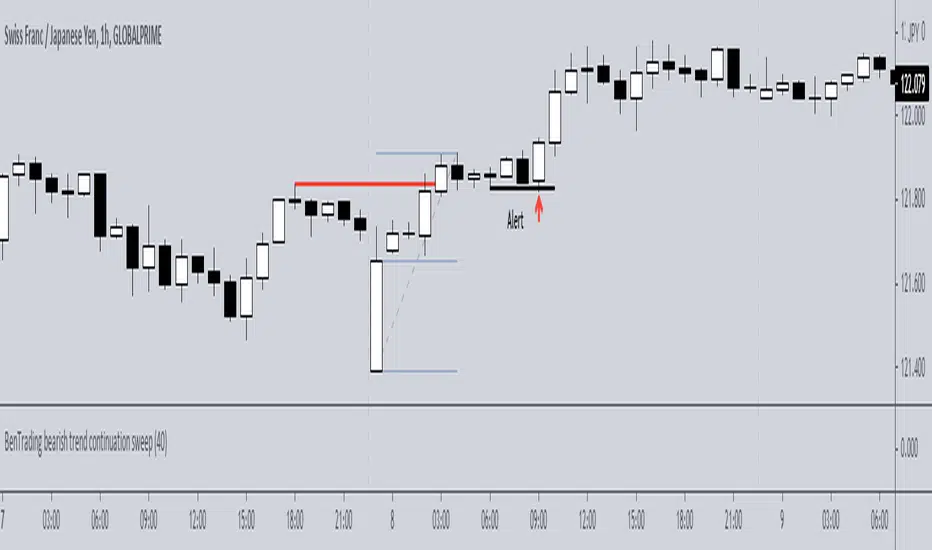
BenTrading bearish trend continuation sweepThis script uses simple features to indicate where a trend may continue.
It uses market structures and monitors breaks of swing highs and swing lows.
If there is a break downwards, the alert will give signal when there is a sweep that forms in the biased direction (see chart - alert will trigger on candle close).
For it to send alerts you must right click the indicator and apply alert - "once per bar".
This indicator only shows bearish signals, while there is another indicator that can be used alongside it to indicate bullish trend continuation with the same features.
BenTrading bullish trend continuation trackerThis script uses simple features to indicate where a trend may continue.
It uses market structures and monitors breaks of swing highs and swing lows.
If there is a break upwards, the alert will give signal when swing points forms (see chart - alert 1) or when sweeps form (see chart - alert 2).
For it to send alerts you must right click the indicator and apply alert - "once per bar".
This indicator only shows bullish signals, while there is another indicator that can be used alongside it to indicate berish trend continuation with the same features.

Entry master RSI pullbackSimply using a single RSI and placing a signal after it crosses the 50 level after being overbought or oversold in the same direction.

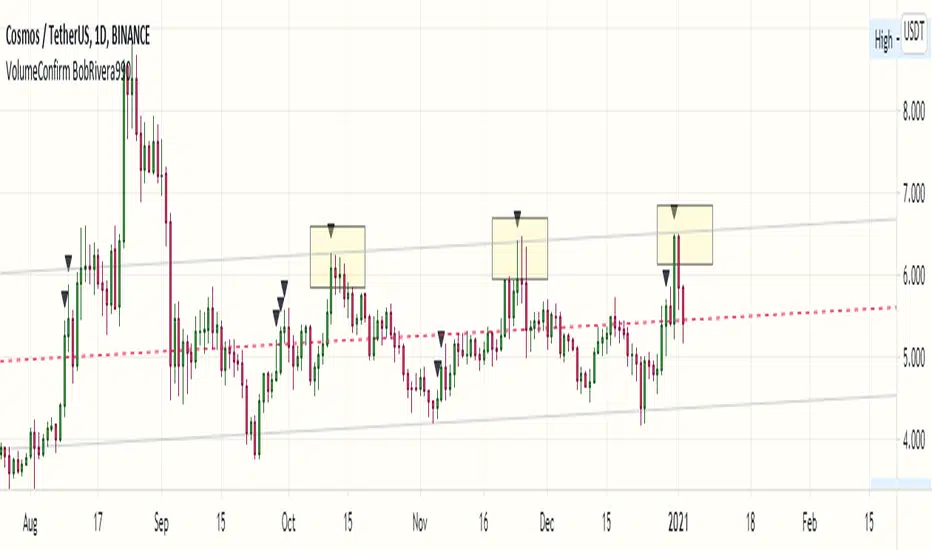
Volume Confirmation Signal by BobRivera990The purpose of this script is to determine the response of trading volume to price action
This is not an indicator but a set of four signals
1 - Bullish Strength Signal (Upward Green Triangle) :
If the resistance is broken at the same time is valid
this signal indicates the continuation of the bullish trend
the trading volume is relatively high.
If the bar is closed above the resistance level, It will probably turn into support.
2 - Bullish Reversal Signal (Upward Black Triangle) :
if the bar is closed above the support level is valid
this signal indicates trend reversal after a bearish candle
the trading volume is very high.
3 - Bearish Strength Signal (Downward Red Triangle) :
If the Support is broken at the same time is valid
this signal indicates the continuation of the bearish trend
the trading volume is relatively high.
If the bar is closed below the support level, It will probably turn into resistance.
4 - Bearish Reversal Signal (Downward Black Triangle) : if the bar is closed below the resistance level is valid
this signal indicates trend reversal after a bullish candle
the trading volume is very high.
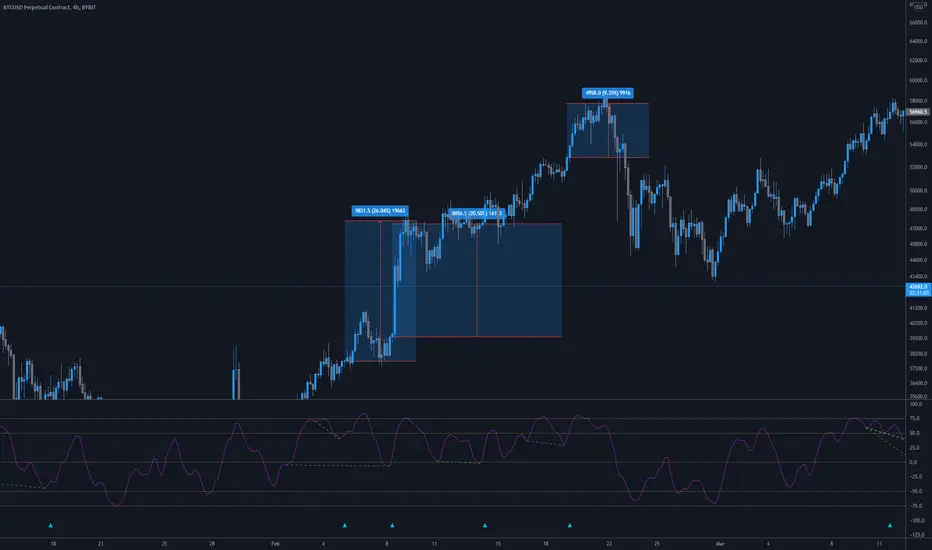
VPR Grid█ OVERVIEW
Official release of VPR Grid, a mean reverting, trend discovering tool meant to protect capital and find high probability entries.
What this indicator is meant to be used for:
Mean reverting trades
Entries or exits for either swing trades or scalps
Traditional and cryptocurrency markets
Low and high timeframe setups
Sentiment checks
Options to configure:
Optionally use volume in analysis
Use intraday, daily, weekly, or month calculation + choose how many periods of each
Moving average length. This is best kept on the lower end for cryptocurrencies, with respect for volatility
Grid spacing: a purely comestic option that should help with viewing the indicator.
The most important thing to use VPR effectively is to use its settings. The flexibility of VPR Grid is given through its settings. The development that went towards mean reversion and trend discovering means it is a hybrid of fading and trend following tools.
This is a paid premium indicator; please DM me for access. See the images below for examples/explanations on the indicator. Take note of the indicator arguments and which settings were used for a certain timeframe or asset class.

RSI MTF thresholds with auto adjustmentThe RSI MTF thresholds panel allows for identification of strong trends across multiple timeframes with automatic adjustment for different timeframes by utilising multiples of the chosen resolution. A specific timeframe can be used by entering its multiple in the corresponding Resmult() box.
The panel shows the current timeframe as well as 4 additional timeframes, displaying whether the RSI level is above a high threshold or below a low threshold.
A green or red indication on all timeframes is a strong indication of a trend that has some staying power on the timeframe under examination.
Markets that are ranging with no identifiable trend will show blank spaces.
Failure of the trend to "climb up" the panel shows a weak trend, while repeated signals in the same direction is a strong indication of a trend forming as the RSI level is prevented from cycling to the opposing extreme.
High probability continuations can be identified by a brief loss of signal at the lowest level of the panel only (corresponding to the current timeframe).
Setting the thresholds higher towards the overbought/oversold regions will identify levels that are oversold on multiple timeframes.
Happy to take suggestions or attempt to modify if there is interest.

CCI - SWIFF KNIFECCI indicator swiff knife.
A lot of different usages of CCI ae possible with this script :
- 2 CCI lines crossovers.
- CCI - 0 Line crossovers
- CCI + Moving Average crossovers (many types of MA are available)
Filters can be added.
CCI can be used as a confirmation indicator, a continuation indicator, an exit indicator, a chopiness indicator .... It can even make coffee, who knows.

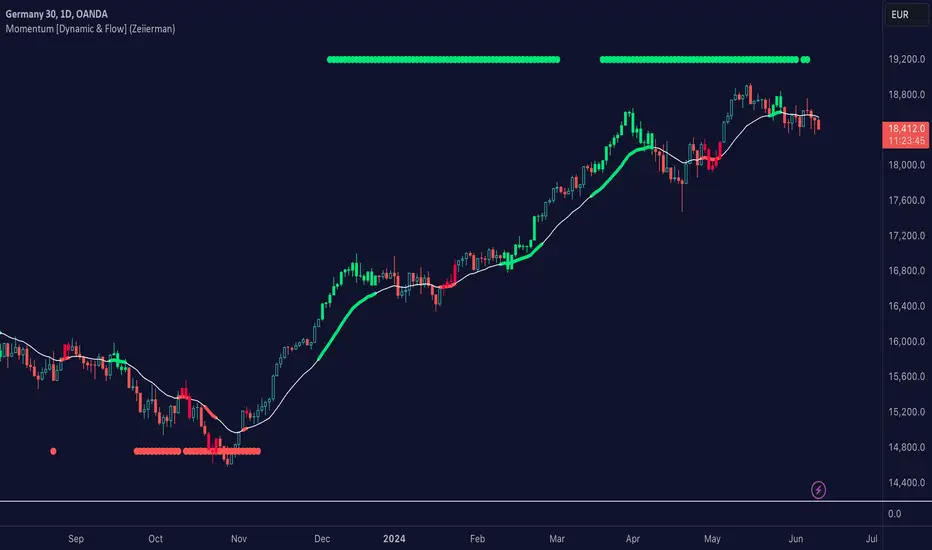
Momentum [Dynamic & Flow] (Expo)Momentum Dynamic & Flow (Expo) is a useful indicator that displays the momentum - as dynamic & flow, as well as where the momentum begins to stall.
♢ Momentum -Dynamic can be used to identify overbought and oversold areas.
♢ Momentum -Flow can be used to identify if the current trend has strong momentum.
♢ When momentum begins to stall it can be identifiable turning points, areas of congestion. However, it's not a sign that the trend is over, see it as "heads up" This is displayed with green and red colors on the moving average.
Momentum can be displayed at the top/bottom of the chart or above/below the bars. The user can also display momentum as BGcolor.
The indicator can be used standalone or as a part of your current trading strategy
HOW TO USE
1. Use the indicator to identify where the momentum stall.
2. Use the indicator to identify overbought/oversold areas with momentum -Dynamic.
3. Use the indicator to confirm the existence, or a continuation, of a trend with momentum -Flow.
INDICATOR IN ACTION
1-hour chart
4-hour chart
I hope you find this indicator useful , and please comment or contact me if you like the script or have any questions/suggestions for future improvements. Thanks!
I will continually work on this indicator, so please share your experience and feedback as it will enable me to make even better improvements. Thanks to everyone that has already contacted me regarding my scripts. Your feedback is valuable for future developments!
-----------------
Disclaimer
Copyright by Zeiierman.
The information contained in my scripts/indicators/ideas does not constitute financial advice or a solicitation to buy or sell any securities of any type. I will not accept liability for any loss or damage, including without limitation any loss of profit, which may arise directly or indirectly from the use of or reliance on such information.
All investments involve risk, and the past performance of a security, industry, sector, market, financial product, trading strategy, or individual’s trading does not guarantee future results or returns. Investors are fully responsible for any investment decisions they make. Such decisions should be based solely on an evaluation of their financial circumstances, investment objectives, risk tolerance, and liquidity needs.
My scripts/indicators/ideas are only for educational purposes!
NCTA Adaptive Entry SystemAdaptive Entry System (AES)
Price action of stocks, indexes, and futures consists of periods of trending action, retracements within the trend and then a resumption of the original trend. Trending patterns do not move straight up or straight down. They move in cycles which, when properly identified, can offer traders an opportunity to “follow the trend” while also recognizing the probability of a near term retracement before resuming movement in the direction of the trend. Experienced traders with advanced skills at interpreting wave patterns (Elliott Wave), Fibonacci retracements, Stochastics (overbought / oversold conditions), Momentum, and Moving Averages apply their advanced knowledge to trading and identifying these trend - retracement - continuation of trend cycles. These skills require an advanced knowledge of these complex indicators and can be difficult for traders without the same skill set to optimize their trading performance.
The Adaptive Entry System (AES) was created as a technical market metrics system to interpret a variety of advanced signals and present to the trader a “single actionable signal” displayed in an easy to recognize format for traders of most any skill level to benefit from.
AES is a “system” as opposed to a single indicator. It was designed with the goal of simplifying a traders ability to recognize an entry opportunity by summarizing the consensus of several key indicators and displaying a single entry / exit signal in a color highlighted, strategy labeled format. The work of comparing a variety of indicators and assessing the strength of alignment is performed for the trader by the Adaptive Entry System.
There are three possible entry signals displayed. A trader may trade all three or customize the settings to choose just a single signal to trade. It is important for any trader incorporating AES into their toolset that they trade in sim / virtual mode for a period of time to confirm they understand how price action responds to the signals and to personally track the performance of each. A good trading system still requires due diligence on the part of the trader to confirm understanding of how the system performs.
Entry Signal #1 Description:
Trend Bias Plus Signal is intended to provide traders with an early view of the probable directional bias of the stock, index, or futures being traded. Trend Bias was designed to recognize the probability of the early stages of the strongest segment of a wave pattern. Recognizing the probable bias of the trend at an early stage and also having an indication of when that trend may be ending offers traders an opportunity to enhance their ability to optimally benefit from the trend.
How to Read the Trend Bias Plus Signal:
The Trend Bias Plus Signal is displayed as a simple to recognize color coding of the price bars. Blue price bars indicate a probable rising price bias. Red price bars indicate a probable declining price bias. White bars indicate a neutral period with no clear directional bias.
How to Trade the Trend Bias Plus Signal:
The Trend Bias Plus Signal is simple to interpret. When a price bar closes blue and the next price bar opens blue, this signals to the trader to open an upward bias position. Buy-to-open a call option, buy the stock, or open a long futures position. When a price bar closes red and the next price bar opens red, this signals to the trader to open a downward bias position. Buy-to-open a put option, short the stock or close a long stock position, or open a short futures position.
When holding a short or long position based on the Trend Bias Plus, there are a variety of exit methods which a trader can use including stops, limit price orders with fixed profit targets, or trail stops. Regardless, the end of a Trend Bias Plus cycle is indicated when a new price bar opens white. This is evidence that the current rising or declining trend is shifting to a neutral state. A trend may also be viewed as having ended when an opposite color bar prints at the open of a new price bar.
Entry Signal #2 Description:
The Momentum Signal is a near term indication of a probable retracement of the current trend. It identifies a temporary reversal of an overarching trend in a stock's price. Retracements are short-term periods of movement against a trend, followed by a return to the previous trend. Momentum signals are usually counter-trend trades identifying that part of the wave sequence where price temporarily moves opposite the direction of the trend. The momentum signal can be an opportunity for traders to take advantage of the natural pattern of trend - retracements - continuation.
How to Read the Momentum Signal:
The Momentum signal is displayed as a vertical color highlight on the price bar with a “M” label inside a directional indicator box. A red vertical highlight with an arrow box and “M” label pointing lower is a signal that the near term price movement may be downward bias. For an upward bias price movement signal, the Momentum indicator will display a green highlight across the price bar with an arrow box and “M” label pointing higher.
How to Trade the Momentum Signal:
When the highlighted directional labeled box prints at the open of a new price bar, take the trade based on the directional bias displayed. Momentum signals are generally counter trend indicators so a downward bias red bar, prompting the trader to go short may print on a long bias blue Trend Bias Plus price bar. This should not be viewed as a conflict but instead as a probable indication of a short term retracement following the natural sequence of cycles in price movement.
Momentum signals may be traded using stocks, options, or futures.
Entry Signal #3 Description:
The Consensus Signal is an indication that price action may be resuming in the direction of the primary trend.
How to Read the Consensus Signal:
The Consensus Signal is displayed as a vertical color highlight on the price bar with a “C” label inside a directional indicator box. A red vertical highlight and an arrow box with a “C” label pointing lower is a signal that the price movement may be resuming a downward bias trend or strengthening a conviction to the current trend. For an upward bias price movement signal, the Consensus indicator will display a green highlight across the price bar and an arrow box with a “C” label pointing higher. This is a signal that the retracement off of the trend may be concluding and/or a strengthening of a conviction to the current trend.
How to Trade the Consensus Signal:
When the highlighted directional labeled box prints at the open of a new price bar, take the trade based on the directional bias displayed. Consensus signals are generally most productive when traded aligned with the trend, as displayed by the Trend Bias Plus price bar color or when a white bar indicates a neutral state of the price trend. Counter trend trades using the Consensus Signal are not advised and considered to be less productive / higher risk.
Consensus signals may be traded using stocks, options, or futures.
Some General Rules:
Trade signals are only considered valid when they display at the open of a new price bar.
The signals can be traded on different timeframe charts from short term 3 minute charts to longer timeframe daily charts.
The signals are designed to be a generic indication of probable price movement and as such, can be used effectively for trading futures, stocks, options on stocks, options on ETFs, and options on cash settled indexes.
AES offers traders an opportunity to optimize performance from the natural cycles of the market….trend - retracement - continuation.
AES offers an opportunity for traders to have a clear entry / exit criteria. However, it is still imperative that each trader understands the trading strategy they intend to use and the risks and opportunities associated with that strategy. It is highly advised, regardless of the system or strategies being used, that a trader validates their understanding of the system/strategy by trading in a simulated, paper account format to self test the system and personal ability to trade it successfully.
Next Bar Alert:
Included is an optional "Next Bar Alert" setting. Since many of these signals benefit from very prompt action at the beginning of a price bar, there is an additional option in Settings to set an arbitrary number of seconds to be alerted before the next price bar opens. Simply set this to a level you prefer, then set an alert in TradingView on the indicator using the "Next Bar Alert" alert parameter.
Summary:
The color highlight indicator allows the trader to be 100% certain that the rules/criteria for confirming a valid entry were met at the open of the price bar. This feature, along with the alert settings in Trading View, provide clear confirmation of the timing and print of the signal as either valid or not.
Adaptive Entry System has been designed to help traders of all skill levels to trade the natural sequence of patterns in price action using a simple to recognize, single signal entry/exit format. The natural cycle of trend (Trend Bias Plus), then retracement (Momentum), followed by a continuation of the original trend (Consensus) can be identified within this system and offers traders a simple signal to take advantage of each phase in the cycle. Stock investors, options traders, and futures traders can benefit from the simple design of the AES on a variety of time frames.
Trend Bias Plus signals on NASDAQ:TSLA Daily chart:
Trend Bias Plus signals on NASDAQ:AMZN Daily chart:

Price Continuation (The Strat)Shows the historic bar type, whether it is up, down, up and inside, down and inside, up and outside, or down and outside. Will only display historic bar type based on the selected time timeframe. (Ex. if you are looking at the weekly time frame, you will only see the bar type for Year, Quarter, Month, and Week. It will not display the Day or Hour bar type.)

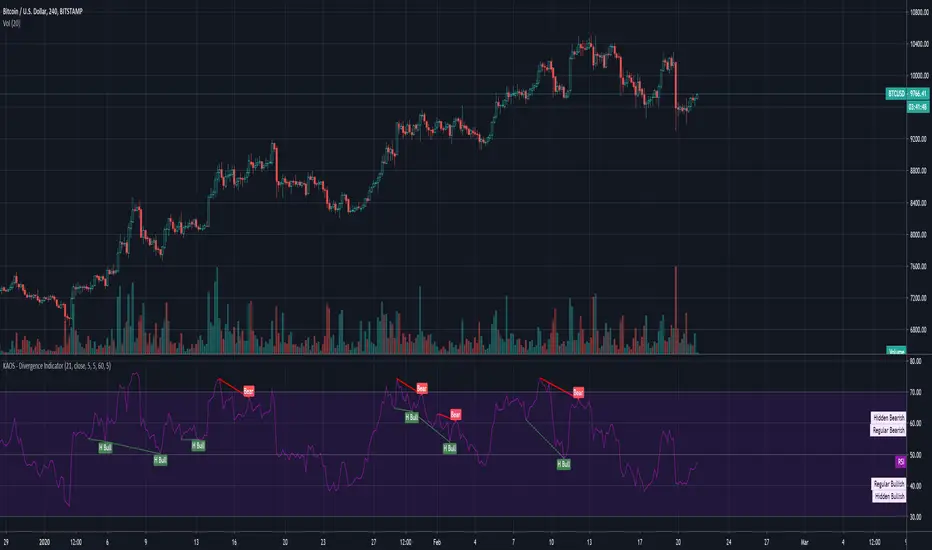
KAOS - Divergence IndicatorDivergence Indicator... Works pretty well, Use with caution as it does amend itself depending on market whale activity.
1hr, 4hr and Daily good for macro movements.
Should be used a supplemental indicator to your over all strategy NOT as a entry exit.
Have fun :)
Made by someone else, but has been tweaked with better settings
Adaptive Trend (Expo)Adaptive Trend (Expo)
DESCRIPTION
This Adaptive Trend (Expo) indicator is used to detect trends as well as to adapt to the trend characteristic in order to filter-out trend noise. Having an indicator like this enables professional traders to stay longer in trends. The indicator is also equipped with upper- and lower boundaries as well as a mid-line.
Positive trend
If the two trendlines (positive & negative trendline) emerges into one single line, it’s regarded as a positive trend. If a green cloud is painted in the indicator it’s a sign that the indicator is categorizing that price move as noise, and thus the professional trader should keep their long position, or enter Long.
Negative trend
If the two trendlines (positive & negative trendline) separates and become two lines as well as a red cloud is painted in the indicator, this is regarded as a negative trend.
As a general rule, if the ‘positive & negative trendline’ is above the midline there is a positive trend. If the ‘positive & negative trendline’ is below the midline there is a negative trend.
You have the possibility to change the ‘trendvalue’, a shorter length is more sensitive than a longer length.
HOW TO USE
1. Use the indicator to identify trends.
2. Use the indicator as a trend following strategy.
INDICATOR IN ACTION
EURUSD
EURUSD
EURUSD
BTCUSD
The indicator works with RENKO, HEIKIN ASHI and with KAGI charts as well.
I hope you find this indicator useful, and please comment or contact me if you like the script or have any questions/suggestions for future improvements. Thanks!
I will continue to work on this indicator, so please share your experience and feedback with me so that I can continuously improve it. Thanks to everyone that have contacted me regarding my scripts. Your feedback is valuable for future developments!
ACCESS THE INDICATOR
• Contact me on TradingView or use the links below
-----------------
Disclaimer
Copyright by Zeiierman.
The information contained in my scripts/indicators/ideas does not constitute financial advice or a solicitation to buy or sell any securities of any type. I will not accept liability for any loss or damage, including without limitation any loss of profit, which may arise directly or indirectly from use of or reliance on such information.
All investments involve risk, and the past performance of a security, industry, sector, market, financial product, trading strategy, or individual’s trading does not guarantee future results or returns. Investors are fully responsible for any investment decisions they make. Such decisions should be based solely on an evaluation of their financial circumstances, investment objectives, risk tolerance, and liquidity needs.
My scripts/indicators/ideas are only for educational purposes!

Trade Genius Sling Shot 2.0Our proprietary continuation signal. This is a compliment to the original slingshot, using a different algorithm to catch different types of continuation patterns.

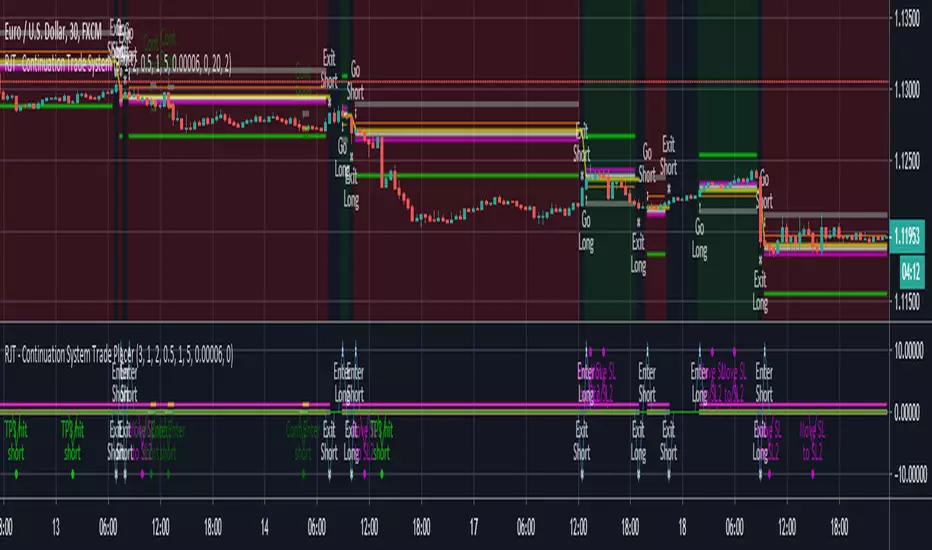
RJT CONTINUATION TRADE STRATEGY - TRADE ENTRY INDICATORThis indicator is used to trade the RJT Continuation Trade Strategy . The fundamental idea behind this strategy is that a trend will continue. Initial entries are placed along with take profit targets and stop losses, then additional entries are placed when pull backs are identified.
This indicator highlights when to place Trade Entries - both long and short, as well as Take Profits and Stop Losses, below the price chart.
This is most powerful when combined with the RJT Continuation Trade Strategy - Trade Overview Indicator
RJT CONTINUATION TRADE STRATEGY - TRADE OVERVIEW INDICATORThis indicator is used to trade the RJT Continuation Trade Strategy . The fundamental idea behind this strategy is that a trend will continue. Initial entries are placed along with take profit targets and stop losses, then additional entries are placed when pull backs are identified.
This indicator gives an overview of where Trade Entries - both long and short, as well as Take Profits and Stop Losses are on the price chart.
This is most powerful when combined with the RJT Continuation Trade Strategy - Trade Entries Indicator

Mean Reversion and Momentum - Indicator versionMean Reversion and Momentum
Interpretation:
- Divergence means trend reversal
- Parallel movement means trend continuation
Squares above serve as a confirming signal