Super Guppy StrategyCM Super Guppy with Long/Short signals, backtesting, and additional options. Updated for PineScript v4.
COINBASE:BTCUSD
Features 2 primary modes, depending on your risk profile. These options are available in the settings:
"Early Signals" ON (default):
Prints a "long" on grey to green transitions AND red to gray transitions.
Prints a "short" on green to grey transitions AND gray to red transitions.
Will not print back-to-back repeated positions (i.e. green → grey → red will only print the first green → gray "short" signal and not print "short" twice).
Rotates long and short positions with no delay.
"Early Signals" OFF
Will close trades, but never open new ones, when guppy transitions to from any color to gray.
Open long: guppy transitions gray to green.
Close long: guppy transitions green to gray.
Open short: guppy transitions gray to red.
Close short: guppy transitions red to gray.
Does not rotate long and short positions back to back.
Additionally:
Can toggle on/off the 200EMA. Default is off.
Can toggle on/off short positions. Default is on.
In development: alerts
加密货币

ETF / Stocks / Crypto - DCA Strategy v1Simple "benchmark" strategy for ETFs, Stocks and Crypto! Super-easy to implement for beginners, a DCA (dollar-cost-averaging) strategy means that you buy a fixed amount of an ETF / Stock / Crypto every several months. For instance, to DCA the S&P 500 (SPY), you could purchase $10,000 USD every 12 months, irrespective of the market price. Assuming the macro-economic conditions of the underlying country remain favourable, DCA strategies will result in capital gains over a period of many years, e.g. 10 years. DCA is the safest strategy that beginners can employ to make money in the markets, and all other types of strategies should be "benchmarked" against DCA; if your strategy cannot outperform DCA, then your strategy is useless.
Recommended Chart Settings:
Asset Class: ETF / Stocks / Crypto
Time Frame: H1 (Hourly) / D1 (Daily) / W1 (Weekly) / M1 (Monthly)
Necessary ETF Macro Conditions:
1. Country must have healthy demographics, good ratio of young > old
2. Country population must be increasing
3. Country must be experiencing price-inflation
Necessary Stock Conditions:
1. Growing revenue
2. Growing net income
3. Consistent net margins
4. Higher gross/net profit margin compared to its peers in the industry
5. Growing share holders equity
6. Current ratios > 1
7. Debt to equity ratio (compare to peers)
8. Debt servicing ratio < 30%
9. Wide economic moat
10. Products and services used daily, and will stay relevant for at least 1 decade
Necessary Crypto Conditions:
1. Honest founders
2. Competent technical co-founders
3. Fair or non-existent pre-mine
4. Solid marketing and PR
5. Legitimate use-cases / adoption
Default Robot Settings:
Contribution (USD): $10,000
Frequency (Months): 12
*Robot buys $10,000 worth of ETF, Stock, Crypto, regardless of the market price, every 12 months since its founding time.*
*Equity curve can be seen from the bottom panel*
Risk Warning:
This strategy is low-risk, however it assumes you have a long time horizon of at least 5 to 10 years. The longer your holding-period, the better your returns. The only thing the user has to keep-in-mind are the macro-economic conditions as stated above. If unsure, please stick to ETFs rather than buying individual stocks or cryptocurrencies.

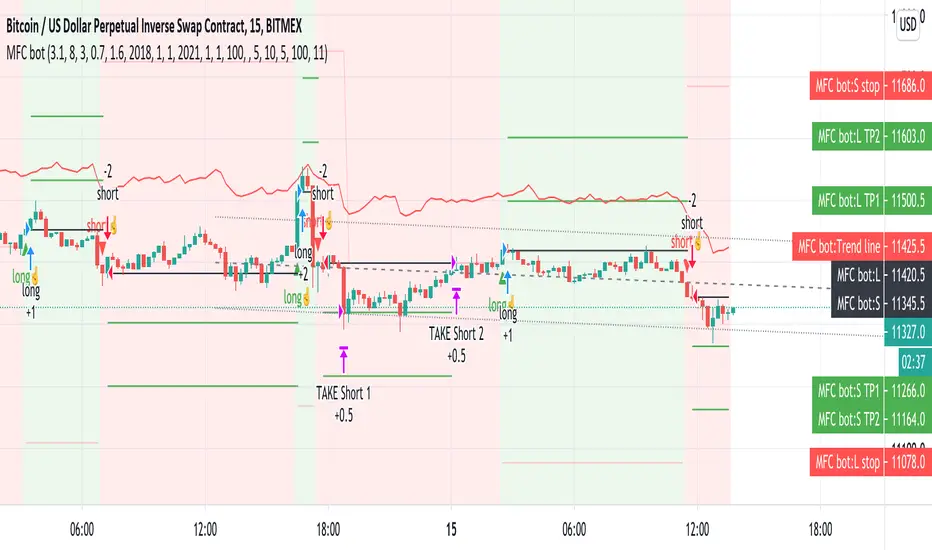
Money Flow Club Bot Strategy 1-15 min ALLENG:
Friends, in this script, there is a function that calls the closing of the candle by Heikin ASHI candles.
You can disable it in the indicator settings.
There is no redrawing of the indicator on regular candlesticks.
The indicator is easy to set up for any trading pairs and any exchanges.
It has an entry point and provides 2 take profit.
It also contains consolidation zones when the price moves for a short time in the range that is visible on the indicator.
In order to try the indicator write in your personal messages.
The strategy does not specify a condition for exiting the position when the first take is taken, the stop is moved to breakeven, so the chart in the strategy turned out to be torn.
RUS:
Друзья, в этом скрипте присутствует функция вызывающая закрытие свечи по свечам Хейкин Аши.
Её можно отключить в настройках индикатора. На обычных свечах перерисовка индикатора отсутствует.
Индикатор легко настроить на любые торговые пары и любые биржи. А нем есть точка входа и предусмотрены 2 тейк профита.
Так же в нем присутствуют зоны консолидации когда цена короткое время движется в диапазоне который виден на индикаторе.
Для того что бы попробовать индикатор напишите в личные сообщения.
В стратегии не прописано условие выхода из позиции когда первый тейк взят, то стоп переносится в безубыток, поэтому график в стратегии получился рваный.
RSI + MFI - Crypto Bull and Bear market A fancy styled version of the RSI (Relative Stochastic Index) + MFI (Money Flow Index) oscillators in order to emphasize buy and sell opportunities.
The 80 and 20 Bands are meant to be used in Bull or Bear markets. Better performing in D timeframes.
The circles represent the cross between RSI and MFI .
Designed for Crypto Markets
Thanks @micheleprandina
Credits:

PpSignal Ehlers Deviation Scaled Moving AverageThe DSMA by John Ehlers is an adaptive moving average that features rapid adaptation to volatility in price movement. It accomplishes this adaptation by modifying the alpha term of an EMA by the amplitude of an oscillator scaled in standard deviations from the mean
When the color Is blue buy.
Red sell.

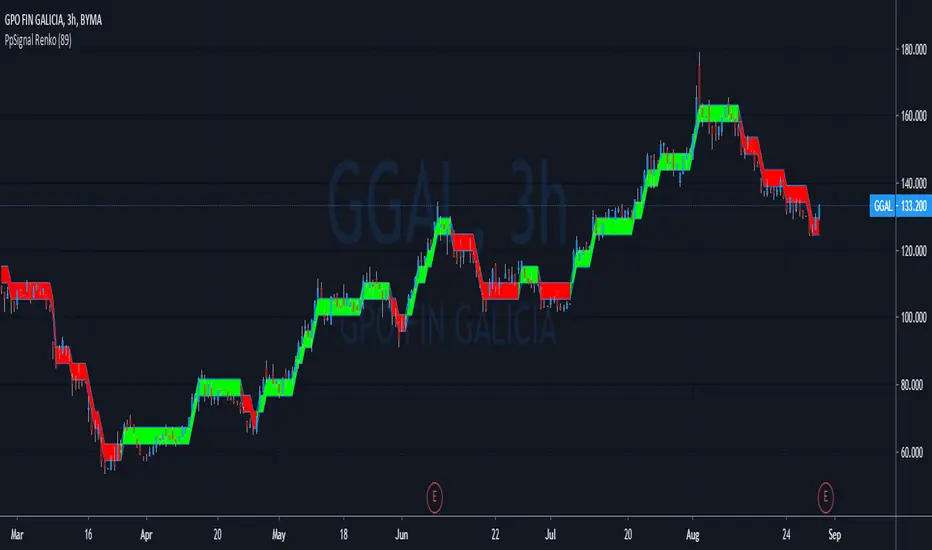
PpSignal RenkoA renko chart is a type of financial chart of Japanese origin used in technical analysis that measures and plots price changes. A renko chart consists of bricks, which proponents say more clearly show market trends and increase the signal-to-noise ratio compared to typical candlestick charts
PpSignal Renko emulator you can see the Renko chart and the candle in the same time.
Work with atr Average true range.
Buy when the Renko is lime end sell when the Renko is red.
Be careful the Renko chart changes color when the close Renko price is higher than the open Renko so it can repaint up to the close price of the current candle
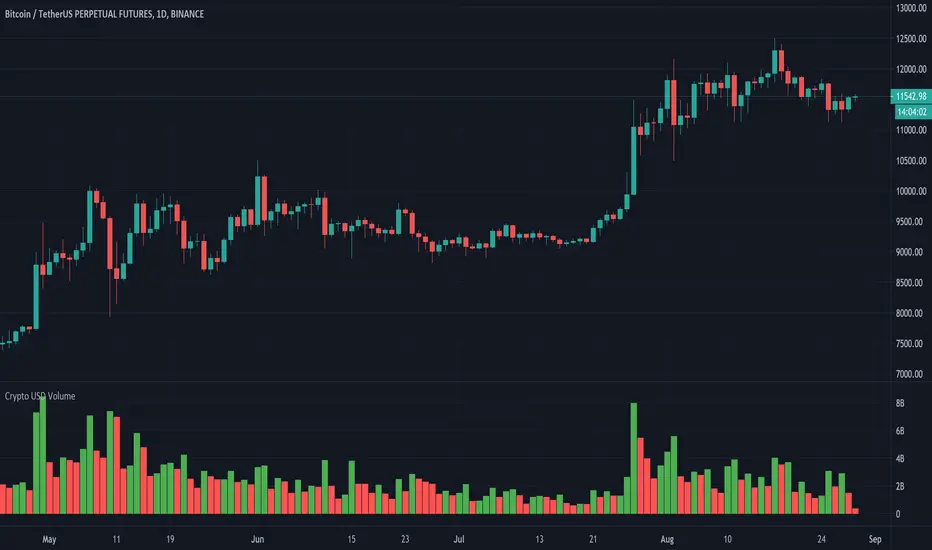
Crypto USD VolumeOften times I need to check the volume in cryptocurrency exchanges and I find myself checking which type of volume I am looking at, I need to manually make sense what the data is and converting it into USD volume which I end up going to CoinMarketCap website to verify whether my calculation is right.
Today I thought it was about time I created an automatic way to find the volume in USD Dollars. This is what this script does.
1 - It removes the base currency from the symbol (e.g., "BTCUSD", it would remove "BTC", leaving us with the "USD" part.). This is important because it helps us identify the currency the pair uses.
2 - It has different pair's variables, each is given a specific currency that the final volume is calculated from. (BTC, ETH, BNB and USD are the default currencies, for other ones, it must be added manually).
This works with all crypto symbols that include BTC, ETH, BNB and USD as currencies. If you modify it, please make sure to compare data with the exchange's one.
HFT Divergence Hunter BacktesterDefault Settings are meant to be used in BTC /USDT chart on 5 min time frame on Binance Futures . If you want to use for another asset on another time frame YOU MUST CHANGE THE SETTINGS
This is a divergence finding strategy developed by HFT Research. It is a highly customizable strategy and provides endless opportunities to find profitable trades in the market.
Default Settings are meant to be used in BTC /USDT chart on 5 min time frame on Binance Futures . If you want to use for another asset on another time frame YOU MUST CHANGE THE SETTINGS
This is a divergence finding indicator developed by HFT Research. It is a highly customizable indicator and provides endless opportunities to find profitable trades in the market.
Use Envelope , this is the main decision maker in this strategy. The idea behind is that you choose the length of the moving average and set an offset % to create an upper and lower band. If you click on “display envelope” you will be able to visually see the band you have created. This way, you get to scalp the market as the price is diverging and moving away from the moving average. As the famous saying goes, moving averages act like magnets and prices always visits them back. Using this ideology, we aim to capitilize on the price swings that move away from the chosen moving average by x%.
STARC Bands ;
These are two bands that are applied above and below a simple moving average of an asset’s price. The upper band is created by adding the value of the average true range (ATR) or a multiple of i. The lower band is created by subtracting the value of the ATR from the SMA . The channel can provide traders with ideas on when to buy or sell. During an overall uptrend, buying near the lower band and selling near the top band is favorable. However, from our testing results it does fairly poorly in crypto markets while it does pretty well in traditional markets.
Use RSI ;
One of the most commonly used indicators in the trading world. The idea is simple, buy when its oversold and sell when its overbought. You can use RSI as a secondary confirmation of the dips. It can be turned on and off.
Use MFI
MFI stands for Money Flow Index and it is an oscillator like RSI . However, it does track the price in a different fashion than RSI providing a reliable option. It uses the price and volume data for identifying overbought and oversold signals in an asset.
Use Fisher Transform
Even though, it has a funny name, Fisher is actually a very decent and reliable indicator. It converts the prices into a Gaussian normal distribution channel. Therefore, the indicator detects when the prices have moved to an extreme, based on recent price action.
Use VWAP
VWAP stands for volume weighted average price . It is an extremely useful indicator when trading intra-day. It does reset every trading session which is at 00:00 UTC . Instead of looking at x number of candles and providing an average price, it will take into consideration the volume that’s traded at a certain price and weigh it accordingly. It will NOT give entry signals but act as a filter. If the price is above VWAP will filter out the shorts and other way around for longs.
Use ADX
Average directional index is a powerful indicator when one is assessing the strength of a trend as well as measuring the volatility in the market. Unfortunately, the worst market condition for this strategy is sideways market. ADX becomes a useful tool since it can detect trend. If the volatility is low and there is no real price movement, ADX will pick that up and will not let you get in trades during a sideways market. It will allow you to enter trades only when the market is trending.
Use Super trend Filter
The indicator works well in a trending market but can give false signals when a market is trading in a range.
It uses the ATR ( average true range ) as part of its calculation which takes into account the volatility of the market. The ATR is adjusted using the multiplier setting which determines how sensitive the indicator is.
Use MA Filter
Lookback: It is an option to look back x number of candles to validate the price crossing. If the market is choppy and the price keeps crossing up and down the moving average you have chosen, it will generate a lot of “noisy” signals. This option allows you to confirm the cross by selecting how many candles the price needs to stay above or below the moving average. Setting it 0 will turn it off.
MA Filter Type: There is a selection of moving averages that is available on TradingView currently. You can choose from 14 different moving average types to detect the trend as accurate as possible.
Filter Length: You can select the length of your moving average. Most commonly used length being 50,100 and 200.
Filter Type: This is our propriety smoothing method in order to make the moving averages lag less and influence the way they are calculated slightly. Type 1 being the normal calculation and type 2 being the secret sauce .
Reverse MA Filter: This option allows you to use the moving average in reverse. For example, the strategy will go long when the price is above the moving average. However, if you use the reserve MA Filter, you will go short when the price is above the moving average. This method works best in sideways market where price usually retraces back to the moving average. So, in an anticipation of price reverting back to the moving average, it is a useful piece of option to use during sideway markets.
Use MACD Filter
MACD here will act as a filter rather than an entry signal generator. There are a few different ways to use this MACD filter. You can click on the Use MACD filter and it will use filter out the shorts generated in a bullish territory and longs generated in the bearish territory. It will greatly reduce the number of trades the strategy will trade because MACD is a lagging indicator. By the time MACD turns bullish or bearish , most of the other indicators will have already generated the signals. Therefore, resulting in less trades. You can use MACD filter as MA oscillator meaning that it will only look at the MA lines in MACD to filter out trades. Alternatively, you can use it with the histogram (Signal lines) meaning that it will only look at the histogram whether its below or above the zero line in order to filter out the trades.
TP (%)
Place your desired take profit percentage here. Default is 1.5%
Move SL At Entry x% Profit
This is when the strategy will move your SL to the entry point if the position reaches x% profit. It can also generate a signal which can be automated to adjust the SL on the exchange.
SL (%)
Place your desired stop loss percentage here. Default is 1%
The backtester assumes the following;
- 1000$ capital
- 0.06% commission based on binance
- 1% risk meaning 100% equity on cross leverage
- Backtest results are starting from 2020
If you want to get access to this indicator please DM me or visit our website.

PpSignal Regression Weierstrass functiongHi, this is an indicator based on the slope calculation of the resultant of this moving average slope, the Weierstrass approximation theorem emerges that gives us information about where the price can go, this is only a probability of occurrence depends on the formation of the slope.
Buy when the color turns blue and aqua and sell when the moving average changes to red color ... it also has alarms

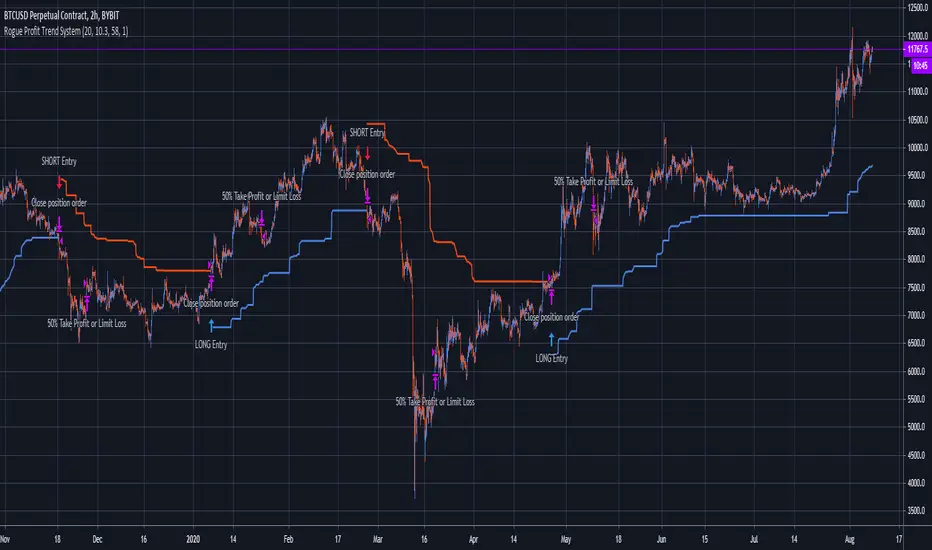
Rogue Profit Trend SystemThis system can be used for all assets. This script identifies trends and when to enter and exit. There is also built in risk management in the form of a take profit target or a reduction of risk to limit a losing trade. Inputs are variable and can be changed to better suit the asset and time frame you are trading. Since the risk management (take profit or limit loss) is calculated by 50% of your position, this system is designed to trade in multiples of two's. For example, you enter into a position with $100 at risk, when your risk management signal fires, it will reduce your position by 50% to either snag some profit or limit a loser leaving you with $50 in the position. Close the trade completely when the trend reverses for either a profit or loss.
Nothing about trading is easy. You will have losing trades. Managing your risk is the key to success which is why this system is so powerful. Markets are fluid and random so you will have to put some time and effort into adjusting the system inputs for each asset and the respective time frame you are trading and continue to adjust as time passes. This system will make you money if you manage it correctly and systematically.
Message me for two day trial access. Happy trading!
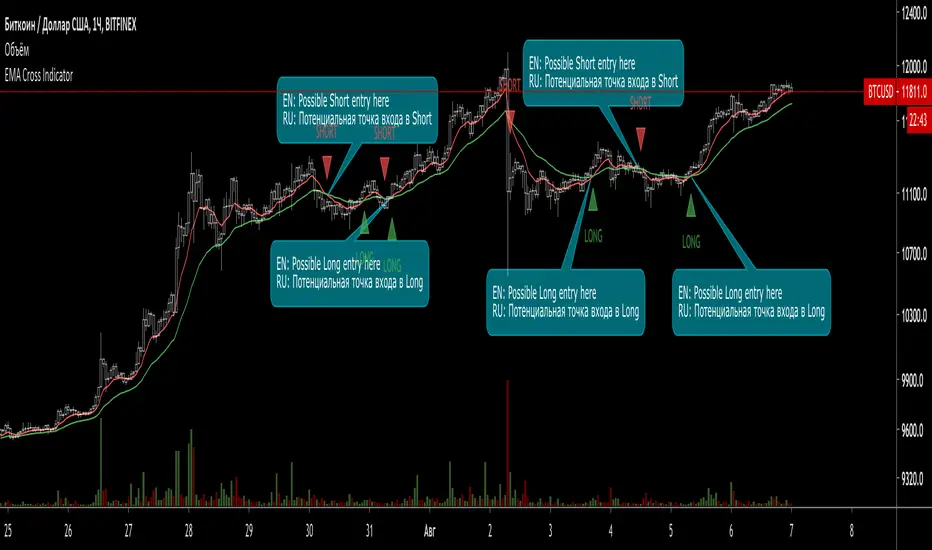
EMA Cross Indicator (with signals)This indicator shows 2 EMA (Long and Short) Cross and gives a possible entry point for a trade.
When Short EMA (red line) line crosses Long EMA (green) from bottom to top - this is a possible Long trade entry point.
When Long EMA (green line) line crosses Short EMA (red) from bottom to top - this is a possible Short trade entry point.
In both cases (basically, all the crossovers) are indicated with "Long" and "Short" labels.
Works with Crypto (from 30 min timeframe and higher)
Stocks (from 1 hour timeframe and higher)
Commodities (from 1 hour timeframe and higher)
Forex (from 1 hour timeframe and higher)
Consider using it with respect to Your trading style, money- and risk-management as well as other indicators.
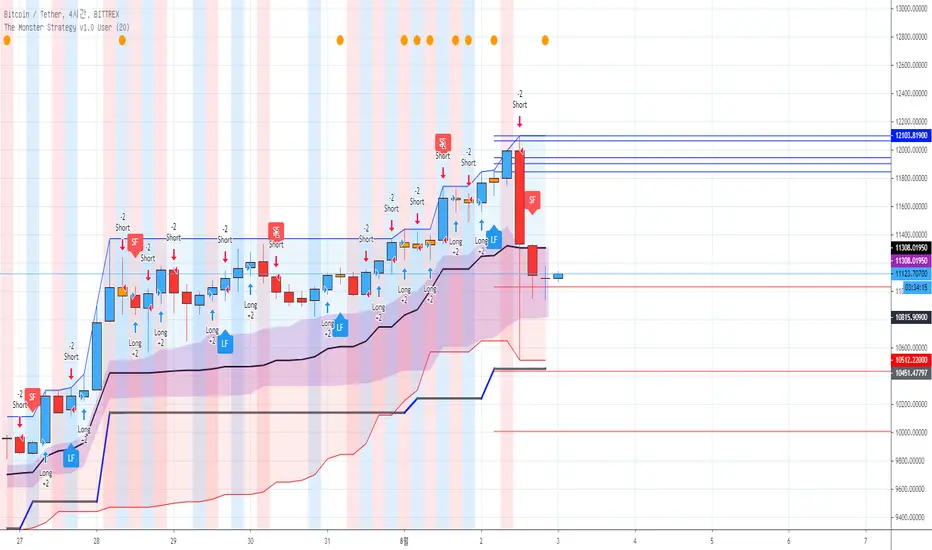
[AngelHouse] The Monster StrategyHello, I'm Angelhouse, a crypto analyst and indicator developer. :)
I would like to introduce you to the newly developed "The Monster" strategic indicators.
The indicator is an upgraded version of the existing "All Eating" strategy indicator.
- The "Monster" indicator is a strategic indicator created for crypto market transactions.
- This indicator is based on a four-hour time zone and is a strategic indicator using the intersection of the threshold.
- If a plot is crossed, a call is in progress or crossed, a sales signal is generated.
※ Explanation of the "The Monster" Strategy Indicator v1.0
1. Long & Short: You can configure your swing strategy based on the signal.
The All Eating Strategy indicator is based on a four-hour frame. Due to the logic nature, the signal does not match at a time higher than 4 hours. Therefore, we recommend that you use the indicator only in a time zone of 4 hours or less.
Also, the signal does not have 100% accuracy, so even if you configure a strategy based on the signal, it is recommended that you set the break/break line and respond.
2. Long Feel & Short Feel: The signal is also quite reliable. The strength of the signal is very reliable when a strong rise and a strong fall occur.
However, the downside is that there may be some offbeat in the transverse section. However, even if the index is offbeat, the loss is small, and if the stock price rises or falls, high expected returns can be expected.
You can use the signal alone, but if you use the Long & Short indicator, you can get better results. If the Long Feel & Short Feel signal is also generated where the Long & Short signal is generated, the probability will be higher, right?
3. Candle color: White cans are formed when cans such as dojorpoenor hammer are generated. The cans have a meaning of reversal when they occur after a strong rise or fall, and can continue the trend when they occur during an ongoing trend.
4. Single item band: The single item band consists of the strong area (blue area) and the weak area (red area) based on the reference line. Stock prices can indicate additional gains when they are in the bullish zone, and additional declines when they are in the weak zone.
Also, you can recognize the top of the strong zone as the resistance line and the bottom of the weak zone as the support line.
The cloud stand in the single band should be located in front of the band for 26 days, but it is also recognized as a role of support and resistance.
5. 1D Baseline: The line of one bar is recalled to 4 hours. blue when the reference line is positive, red when negative, and gray when horizontal, and red when the reference line is positive,
Or, in the opposite case, it's time to suspect a trend inflection.
6. Target line : When a specific period is set (default 20 days setting), the target point is provided in each of the 5 lines, from the highest point in the period to the low point of the current bar, and from the lowest point to the high point of the current bar.
※ If you want to obtain access to this indicator with a script dedicated for the first time, please contact the link shown in the signature.
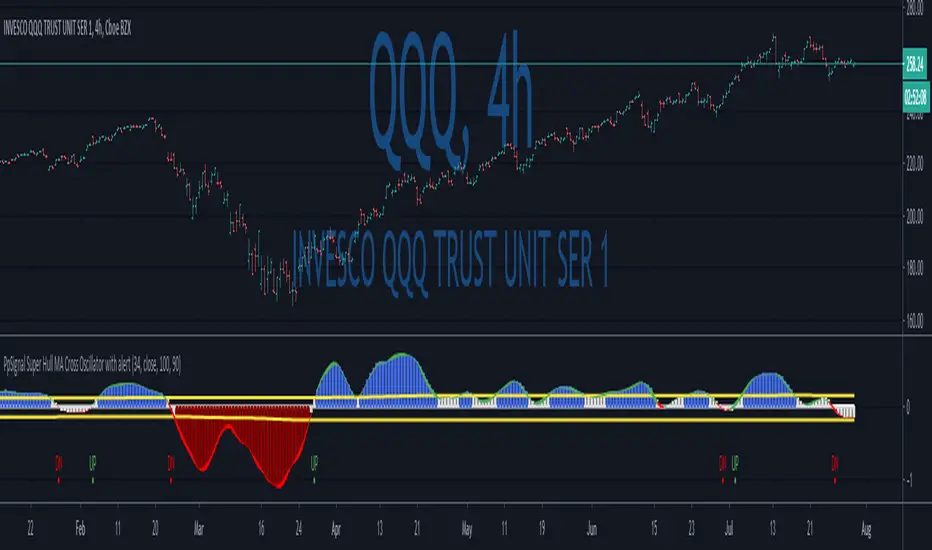
PpSignal Super Hull MA Cross Oscillator with alertWe have a Super Hull Move average oscillator style.
Super Hull, it is a hull move average open-close, smooth with elder method.
So, when you have a green color (hull cross up 0 Line), you have a buy signal.
When you have q red color (hull cross down 0 Line) sell signal.
Enjoy it...
Musashi MTF Trend HeatMapThis indicator compliments the Musashi TrendBars and allows convenient multi time frame analysis.
This HeatMap, shows 5 different time zones, each with color codes to indicate the trend expression of a corresponding timeframe.
- Dark Green = Good Uptrend (ok to enter short)
- Light Green = Uptrend but it can be exhausted (put in protective stops)
- Cyan = In Bull Trend but pulling back (be careful, maybe put in protective stops)
- Dark Red = Good Downtrend (ok to enter short)
- Orange = Downtrend but it can be exhausted (put in protective stops)
- Magenta = In Bear Trend but pulling back (be careful, maybe put in protective stops)
The dark grey markers on the Heat Map show when markets are not having strong trends.
*If you wish to license this indicator, please contact me via private message for details regarding access. Thank you.
LEGAL STUFF:
Risk Disclosure
Futures , forex, stock, crypto and derivative trading contains substantial risk and is not for every investor. An investor could potentially lose all or more than the initial investment. Risk capital is money that can be lost without jeopardizing ones’ financial security or life style. Only risk capital should be used for trading and only those with sufficient risk capital should consider trading. Past performance is not necessarily indicative of future results
Hypothetical Performance Disclosure
Hypothetical performance results have many inherent limitations, some of which are described below. no representation is being made that any account will or is likely to achieve profits or losses similar to those shown; in fact, there are frequently sharp differences between hypothetical performance results and the actual results subsequently achieved by any particular trading program. One of the limitations of hypothetical performance results is that they are generally prepared with the benefit of hindsight. In addition, hypothetical trading does not involve financial risk, and no hypothetical trading record can completely account for the impact of financial risk of actual trading. for example, the ability to withstand losses or to adhere to a particular trading program in spite of trading losses are material points which can also adversely affect actual trading results. There are numerous other factors related to the markets in general or to the implementation of any specific trading program which cannot be fully accounted for in the preparation of hypothetical performance results and all which can adversely affect trading results

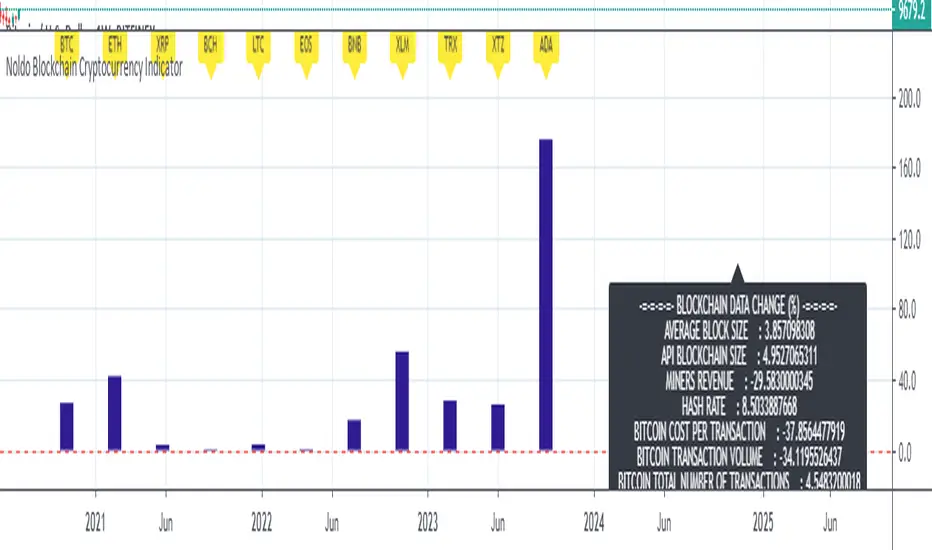
Noldo Blockchain Cryptocurrency Indicator
Hello, this script has the same logic as Noldo CFTC COT Forex Indicator :
And Noldo CFTC COT Commodities Indicator :
*
Script briefly calculates the period length between two signals of Pivot Reversal Strategy when new signal arrives and allows us to see relative Blockchain data and price changes of Major Cryptocurrencies over that automatic length.
This saves us from the hassle and time wasting of searching for a reference point.
Usage
This script works only on all Bitcoin / U.S Dollar pairs and futures.
It only works on 1W graphics.
ICOT data are pulled via Quandl
NOTE :
Since blockchain data is very votalile, 7-day ema values are adjusted to take into account.
Regards.
AMA 2Hi
Here is the 2ed edition of the AMA indicator.
what you would know to know?
AMA indicator based on support and resistance in a different way.
Basically, you have the X line (black color) and when you see candles is over it, then you can go long, and when it's below it you may go short or just close your deal and wait for a better chance to re-enter again.
You see the confirmation signs which helps you to get more signals for the deal.
You find a colored background that is based on the volume that could help you to know where if the traders are buying or selling.
AMA is configured to work with Alerts.
We've added EMA and our special moving average to help you in your decision.
Finally, the indicator is tested and works fine with Binance on 1H, 4H, D and you could change the length to have better results for the daily time frame.

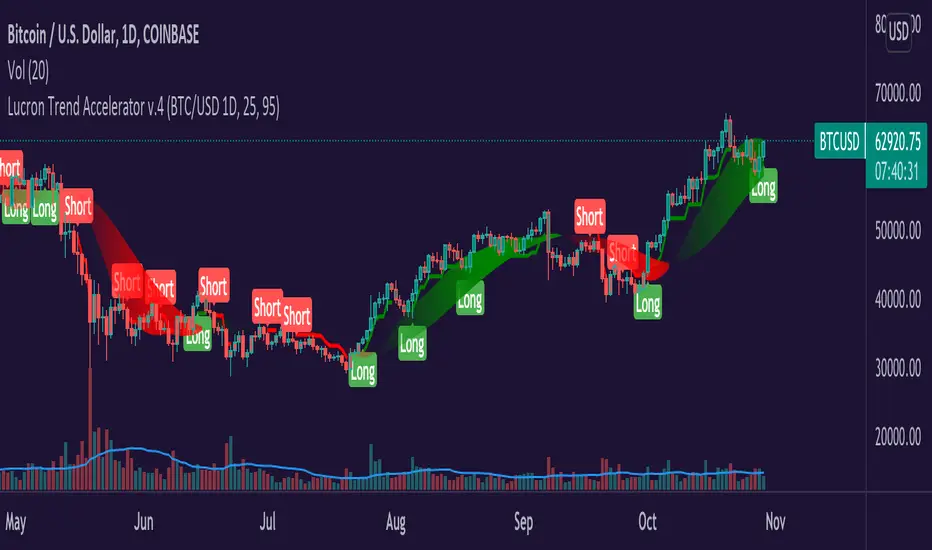
Lucron Trend Accelerator v.4Hey Everyone,
The Lucron Trend Accelerator v.4 is finally available. This indicator is market-specific, which means that it's proprietary code has been tested with best results in the following markets:
BTCUSD - DAILY TIMEFRAME
EURUSD - 1 HOUR TIMEFRAME
This can be applied to any market and any timeframe, but for best results, it's recommended to be used in the above markets. In the future, we are planning to add additional markets.
How it works:
Entry:
The indicator's code identifies emerging bullish and bearish trends. It then displays a "Long" OR "Short" signal on the chart - This marks an entry opportunity.
Position Management:
As the trend continues and your profit increases you will see a ribbon that affirms the direction of the trend. Green for long, and red for short.
Take Profit/ Exit:
Once you have completed the steps above just keep an eye out for a new signal. This signal will inform you of a shifting trend. It will display in the following ways:
A new "Long" Or "Short" signal displayed on your chart
A change in the color of the trend ribbon (from green to red)
If you have implemented a trailing stop, you'll be covered and should capture your profits or limit your risk before the next signal.
If you see any of these signals make sure to take action in order to protect your profits.
You can:
1. Exit the current trade & enter a new trade
2. Take profit on half the position & roll your stop to break even
Takeaways:
As you can now see, our proprietary Lucron Trend Accelerator Trading Tool allows for emotion free trading. It gently guides you by the hand, and shows you how to trade with a proven, calculated, and consistent strategy.
*Disclamer
Any information communicated by Lucron is solely for educational purposes. This is indicator is meant to be used with appropriate risk management and market analysis.
It is not intended to be and should not be interpreted as investment advice or a general recommendation on investment.
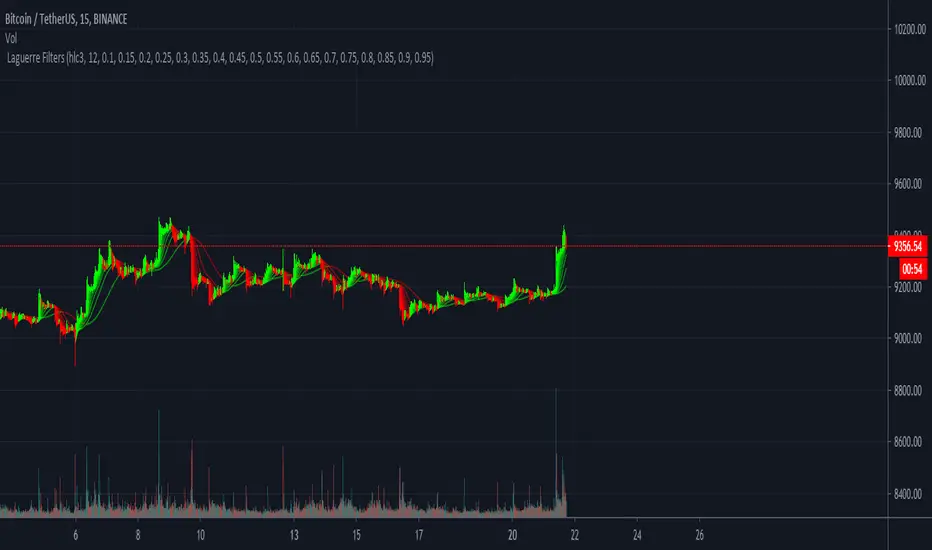
Laguerre Filters Crypto Scalping Tool This is an indicator designed to follow trends on the 15m/30m/1h Timeframe. It works best if you can recognise a larger trend into a direction and combining it then with for example longing the dip. Escpecially for crypto assets this can be used for scalping and if paired with S&R can be an especially powerful tool if paired correctly. Like it is shown here.
As soon as there is a flip to green for example with upwards momentum over the last period of time and no higher Timeframe Resistance ahead. On lower timeframes like the 15m and 30m this can be used for scalping and works especially well in Ranges, say for example a 100 Tick range. At the time of writing we heavily used this Indicator for scalping up and down the current bitcoin range and it worked suprisingly well.
One user was able to trade the EOSUSDT pump, chart shown here.
The cool thing is that the single filters can also be used as a Trailing Stop.
If interested please direct message us. Thank you !
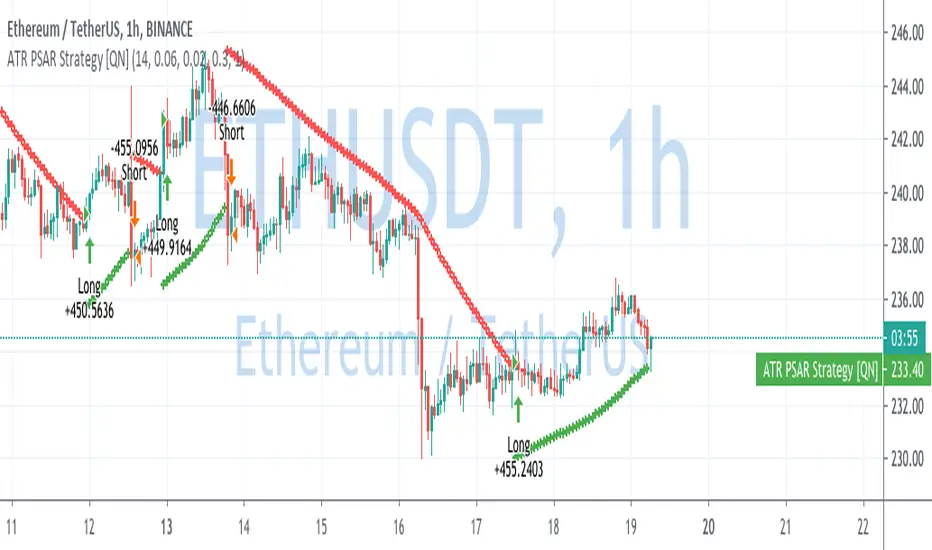
ATR Parabolic SAR Strategy [QuantNomad]I created a version of Parabolic SAR when I accelerate it not based on the difference from the extreme point but based on current ATR. So the idea is that for a more volatile market it should move faster.
Performance is calculated based on 25% equity invested and 0.1% commission.
What do you think about it? Does it make sense to do something like that?
Do you have in mind other ways I can accelerate it when the market starts to be more volatile?
Disclaimer
Please remember that past performance may not be indicative of future results.
Due to various factors, including changing market conditions, the strategy may no longer perform as good as in historical backtesting.
This post and the script don’t provide any financial advice.
Aditya Signal-1.1 for Nifty and Bank NiftyThis is non-repainting indicator which can be used for Index, Stocks, Commodities and Bitcoin or any other securities depending upon the various parameter setting of the indicator. This particular strategy is for Nifty-50 Index which is traded on NSE(India).
The detailed description about the indicator is as follows:
Long Period: Period for calculating Primary Signal Line (Yellow).
Long Period Input Source: Input for calculating Primary Signal Line.
Short Period: Period for smoothing the Primary Signal Line.
Short Period MA: Method for smoothing the Primary Signal Line.
No. of ATR Bars: No. of ATR bars for calculating Primary Signal Line.
ATR Multiplier: ATR multiplier for ATR calculation.
Trade Trigger: Value above or below of Primary Signal Line for Long or Short signal. The dotted lines in Green and Red color represents the same.
Bar Crossover Input Source: Current bar input for additional signal confirmation above Primary Signal Line.
Bars Above Signal High: No. of bars closing above Secondary Signal Line (Blue)
Bars Below Signal Low: No. of bars closing above Secondary Signal Line (Purple)
No. of bars crossover method uses certain no. of bars for closing above High or Low of the crossover of closing price and the Primary Signal Line in combination with Trade Trigger. The idea behind this design is to avoid fake signal due sudden spike in price. Also, this ensures that price consolidates above High in case of Long signal confirmation and vice-versa. By increasing no. of such bars, we can anticipate, how much time it takes for short-term and long-term trend reversal.
Depending upon the time-frame, just by observing the High and Low of previous crossover of closing price and Primary Signal Line, we will have better understanding of undercurrent of market.
By using different combination of Trade Tigger value and no. of bars above and below, we can anticipate better trend confirmation.
The various combinations of price source of Long Period Input Source and Bar Crossover Input Source, the Short Period MA method shows promising results. Kindly PM me for these optimum settings for other financial instruments.
It always better to book partial profit after getting into the trade which increases the odds. The default trade quantity is 2. We book 1 quantity after our partial profit target is reached and let the remaining quantity be in the trade until the reversal of trend. By enabling or disabling the same we can determine the profit or loss from historical trade from when the trade quantity is 1. Just remember to change the default quantity to 1 in Order Size from properties when you disable the Take Partial Profit option.
Take Partial Profit: Whether to book partial or not as explained above.
Partial Profit Points: It always better to book partial profit after trend getting into the trade. The default trade quantity is 2. We book 1 quantity after our partial profit target is hit and let the remaining quantity in the trade until the reversal of trend.
Instrument Type: We can select the which instrument for analysis. By adjusting the Take Partial Profit value by selecting Other Option, you can analyze instrument of your choice other than mentioned in the list for Partial Profit depending upon stock tick value and lot quantity or you can PM me. I have adjusted value for Crude Oil and Silver for MCX(India) future contract values.
This is a premium indicator so send me a private message for 15 days free trial.
"Use the link below to obtain access to this indicator."
Disclaimer: This script/strategy is for educational purpose and individual use only. The author of this script/strategy will not accept any liability for loss or damage as a result of reliance on the information contained in the charts. Please be fully informed regarding the risks and costs associated with trading the financial markets.

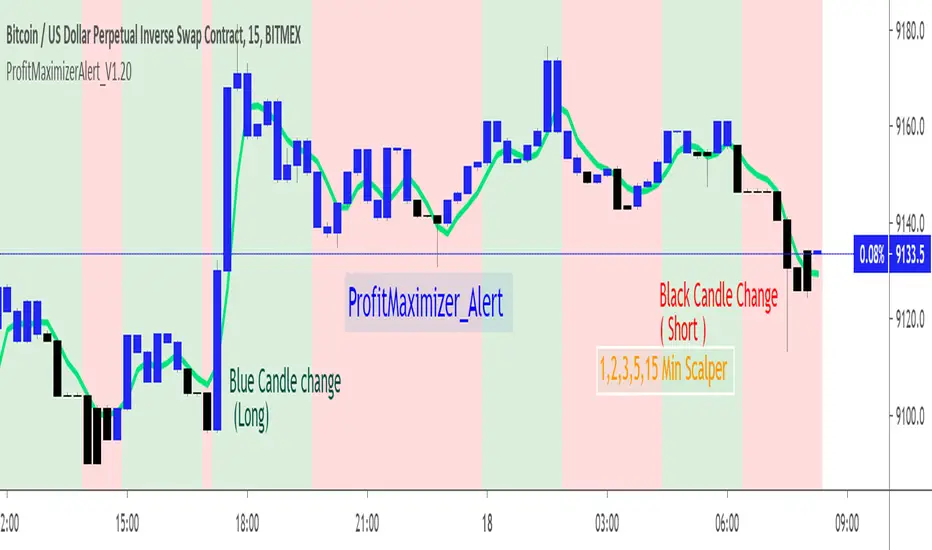
PM_Scalper_AlertsFriends,
Welcome to ProfitMaximizer(PM) Scalper Alert Indicator. This is same Indicator as that published by me on Dec 26, 2018 .
Since the old script was published using "heikin ashi" ,As per recent house rules it was moderated and hidden by Admin.
Based on the discussion with Admin and direction given by them republishing as it is with no change in the code but the chart is now with Real CANDLEs .
This indicator basically uses multiple time-frame and checks the price variation to determine the long and short candles.
On accumulation on good up moving candles the plot is done as Blue color that shows sign for LONG .
On accumulation on good down moving candles the plot is done as Black color that shows sign for SHORT .
Long : Change of Candle from Black to Blue Candle (U can customize color in Styles settings of this indicator)
Short : Change of Candle from Blue to Black Candle.
Alerts : Alerts are inbuilt in this indicator that can be used to get Alerts when the direction of the Candle(Blue to Black,Black to Blue) is getting changed . Financial Market is always risky.Any trade you make based on this indicator and its result is your responsibility.As an author i will be held no responsibility of your trade gain or loss.Be Cautious.
Note : This is scalper indicator and only works only in
1min ,2min, 5min, 15min .
In Higher timeframe the chart wont paint the colors.
Use the JETLINE to detect good entries ,Price above the JET line good for Long,Price Below the JET line good for short.
The Strategy version of this indicator published on 3-Sep-2018 is here for your study and reference.
Find the indicator useful,Share your feedback in comments and appreciate if this is useful.
Note : This chart can be applied for any TV supported charts.Examples Below.Thank you!
ETH Chart : 5min
EURUSD Chart :5min
SPX500 Chart :5min
iqlegendThe iqlegend indicator integrates stocastic information and places overbought and oversold entry points. Trade accordingly when Buy and Sell signals coincide with RED points to sell and Green points to buy.
The best points to enter Sell are above the dashed -30 line and to enter Buy are below the dashed -30 line.
Confirm with the intersection of the stocastics.
When you make your trade, don't forget the correct administration of your capital, use risk units, 6UDR is my recommendation.
I hope this indicator provides you with the business information you need.
PM us to obtein acces.
Kind regards and successes!
********************************************************************
El indicador iqlegend integra información estocastica y ubica puntos de entrada en sobrecompra y sobreventa, Opere en consecuencia cuando coincidan las señales de Buy y Sell con los puntos Rjo para vender y los puntos Verde para comprar.
Los mejores puntos para entrar en Sell están por encima de la linea punteada -30 y para entrar en Buy están por debajo de la linea punteada -30.
Confirme con la intersección de los estocásticos.
Cuando realice su comercio , no olvide la correcta administración de su capital, use unidades de riesgo , 6UDR es mi recomendación.
Espero que este indicador le proporcione la información comercial que usted necesita.
Envíeme un mensaje privado para obtener acceso.
Un cordial saludo y éxitos!

iqlegendThe iqlegend indicator integrates stocastic information and places overbought and oversold entry points. Trade accordingly when Buy and Sell signals coincide with RED points to sell and Green points to buy.
The best points to enter Sell are above the dashed -30 line and to enter Buy are below the dashed -30 line.
Confirm with the intersection of the stocastics.
When you make your trade, do not forget the correct administration of your capital, use risk units, 6UDR is my recommendation.
I hope this indicator provides you with the business information you need.
PM us to obtein acces.
Kind regards and successes!
**********************************************************************
El indicador iqlegend integra información stocastic y ubica puntos de entrada en sobrecompra y sobreventa, Opere en consecuencia cuando coincidan las señales de Buy y Sell con los puntos RED para vender y los puntos Green para comprar.
Los mejores puntos para entrar en Sell estan por encima de la linea punteada -30 y para entrar en Buy estan por debajo de la linea punteada -30.
Confirme con la intersecion de los stocastics.
Cuando realice su comercio , no olvide la correcta administración de su capital, use unidades de riesgo , 6UDR es mi recomendación.
Espero que este indicador le proporcione la información comercial que usted necesita.
Envíeme mensaje privado para obtener acceso.
Un cordial saludo y éxitos!
