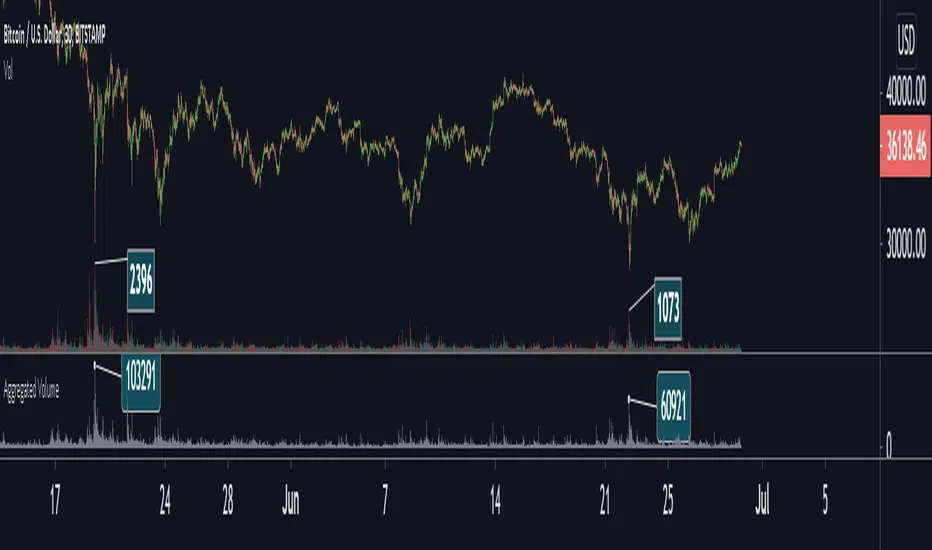
Aggregated VolumeBITSTAMP:BTCUSD
This indicator aggregates trading volume data of assets which are traded on multiple exchanges (like cryptocurrencies, commodities, forex and derivatives) to give you better insights on the markets.
You can change the markets from which the indicator gathers data in the settings under inputs.
By default, data is aggregated from the following markets:
Binance, BTC /USDT
Binance, BTC /BUSD
Bitfinex, BTC /USD
Coinbase, BTC /USD
Bingbon, BTC /USD
Bitstamp , BTC /USD
Kraken, XBT/USD
Gemini, BTC /USD
OkeX, BTC /USDT
Huobi, BTC /USDT
加密货币
InvictusHello,
I introduce my strategy that provide signals for entering in the market and signal for exit.
This indicator attempts to show a trader when is the best time to open a long or short position. The calculations are partially based on volatility, SMA, EMA and predefined values depending on used timeframe.
We collect data from comparing the current price, calculating the average move of the market, top, bottom and close of the latest bars. The middle line is an adaptive moving average, which is the base of the signals and we also use it as a Trend Line to determine if we are in long or short "condition". The basic idea of this indicator is to show the best place to open a Long or Short position and when to close it.
It is very simple - there are 2 type of signals - LONG (in green) and SHORT (in red). You can close your position when a TP (Take profit) shows up or based on your calculations.
You can chose from several options which strategy you want (there is a "Strategy" select in the settings). The strategies that are proving better according to our tests are marked with a diamond.
Don't forget to always trade with caution, trading is dangerous don't trade more than you can afford to lose.
Please contact me via personal message if you want to test the strategy or for more information.
Thank you.

Cryptocurrency Super-Cycle IndicatorThe Cryptocurrency Super-Cycle Indicator employs a custom volume-weighted algorithm to confirm the overall, long-term trend. This works well on the 4H timeframe, but can be used on any timeframe. The indicator also plots a modified Network Value to Transactions (NVT) Ratio to identify overbought and oversold areas where price could soon reverse.

Average EnvelopeA script to calculate a support / resistance level which acts as either a bounce level or a flip level. This is rather a macro play guide than a day trade tool.
The average is calculated by taking into account monthly/weekly/daily highs and average them out.
The script also paints fib levels based on the values of the upper and the lower band.
While this was designed with a cryptocurrency market in mind (no 'close' values per-se) it holds with traditional markets as well.

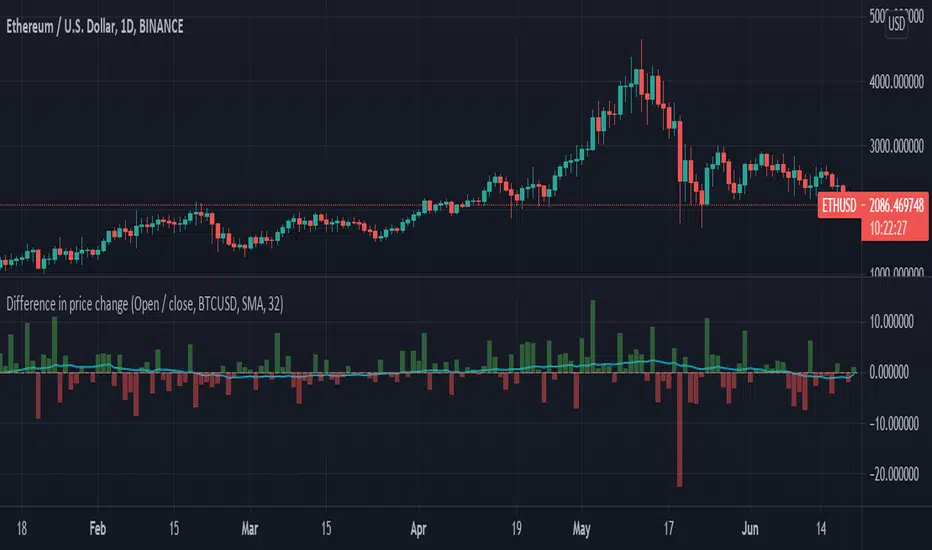
Difference in price changeCompares price change between current symbol and other one (eg. BTC vs S&P500). It calculates price change on each bar (from high to low or from open to close) and compares with price change of equivalent bar from the other source.
Example
Current symbol
open = 10 USD
close = 7 USD
change = -3 USD
% change = -30%
Second symbol
open = 3 USD
close = 4 USD
change = +1 USD
% change = +33%
Performance of price change = (-30) - (+30) = -63 // It means that current source has weaker performance right now

[francrypto® strategy] 4 EMAs, P.SAR & Vol.Prof. (by kv4coins)(ENG)
This script consists of my own strategy for cryptocurrency (but can be adapted very well for stocks, forex, etc.)
Is a combination of:
- Four Exponentials Moving Average (EMA), configurables: by defect are 10, 21, 55 and 200 periods in yellow, aqua, orange and blue each of them
- Parabolic SAR System (PSAR), configurable
- Volume Profile (that has been developed by kv4coins - he has already authorized me to use it under the same OSS Licence Terms: MPL 2.0), configurable: with another default values and bilingual support for Spanish (SPA)
How it works
1) It is always better to detect specifics candlesticks or patrons: doji , pinbar or inverted pinbar , engulfing bars , morning star or evening star , harami , twizzer bottom or top , etc.
2) The 10 and 21 periods EMA help to identify the short-term behavior
3) The 55 periods EMA can be used like a support or resistance in medium-term, as 200 periods EMA in very long-term
4) It will convenient search for a double cross (10 & 21) or a triple cross (10, 21 & 55) to determine the medium-term change Downtrend to UpTrend (or viceversa)
5) Confirm the change patron with the Parabolic SAR and then identify potencials purchases or sales
6) Use Volume profile to detect potential supports or resistances areas, in order to set stop limit/loss and take profit orders.
Hope this helps!
Cheers,
FRANCRYPTO®
–––––– 0 ––––––
(ESP)
Este script consiste en mi propia estrategia para criptomonedas (pero puede adaptarse muy bien para acciones, forex, etc.)
Es la combinación de:
1) Cuatro Medias Móviles Exponenciales (EMA), configurables: por defecto son de 10, 21, 55 y 200 períodos en amarillo, turquesa, naranja y azul cada una de ellas
2) Sistema Parabolic SAR (PSAR), configurable
3) Perfil de Volumen (que fuera desarrollado por kv4coins - que ya me ha autorizado a su uso bajo las mismas condiciones de la Licencia OSS: MPL 2.0), configurable: con otros valores por defecto y soporte bilingüe para Español (SPA)
Cómo funciona
1) Siempre va a resultar mejor detectar velas japonesas específicas o patrones: doji , martillos o martillos invertidos , velas envolventes , patrón amanecer o atardecer , harami , velas gemelas , etcétera
2) La EMA de 10 y 21 períodos ayudan a identificar el comportamiento de corto plazo
3) La EMA de 55 períodos puede ser usada como un soporte o resistencia de mediano plazo, como así también, la EMA de 200 períodos en el muy largo plazo
4) Será conveniente buscar un doble cruce (10 & 21) o un triple cruce (10, 21 & 55) para determinar un cambio de la tendencia de mediano plazo de bajista hacia alcista (o viceversa)
5) Confirmá el patrón de cambio con la Parabólica de SAR y entonces identificá potenciales compras o ventas
6) Usá el perfil de volumen para detectar las potenciales zonas de soporte o resistencia, principalmente para establecer ordenes stop limit/loss o take profit.
¡Espero que pueda serles de utilidad!
Saludos,
FRANCRYPTO®

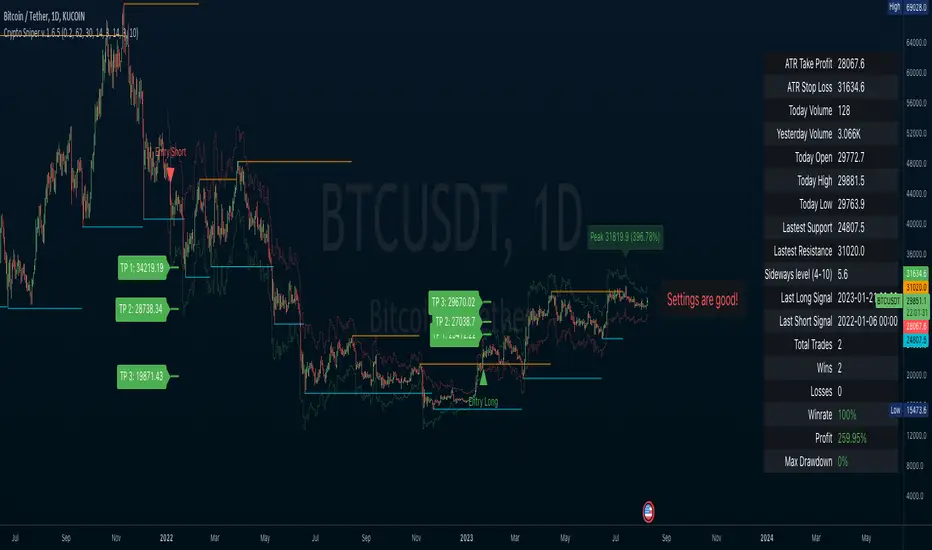
Crypto SniperAn easy to follow indicator for scalping or long term trades. You can add this indicator to other analysis as a complementary indicator or use it alone for entry and exit your trades.
Features
• Simple entry signals, buy the contract at the end of the signal candle
• Additional entry signals can be enabled to increase your position and your profits
• Get exit signals for your opened trades.
• Alert conditions for all entries, additional entries and exits
• Enable ATR plot of Take Profit and Stop Loss
• Customize your ATR settings to adapt the indicator to any market
This indicator use some analysis to get the bottom/top of the cycles. Any market or timeframe and can be used. Specially designed for scalping on cryptocurrency futures markets.
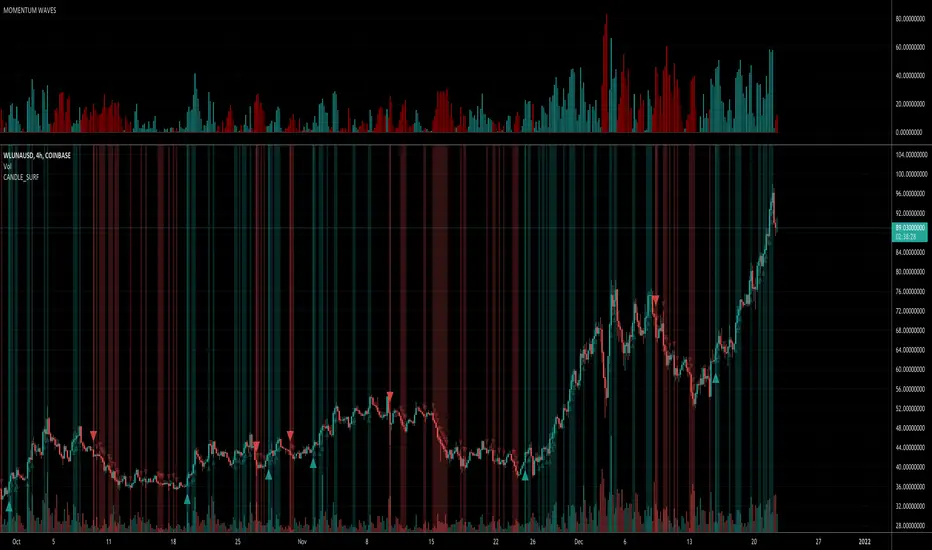
Candle Surf SignalThis script works very well for all assets across various timeframe charts. Good for use with scalping, long term swings, or in combination with multi-timeframe trading.
Surf the candles!
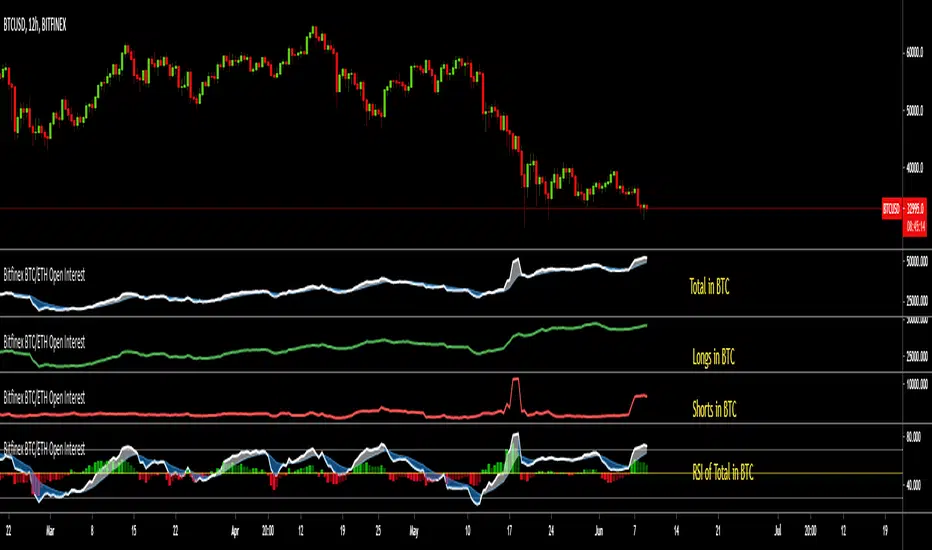
Bitfinex BTC/ETH Open InterestThe Bitfinex Exchange is providing the Open Long and Short positions as data feeds in Tradingview. This information can be valuable in order to judge how the big players are positioned.
This indicator allows to analyze this Bitfinex Open Interest data for BTC and ETH. By default it shows the Total Open Interest (Longs + Shorts) in BTC. A 10 period EMA is applied to the data.
The following alternative displays are available:
- Show ETH instead of BTC
- Show Long positions separately
- Show Short Positions separately
- Show the results in USD (Number of coins multiplied by period closing price)
- Show RSI instead of absolute value (see below)
Instead of displaying the absolute value, it is possible to show the RSI (current default length is 20) to make the changes easier visible. If RSI display is selected, then the Overbought, Oversold and Middle Line are shown automatically. Additionally a histogram is displayed which shows the difference between the RSI and the EMA of the RSI.
Crypto RSI Oscillator [marksc]This is my main indicator of pricing trend reversals.
It consists of two main indicators:
1. The green/red oscillator shows a general rising (green) or falling (red) price trend over a smoothed average of a number of periods (length).
2. The yellow "OverUnder Line" shows the Relative Strength Index adjusted price trend in real time.
How to use it:
- You will need to adjust the Overbought and Underbought (green and red) horizontal lines such that the yellow line rarely peaks past them. This will depend on historical data and the time-scale you're using. So if you configure it on a 15minute timescale and then switch to hourly the lines will need-readjusted. This is because the yellow line's movement is "Relative" to a number of periods of time in the timescale.
Predicting Pricing Reversals:
Adjust the Overbought and Underbought lines such that, in the past, the yellow line has rarely peaked over or under them.
When the yellow line peaks over or under one of the Over/Underbought lines again the price will likely make a strong reversal.
(Conversely, if the yellow line is not peaking but staying mostly flat or only slightly angled then the pricing trend is likely to continue.)
Predicting "Pump and Dumps":
If the price makes a sharp reversal while the yellow line was far from the over/underbought lines (ie. the yellow line was near the center), this indicates that a larger purchase or sale than has happened in a long time just happened. In most cases the price will quickly correct back to where it was because this sharp price reversal was was abnormal over the length*period used in the RSI calculation.

Liquidation Levels
I got sick of calculating leverage all of the time, so I made this real time calculator. It is primarily for crypto derivatives.
It tracks and displays the liquidation price for 5 customisable leverage levels and plots them either historically and/or in real time, with labels beside each including the estimated price.
These calculations include maintenance margin and can be configured for linear futures (USDT) or non-linear futures. Never again make dumb mistakes that are obvious with a bit of maths.
To jazz it up, you can customise the colours, disable various labels, set different leverage multiples, and change the offsets and number of bars to plot in the past.
Alternatively, you can change the offset to 24 on an hourly chart and change show last bars to 0. By doing this, you can see which levels most often get liquidated. It is crude, I know, and there are better tools for tracking liquidation hunts. This is not an attempt to replace or compete with them.
Enjoy and trade safely.

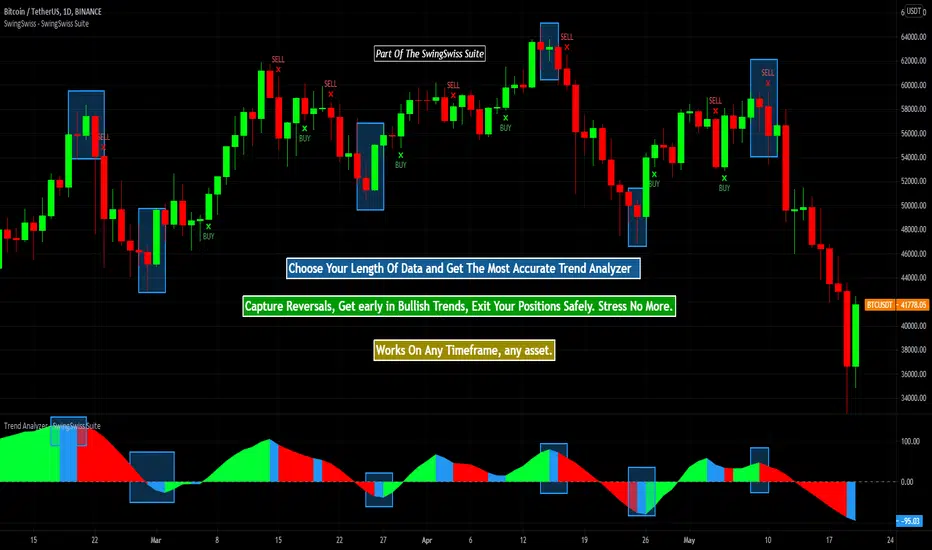
Trend Analyzer - SwingSwiss SuiteTrend Analyzer aims to define and analyze the trend of a particular asset at a given time using MACD, mathematical functions, and moving average.
It comes in very handy when determining an overall strategy or when you need to decide on whether a trade makes sense or not.
Finally, you can build a complete strategy around the indicator.
QUICK OVERVIEW
When the histogram is green, it means that the asset is currently bullish. Blue shows a possible reversal while red is synonymous with a bearish trend.
In the configuration panel, you can change the length of the data analysis.
The lower the number, the more recent the data captured is. Therefore, it's more predictive.
USE CASES
- You want to make a long trade on a 30mn chart but the indicator is red on the 30mn chart but also in the lower charts showing that the trend is not likely to reverse... You should think twice about that trade.
- You want to short the market on a 2h chart but on the lower charts, the green indicator is showing... Wait for a little bit, you might short at a higher price.
POSSIBLE STRATEGY
Let's take the BTCUSDT Future on the 2h chart :
You can display the indicator twice.
The first one with a length of 5, the second one with a length of 4.
To enter a long trade, wait for the green on length 5 and exit it at blue or red on length 4! It works like magic ;)
Disclaimer:
Trading and investing in the financial markets involves substantial risk of loss and is not suitable for every investor.
All trading strategies are used at your own risk.
Trend Analyzer is part of the SwingSwiss Suite, contact me for more info
Zeta CryptoAre you excited about Crypto Trading?
Crypto Trading is gaining immense popularity due to the excitement and returns it gives.
However, traditional indicators based upon lagging factors which generate Buy/Sell signals very late can not be used with crypto-trading.
The need of the hour is to create an indicator from ground up which reacts instantly when the price action starts and gives you much earlier entry or exit as compared to traditional lagging indicators.
Zeta Crypto is one such indicator which is based upon price cum volume action. It is said that "volume precedes price" or 'volume must validate the price move" and it is true in most of the situations.
Zeta Crypto tracks price and volume for you and keeps comparing it with historical data and as soon as it detects spikes, it gets into action and generates Buy/Sell signals right on your chart.
How to take Entry and When to Exit?
As soon as you see a Buy/Sell Signal on a candle, mark its closing price and if next or any subsequent candle opens and starts going in the same direction and clears the closing price of signal candle (where Buy/Sell signal is printed), Enter the trade and trail it till either (1) Opposite signal does not come or (2) Your Trailing Stop Loss is hit or (3) Till price again comes back to your Entry Level and starts hurting your position.
What Time Frame to use?
Do not use less than 5 min. Time Frame for this indicator. The best results are seen at 5 min., 10 min. 15 min. & 30 min. time frames. Higher time frames will give you delayed entry and lower than 5 min. will be too volatile.
What is the purpose of Support/Resistance Lines appearing on your chart?
These lines might offer you early entry or exit when the price approaches a Resistance or Support line.

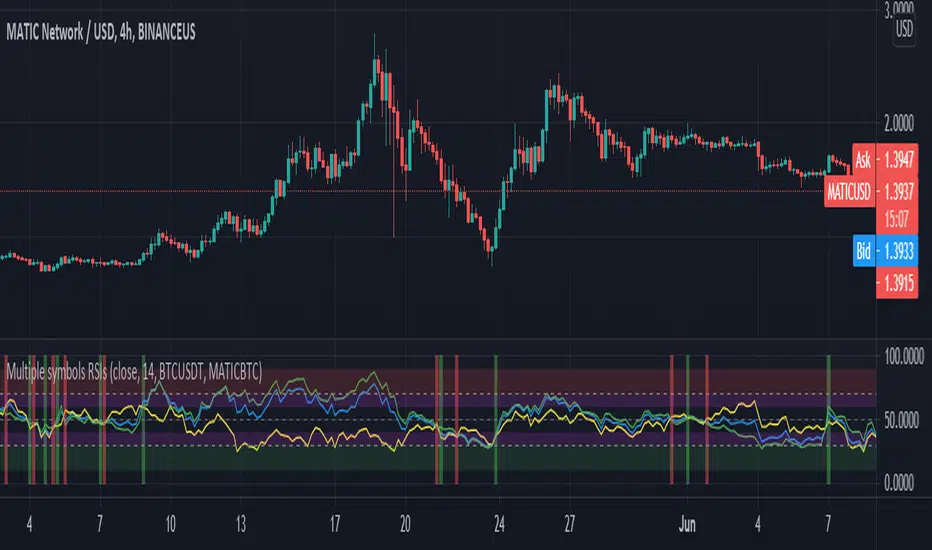
Crypto Tripple RSIGives an ability to compare 3 RSIs:
current altcoin + BTC (e.g. ADABTC) - green by default
current pair (e.g. ADAUSDT) - blue by default
BTC (e.g. BTCUSDT) - yellow by default
It helps to understand the cause of price change - whether BTC provokes price change or not. Also it shows performance of an altcoin - the bigger gaps between RSIs, the stronger (RSI of BTC is on the bottom)/ weaker (RSI of BTC is on the top) altcoin is.
PpSignal Super Smooth Move Average Improved V 1.0© 2013 John F. Ehlers Super Smooth Move Average Improved
In “Predictive And Successful Indicators” in this issue, author John Ehlers describes a new method for smoothing market data while reducing the lag that most other smoothing techniques have.
I applied an improvement to the formula that prevents the repainting of the color change, especially when chart is plotted for greater time intervals. This filter eliminates the noise completely, as opposed to moving averages, e.g., exponential (EMA) which only offers a modest attenuation effect.
Buy when the color is aqua-blue
Sell when the color is orange-red

4H Crypto RoycerThis indicator includes simple moving averages (21,50,200) and exponential moving averages (10,144) and has the ability to show this data on the chart with the approval of the user.
The indicator, which controls the intersections with the formulas it contains, can display the Golden Cross and Death Cross warnings to the user on the chart.
It draws a band on the chart with the support area calculations and in these band calculations; blends simple moving and exponential moving averages and smooths them by 1.5%.
It is used as a signal trigger in band overruns by replacing the lower and upper bands by calculation.
While one of our signal triggers is this band, our other variable is 50 simple moving averages.
Inspired by Kıvanç Özbilgiç's Supertrend indicator, the formula was updated using MA50 and 15% Stop-Loss instead of using atr multiplier.
Our chart has been tested in crypto currencies on 4 hour candles, so "4H" has been added to the beginning of the name.
We recommend using the indicator, buy / sell signals and the support band on the 4-hour charts.

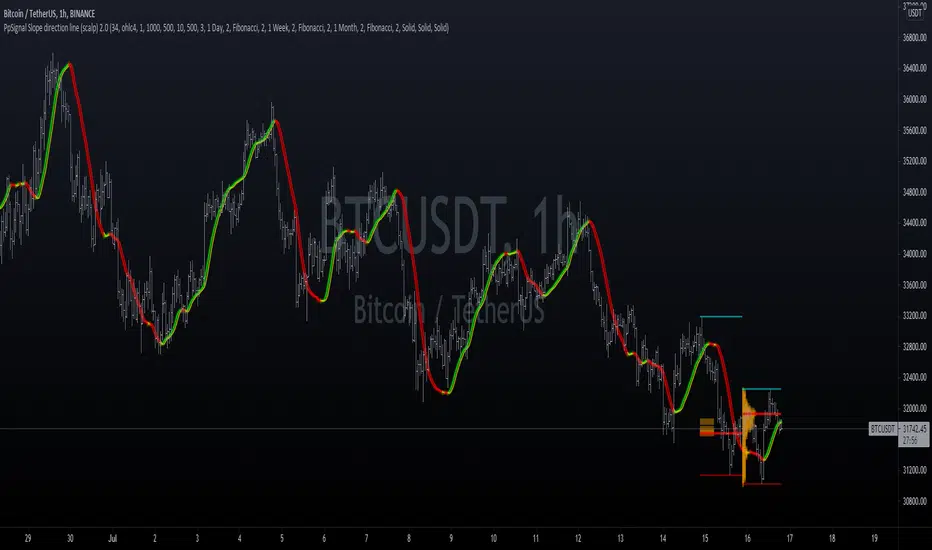
PpSignal Slope direction line (scalp) 2.0This is simply a moving average which is normally used to calculate the slopes of mountains, that changes color according to its slope, angle of incline, so it is red when it’s sloping downwards and green when sloped upwards. You can change the period of the moving average and the slope threshold for color change.
Green Color =Buy
Red color = sell
EMA SMA 100 CrossThis script utilizes the 100 EMA and the 100 SMA with printing labels for "Buy", "Short", and "Take Profit".
Essentially this indicator will print a "Buy" label when the 100 EMA(green line) is above the 100 SMA(red line) and "Take Profit" at the pivot points.
NOTE: There will be instances where the labels print based on coded criteria but will be false compared to trend. This is because the 100 EMA and SMA crosses can be short periods and reversals can happen frequently. This indicator should be used in conjunction with other indicators to help build a case for potential long or short entries.

Ichimoku Crypto Cloud 11-30-61A minor adjustment to the original Ichimoku Cloud, changing periods to reflect the 24/7 open market of cryptocurrency.
TENKAN: 11 - a week and a half
KIJUN: 30 - one month
SENKOU: 61 - two months
For a simpler visualization, I made the cloud limit lines and the Chikou line invisible by default.


Golden Mile indicatorThis indicator is based on several different collectively calculated indicators which are already used by many traders.
These include:
RSI
MFI
WaveTrend
Stochastics, and a few more bits i've thrown in.
This indicator can be used on any time frame, and is highly effective at helping decide whether the pressure lies in Buys or Sells.
free access..
Enjoy! :)

Bitfinex Spot PremiumOverview
A tool to display the spot price premium of Bitfinex coins vs the other big 3 exchanges.
Premium is calculated against:
- Coinbase
- Binance
- FTX
The average is calculated through volume weighting. The absolute difference between the Bitfinex spot price and the calculated average is then displayed on the histogram.
Interacting with the tool
Colours: Green bars indicate a positive premium (Bitfinex spot price is greater than the average), Red bars indicate a negative premium. The ability to grey out smaller premiums is also enabled with the "Grey Small Vals" checkbox, this can be used to further emphasise larger premiums.
Ticker: The ticker input allows you to detect the Bitfinex premium for any coin traded within all 4 exchanges (Bitfinex, Coinbase, Binance, FTX). Just input the coins ticker symbol, for example, "BTC", "ETH", "UNI".
Indicator Ideology
Bitfinex is known for being the home of crypto "smart money". Therefore, positive premiums indicate stronger buying from "smart money". Although this premium is a good sign of bullish/ bearish market conditions, for example, consecutive days of a negative Bitfinex premium have been pretty good at indicating short term tops in BTC, this indicator should only be used as a confirmation signal.
