Ahi Time Boxes - kotak hikmat matCikpoHEROThis indicator automatically draws boxes at specific times of the trading session. Each box starts at the selected timestamp and ends at the next one, helping traders visualize time blocks and market rhythm more clearly.maccCikpo8
经济周期


Hourly ORB Boxes v2 (5/15min/custom min)Draws ORB on 9.30am open and every hour from 11am to 3pm so you can enjoy multiple ORB entries throughout the day with a custom time
Choose 5 min or 10 min or 15 min for ORB.
All open source written from scratch with help of chatgpt lol

HK Premarket RangeIndicates Highs and lows in the premarket for Hong Kong futures. Could be used for Chinese futures too.

Weekend Box ( Support All Timeframe )Weekend Box ( Support All Timeframe )
Support manually adjust the Timezone to get better result of comparison.
Support manually adjust the Bar so that Weekend Box can be shifted any number of bars by your choice.
Maximum options for your better trading.

Daily Vertical Lines 6PM (Arctic Blue – No Sundays)Daily vertical lines to show each day's beginning at 6 pm, very simple, just bars to represent the days of each week in arctic blue, no sundays, so that it goes in tandem with my weekly indicator.

Weekly Vertical Lines (Sunday 6 PM) Weekly BarsSimply a light blue vertical line at the beginning of each week at exactly Sunday at 6 pm.

Sentiment Heatmap with EMA Sentiment Heatmap with EMA Let’s build a script mini-LuxAlgo-style sentiment heatmap Enhanced Simple Sentiment Heatmap + Right-Side Legend Automatic legend on the right side
Just like professional indicators:
MAX GREED
GREED
NEUTRAL
FEAR
MAX FEAR
✔ Legend stays updated on the last bar
It moves automatically as price moves.
✔ Trend EMA included (optional) 9 EMA → White
20 EMA → Red
50 EMA → Yellow
100 EMA → Blue
200 EMA → Purple Alerts (e.g., “Max Fear – Buy Zone”)
✔ Liquidity line / support-resistance auto zones Full sentiment heatmap (Greed → Fear)
✔ Right-side legend like LuxAlgo
✔ All 5 EMAs added (my colors): EMA trend cloud (9/20, 20/50, 50/200)
Buy/Sell circles based on sentiment reversals Right-side legend: MAX GREED / GREED / NEUTRAL / FEAR / MAX FEAR
5 EMAs:
9 → White
20 → Red
50 → Yellow
100 → Blue
200 → Purple

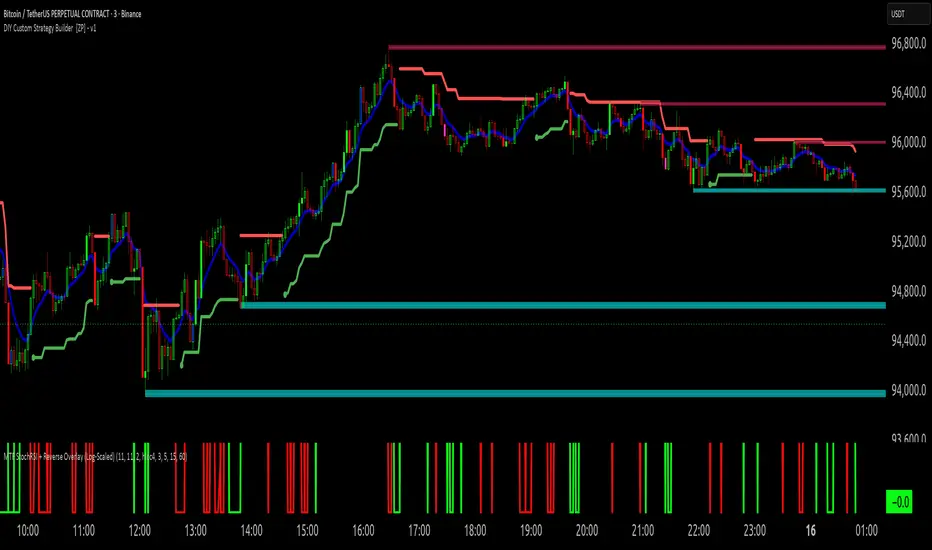
WTC Step Buy Step Edition CbyCarlo📊 WT Cross Modified – Step Buy Step Edition (v4)
WTC_StepBuyStep_Edition is an enhanced, practical, and optimized version of the classic WaveTrend (WT) Cross Indicator.
Developed for the Step Buy Step project, this tool helps traders identify market momentum shifts, structural price zones, and potential reversal areas with high clarity and precision.
🔍 Concept & Purpose
This indicator builds upon the established WaveTrend / LazyBear logic and extends it with additional structural intelligence.
The goal is to make overbought/oversold phases and trend reversals easier to spot — while also highlighting historically validated price zones where the market has previously reacted strongly.
⚙️ Key Features
1️⃣ WT Cross Signals
WT1 (yellow) and WT2 (purple) visualize market momentum.
A WT1 cross above WT2 while below the Oversold zone (−53) can indicate potential Long opportunities.
A WT1 cross below WT2 while above the Overbought zone (+53) can indicate potential Short opportunities.
Signals only confirm after candle close to prevent repainting.
2️⃣ Dynamic “WT SignalZone” Panel
Displayed in the top-right corner, this panel shows the last three valid price levels derived from WT signals:
🟢 LonLev – Buy support levels from previous WT Long signals
🔴 ShoLev – Sell resistance levels from previous WT Short signals
These zones act as objective support/resistance structures, based on historical momentum turning points — not subjective lines.
3️⃣ Flexible Calculation Modes
Choose how levels are derived from each WT signal:
Pullback 50% → Midpoint of the signal candle (high+low)/2
Close → Close price of the signal candle
Next Open → Open of the following bar (ideal for system testing)
📈 How to Interpret the Indicator
Market Condition WT Event Meaning
WT1 < −53 & CrossUp Long Signal Potential reversal / buy zone
WT1 > +53 & CrossDown Short Signal Potential exhaustion / sell zone
Price revisits LonLev Support Re-entry or bounce zone
Price revisits ShoLev Resistance Profit-taking or short setup zone
This makes the tool highly effective for:
Swing traders
Zone-based trading strategies
Systematic re-entries
Identifying structural turning points
🧠 Advantages
No repainting (signals confirmed only after bar close)
Works on all timeframes (from intraday to weekly)
Clean overview without clutter or excessive chart markers
Excellent as a filter to confirm market context
💬 Best Use Case
Use WTC_StepBuyStep_Edition as a contextual confirmation tool.
It does not replace a full trading system — but it gives you objective, repeatable, and statistically relevant zones where the market has reacted before.
Combine it with price action, volume analysis, or trend tools for even stronger setups.
© Step Buy Step • Step-Buy-Step.com
Educational trading tool intended for market analysis.
Not financial advice.

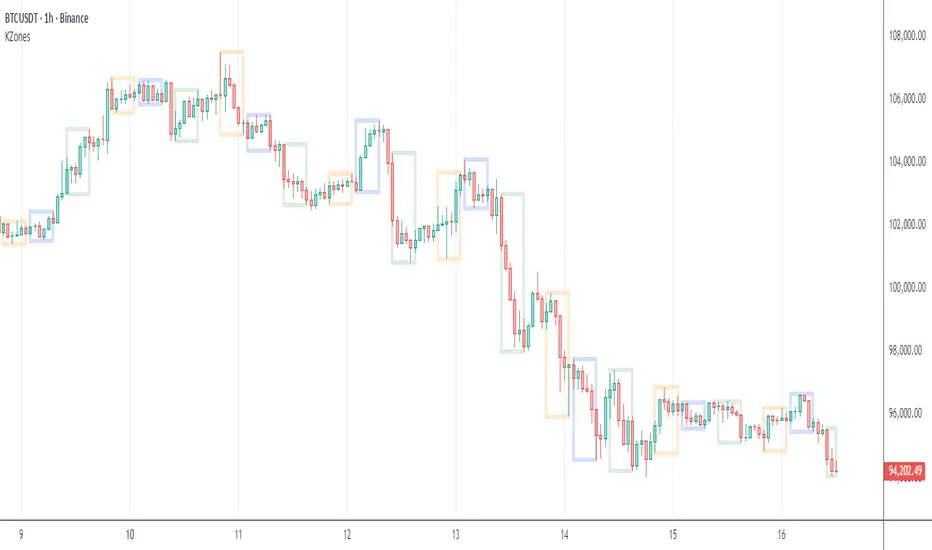
KZones Global Market Insight: Timezone moving marketsModern financial markets trade 24 hours a day, making it hard to track where the action is happening.
Do you wonder who is driving price action across Asia, Europe, and the Americas?
This indicator lets you visualize the trading activity of different geographic sessions.
For example, you can quickly see the recent move in Bitcoin was initiated by Americas selling down, represented by a large, downward-facing box. Asia and Europe followed through with more selling.
Start tracking the world's market movers today!
Note: This was inspired by ICT Killzones & Pivots
sima-Prev HTF & Sessions (Tehran)This indicator automatically plots the Opening, Closing, High, and Low levels of the major global trading sessions: London, New York, and Asia. It is designed to help traders visualize intraday liquidity zones, session-based volatility, and potential reaction levels where price commonly expands or reverses.
The script includes fully adjustable session times and highlights each session using clean visual markers so traders can easily identify market structure within different time windows. By displaying the Open, Close, High, and Low of each session, the indicator helps forecast areas of interest such as breakout levels, range boundaries, and session-based support/resistance.
This tool is especially useful for intraday traders, scalpers, and anyone who relies on session dynamics to analyze market behavior. It works on all timeframes and all markets, including Forex, indices, metals, and crypto. No repainting is used; all levels are plotted based on completed session data.

Net Profit Margin %📌 Net Profit Margin % Indicator — Short Explanation
This indicator calculates and displays a company’s Net Profit Margin (NPM) using its financial statements.
What it does:
Pulls Net Income and Total Revenue from the company’s quarterly (FQ) or yearly (FY) financials.
Calculates:
Net Profit Margin = (Net Income / Revenue) × 100
Plots the NPM% as a line chart.
Background turns green when margin is positive and red when negative.
Shows the latest NPM value in a small info table on the chart.
Purpose:
Helps you quickly see whether a company is profitable and how its profit margin is trending over time.

Consolidation Tracker🧭 Consolidation Tracker — Visualize Market Reversals in Real Time
The Consolidation Tracker is a minimalist yet powerful tool designed to map the anatomy of market reversals and trend transitions. It highlights the structural evolution of price through four key phases, helping traders anticipate shifts with clarity and confidence.
🔄 The Four Stages of a Market Reversal:
Failure to Displace — Price fails to break beyond recent highs or lows, signaling potential exhaustion of the current trend.
Consolidation (CAMP) — A range-bound phase where price compresses between a dynamic high and low. These zones are shaded gray, representing indecision and balance.
Engulfing (ENGULF) — A decisive candle closes beyond the CAMP high or low, suggesting a directional shift. These are highlighted in orange.
Fair Value Gap (FVG) — A three-candle pattern forms a price imbalance. If this FVG also engulfs the CAMP range, it confirms the reversal and resets the CAMP. Bullish FVGs are shaded green, bearish FVGs in red.
🔁 From Reversal to Trend:
Once a reversal is confirmed via an FVG, the market often transitions into a trend cycle characterized by:
Displacement — Strong directional movement away from the prior range.
Fair Value Gaps — Continuation imbalances that offer high-probability entries on retracements.
🧠 How It Works:
The indicator dynamically tracks CAMP highs and lows, updating only when a candle engulfs the range or a valid FVG forms.
FVGs are detected when a three-candle sequence creates a gap between candle 2 and 0, and the middle candle (candle 1) breaks the CAMP boundary.
CAMP levels are plotted as horizontal lines, while background colors narrate the evolving structure in real time.
This tool is ideal for traders who value market structure, price efficiency, and narrative clarity. Whether you're anticipating reversals or riding trends, the Consolidation Tracker offers a clean, actionable lens into price behavior.

Global Sessions by Back Ground ColorGlobal Sessions Background Color Indicator
This free TradingView tool visually highlights major global trading sessions directly on your chart using clean, professional color coding. It’s designed to help traders quickly identify periods of high liquidity and overlapping sessions, which often drive volatility and key price movements.
Features:
Session Highlights: Marks Asian, European (London), US (New York), and Overnight sessions with distinct background colors.
Overlap Detection: Special colors for overlapping sessions (e.g., London + New York).
Market Open/Close Alerts: Displays labels for major financial centers when they open or close.
Timezone-Aware: Automatically adjusts to Europe/Amsterdam (modifiable for your needs).
Clean Design: Uses a light, professional color palette for easy chart readability.
Why Use It?
Session timing is critical for spotting breakouts, reversals, and liquidity shifts. This indicator gives traders a clear visual edge without cluttering the chart—perfect for scalpers, day traders, and swing traders.
Completely free for the TradingView community – built by a trader, for traders.
How to Use the Global Sessions Indicator
This indicator automatically highlights major trading sessions on your chart using background colors. It helps you quickly identify when liquidity and volatility are likely to increase.
Color Guide:
Light Sky Blue → Asian Session (Tokyo, Sydney)
Active from 02:00 to 12:00 Amsterdam time. Often quieter but sets early trends.
Light Coral → European Session (London, Frankfurt)
Active from 09:00 to 17:30 Amsterdam time. Brings strong liquidity and trend continuation.
Light Green → US Session (New York, Chicago)
Active from 15:30 to 22:00 Amsterdam time. High volatility, major moves often occur here.
Gold/Yellow → Overnight/Wellington
Active from 23:00 to 02:00 Amsterdam time. Low liquidity, pre-Asia positioning.
Overlap Colors:
Orchid (Pinkish) → Asia + Europe Overlap
Indicates transition from Asia to London—watch for breakouts.
Light Salmon → Europe + US Overlap
The most volatile period of the day—ideal for intraday traders.
Extra Feature:
Labels show market open/close times for major financial centers (e.g., London Open, New York Close).

Weekly & Monthly Divider Lines — v6Instantly visualize the time structure on your charts with this simple and efficient indicator. It automatically plots vertical lines to mark the start of each new week and month, helping you segment price action and better understand the temporal context.
This is an essential tool for multi-timeframe analysis, identifying key period-open levels, or simply improving the visual clarity of your workspace.
✨ Key Features
Dual Display: Independently toggle weekly and monthly lines on or off.
Full Customization: Choose the color and width for each line type (weekly and monthly) to perfectly match your layout.
Time Range Control: Define how many years in the past and future you want the lines to be displayed. This keeps your chart clean by only loading relevant lines.
Optimized Performance (v6): This script uses Pine Script v6 and arrays for line management. It includes a function that automatically deletes the oldest lines when a maximum (configurable) count is reached, preventing the "Too many lines" error on charts with long historical data.
🛠️ Settings
Show Weekly/Monthly Lines: Check/uncheck to display the dividers.
Years to Display (Past/Future): Controls the time range for line plotting.
Color & Width: Customize the look of the lines.
Max Lines Kept Per Type: A technical parameter for memory management. The default value (250) is usually sufficient.

Turtle 20-Day Breakout (Donchian)Yes, the most important indicator used in the Turtle Rules (Turtle Trading Strategy) for finding breakouts above previous highs is the Donchian Channel. 🐢📈
Donchian Channel
The Donchian Channel is a trend-following indicator composed of three lines plotted on the chart:
Shutterstock
Upper Band: The highest high over the defined number of periods.
Lower Band: The lowest low over the defined number of periods.
Middle Line: The average of the Upper and Lower bands (not always used, but sometimes added for orientation).
The Turtle Rules use the following periods for the entry signals (breakouts) you mentioned in your query:
Short-Term (System 1): Crossing the 20-day high (this corresponds to the upper band of a Donchian Channel with a 20-period setting).
Mid-Term/Long-Term (System 2): Crossing the 55-day high (this corresponds to the upper band of a Donchian Channel with a 55-period setting).
Crossing the upper band signals a breakout and serves as the buy signal for a long position (for short positions, crossing below the lower band is used).
Is there anything else I can translate for you, or would you like me to elaborate on the Average True Range (ATR), the other key indicator used by the Turtles?

Session Range Boxes (Budapest time) GR V2.0Session Range Boxes (Budapest time)
This indicator draws intraday range boxes for the main Forex sessions based on Europe/Budapest time (CET/CEST).
Tracked sessions (Budapest time):
Asia: 01:00 – 08:00
Frankfurt (pre-London): 08:00 – 09:00
London: 09:00 – 18:00
New York: 14:30 – 23:00
For each session, the script:
Detects the session start and session end using the current chart timeframe and the Europe/Budapest time zone.
Tracks the high and low of price during the entire session.
Draws a box (rectangle) from session open to session close, covering the full price range between session high and low.
Optionally prints a small label above the first bar of each session (Asia, Fra, London, NY).
Color scheme:
Asia: soft orange box
Frankfurt: light aqua box
London: darker blue box
New York: light lime box
Use this tool to:
Quickly see which session created the high/low of the day,
Identify liquidity zones and session ranges that price may revisit,
Visually separate Asia, Frankfurt, London and New York volatility on intraday charts.
Optimized for intraday trading (Forex / indices), but it works on any symbol where session behavior matters.

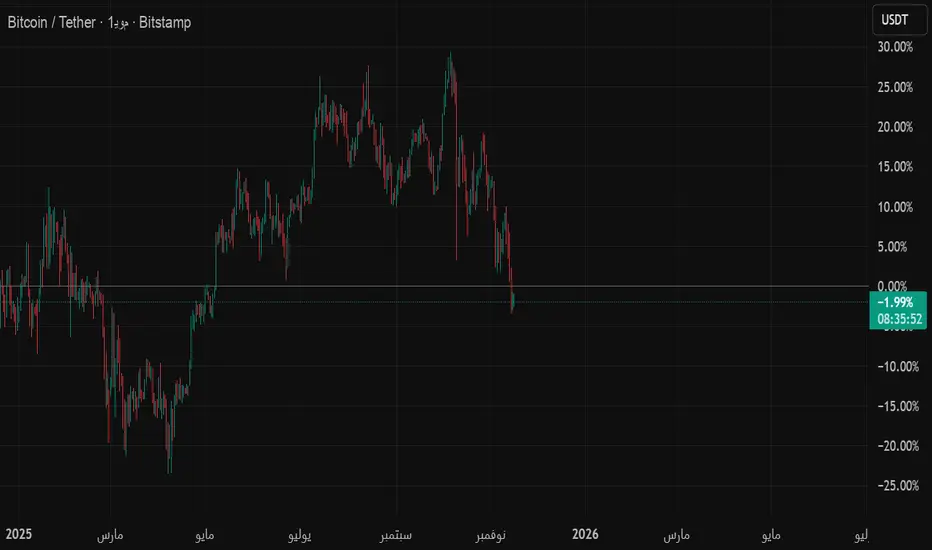
hell 1good for finding tops and bottoms in a trend .set to log scale and strech it like it looks in the chart

ENTRY CONFIRMATION V2// This source code is subject to the terms of the Mozilla Public License 2.0 at mozilla.org
// © Zerocapitalmx
//@version=5
indicator(title="ENTRY CONFIRMATION V2", format=format.price, timeframe="", timeframe_gaps=true)
len = input.int(title="RSI Period", minval=1, defval=50)
src = input(title="RSI Source", defval=close)
lbR = input(title="Pivot Lookback Right", defval=5)
lbL = input(title="Pivot Lookback Left", defval=5)
rangeUpper = input(title="Max of Lookback Range", defval=60)
rangeLower = input(title="Min of Lookback Range", defval=5)
plotBull = input(title="Plot Bullish", defval=true)
plotHiddenBull = input(title="Plot Hidden Bullish", defval=false)
plotBear = input(title="Plot Bearish", defval=true)
plotHiddenBear = input(title="Plot Hidden Bearish", defval=false)
bearColor = color.red
bullColor = color.green
hiddenBullColor = color.new(color.green, 80)
hiddenBearColor = color.new(color.red, 80)
textColor = color.white
noneColor = color.new(color.white, 100)
osc = ta.rsi(src, len)
rsiPeriod = input.int(50, minval = 1, title = "RSI Period")
bandLength = input.int(1, minval = 1, title = "Band Length")
lengthrsipl = input.int(1, minval = 0, title = "Fast MA on RSI")
lengthtradesl = input.int(50, minval = 1, title = "Slow MA on RSI")
r = ta.rsi(src, rsiPeriod) // RSI of Close
ma = ta.sma(r, bandLength ) // Moving Average of RSI
offs = (1.6185 * ta.stdev(r, bandLength)) // Offset
fastMA = ta.sma(r, lengthrsipl) // Moving Average of RSI 2 bars back
slowMA = ta.sma(r, lengthtradesl) // Moving Average of RSI 7 bars back
plot(slowMA, "Slow MA", color=color.black, linewidth=1) // Plot Slow MA
plot(osc, title="RSI", linewidth=2, color=color.purple)
hline(50, title="Middle Line", color=#787B86, linestyle=hline.style_dotted)
obLevel = hline(70, title="Overbought", color=#787B86, linestyle=hline.style_dotted)
osLevel = hline(30, title="Oversold", color=#787B86, linestyle=hline.style_dotted)
plFound = na(ta.pivotlow(osc, lbL, lbR)) ? false : true
phFound = na(ta.pivothigh(osc, lbL, lbR)) ? false : true
_inRange(cond) =>
bars = ta.barssince(cond == true)
rangeLower <= bars and bars <= rangeUpper
//------------------------------------------------------------------------------
// Regular Bullish
// Osc: Higher Low
oscHL = osc > ta.valuewhen(plFound, osc , 1) and _inRange(plFound )
// Price: Lower Low
priceLL = low < ta.valuewhen(plFound, low , 1)
bullCond = plotBull and priceLL and oscHL and plFound
plot(
plFound ? osc : na,
offset=-lbR,
title="Regular Bullish",
linewidth=1,
color=(bullCond ? bullColor : noneColor)
)
plotshape(
bullCond ? osc : na,
offset=-lbR,
title="Regular Bullish Label",
text=" EDM ",
style=shape.labelup,
location=location.absolute,
color=bullColor,
textcolor=textColor
)
//------------------------------------------------------------------------------
// Hidden Bullish
// Osc: Lower Low
oscLL = osc < ta.valuewhen(plFound, osc , 1) and _inRange(plFound )
// Price: Higher Low
priceHL = low > ta.valuewhen(plFound, low , 1)
hiddenBullCond = plotHiddenBull and priceHL and oscLL and plFound
plot(
plFound ? osc : na,
offset=-lbR,
title="Hidden Bullish",
linewidth=1,
color=(hiddenBullCond ? hiddenBullColor : noneColor)
)
plotshape(
hiddenBullCond ? osc : na,
offset=-lbR,
title="Hidden Bullish Label",
text=" EDM ",
style=shape.labelup,
location=location.absolute,
color=bullColor,
textcolor=textColor
)
//------------------------------------------------------------------------------
// Regular Bearish
// Osc: Lower High
oscLH = osc < ta.valuewhen(phFound, osc , 1) and _inRange(phFound )
// Price: Higher High
priceHH = high > ta.valuewhen(phFound, high , 1)
bearCond = plotBear and priceHH and oscLH and phFound
plot(
phFound ? osc : na,
offset=-lbR,
title="Regular Bearish",
linewidth=1,
color=(bearCond ? bearColor : noneColor)
)
plotshape(
bearCond ? osc : na,
offset=-lbR,
title="Regular Bearish Label",
text=" EDM ",
style=shape.labeldown,
location=location.absolute,
color=bearColor,
textcolor=textColor
)
//------------------------------------------------------------------------------
// Hidden Bearish
// Osc: Higher High
oscHH = osc > ta.valuewhen(phFound, osc , 1) and _inRange(phFound )
// Price: Lower High
priceLH = high < ta.valuewhen(phFound, high , 1)
hiddenBearCond = plotHiddenBear and priceLH and oscHH and phFound
plot(
phFound ? osc : na,
offset=-lbR,
title="Hidden Bearish",
linewidth=1,
color=(hiddenBearCond ? hiddenBearColor : noneColor)
)
plotshape(
hiddenBearCond ? osc : na,
offset=-lbR,
title="Hidden Bearish Label",
text=" EDM ",
style=shape.labeldown,
location=location.absolute,
color=bearColor,
textcolor=textColor
)


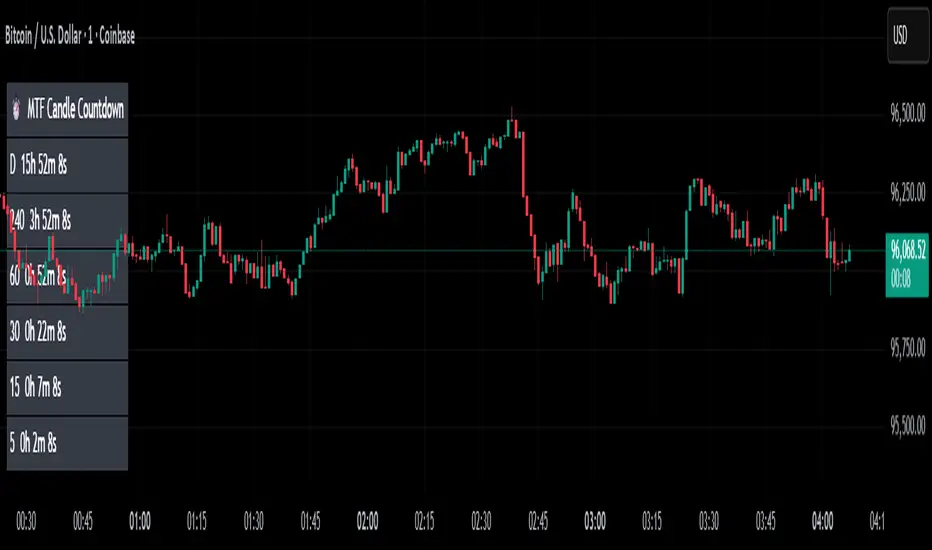
MTF Candle Countdown — HUD V1 (By Price-Action-Art)
MTF Candle Countdown — HUD V1 (By Price-Action-Art)
A clean, lightweight HUD that shows you exactly how much time is left in multiple higher-timeframe candles — all in one place.
This tool is designed for traders who rely on multi-timeframe precision.
Instead of constantly switching charts or checking timers, the HUD gives you a real-time countdown for up to six timeframes (Daily, 4H, 1H, 30m, 15m, 5m by default).
You can fully customize the timeframes, text size, and HUD position on your chart.
Perfect for:
Intraday and scalping timing
Swing traders waiting for HTF candle closes
ICT / SMC structure-based traders
Anyone who needs exact candle close timing without distractions
Features:
Real-time multi-timeframe candle countdown
Fully adjustable HUD placement (all corners)
Customizable timeframes and text size
Clean, minimal, and non-intrusive design
Updates only on the last bar for performance efficiency
Optional border for a sharper HUD look
Whether you’re waiting for a Daily close to confirm structure or timing your entries around 5m/15m candles, this HUD keeps everything visible and precise at a glance.
If you find this tool helpful, feel free to like, comment, and follow — it motivates me to keep releasing more tools for the community.