Price/Volume Trend MeterAnother simple indicator from the sweet indicator series, This is a combination of the Volume and Price Trend Meter indicators combined (Links below) into one indicator called PVTM (Price Volume Trend Meter).
PVTM measures the strength of price and volume pressure on a histogram.
The indicator sums up all green candles price and volume and red candles price and volume over a specific period of bars and plots based on Price summed value. The result will look similar to Price Trend Meter with the benefit of trying to filter out more noise.
Use this indicator to identify the increasing asset of price and volume with the green candles (Close is higher than open) and decreasing of price and volume with the red candles (Close is lower than open).
======= Calculation ==========
Bright Green Color Column: Total summed up Price and Volume are higher than 0.
Bright Red Color Column: Total summed up Price and Volume are Lower than 0.
Weak Green Color Column: Conflict between Price and Volume (One positive and one negative) so we continue based on previous color .
Weak Red Color Column: Conflict between Price and Volume (One positive and one negative) so we continue based on previous color.
======= Price/Volume Trend Meter Colors =======
Green: Increasing buying pressure.
Weaker Green: Declining Buying pressure (Possible Sell Reversal).
Red: Increasing selling pressure.
Weaker Red: Declining Selling pressure (Possible Buy Reversal).
Other sweet indicators that this indicator is based on:
Volume Trend Meter:
Price Trend Meter:
Like if you Like and Follow me for upcoming indicators/strategies: www.tradingview.com
D-histogram

Price Trend MeterYet another sweet little indicator which measures price pressure over specific period of time. I call it Price Trend Meter (PTM),
It's basically similar to the indicator 'Volume Trend Meter' (VTM) but this time the calculations are based on price rather than volume.
The indicator sums up all the prices of the green candles and red candles over a specific period of time (source and bars back can be adjusted in indicator settings).
======= Calculation ==========
For Green Column: Total price of green candles is higher than total red candles price for a specific bars back.
For Red Column: Total price of red candles is higher than the total green candles price for a specific bars back.
======= Price Trend Meter Colors =======
Green: Increasing buying pressure.
Red: Increasing selling pressure.
For the Volume Trend Meter indicator go here : https:www.tradingview.com/script/ywEEvEtI-Volume-Trend-Meter/
Stay tuned and Follow as a combination indicator of the two indicators (VTM + PTM) will be coming up next: https:www.tradingview.com/u/dman103/#published-scripts
Like if you like and Enjoy.

On Chart Reverse MACD HistogramThe On Chart Reverse MACD Histogram is a visual representational spin of the original MACD Histogram to assist the end-user in their decision making for entry, exit and risk management, as well as freeing up space for the chart.
The On Chart Reverse MACD Histogram, which very basically is a reverse engineered calculation of the MACD's Histogram gives the user a visual representation of the relationship between the current price and the MACD's Histogram on the chart instead of having to reference the MACD itself. At a glance this can then be used to visually see on the chart the closing price level needed in order to change the MACD's Histogram momentum either up or down.
Optional Settings Include:
-------------------------------
1.) Show/Hide Reverse MACD Histogram Momentum text
2.) Change the Reverse MACD Histogram Momentum information type (Basic/Detailed)
3.) Change the Reverse MACD Histogram Momentum text size
4.) Change the Reverse MACD Histogram Momentum text color
5.) Change the Reverse MACD Histogram Momentum text left margin
6.) Show/hide the Reverse MACD Histogram Momentum text currency
7.) Change the Reverse MACD Histogram Momentum text decimal value
8.) Show/hide the MACD Histogram Momentum Level
9.) Show the MACD Histogram Momentum Level As Columns *
* Please Note: When using the "Show Histogram Level As Columns" setting, in order to display this feature correctly without distorting the chart, click the ⚙️ (cog) icon in the bottom right corner of your chart and select the 'Scale Price Chart Only' option.

Reverse MACD Cross + Histogram DivergenceThe Reverse MACD Cross + Histogram Divergence is in essence the same MACD you all know and love with two added features which can be used to assist the end-user in their decision making for entry, exit and risk management.
The first feature is a Reverse MACD Cross price, which very basically is a smoothed reverse engineered calculation of the MACD Signal Line in relation to the current price level. At a glance this can then be used to determine the closing price level needed in order to cross the MACD either up or down.
The second feature is visual MACD Histogram regular as well as hidden divergences. This feature was added as MACD histogram divergences are not as easy to
spot as on the RSI for example, and can help the end-user train their eyes in order to spot them more accurately.
Divergence colors and description:
------------------------------------------
Green : Regular Bullish Divergence
White : Hidden Bullish Divergence
Red : Regular Bearish Divergence
Orange : Hidden Bearish Divergence
Optional settings include:
-------------------------------
1.) Show the Histogram only (Hide the MACD and Signal lines)
2.) Show/Hide the Reverse MACD Cross label
3.) Change the Reverse MACD Cross label text size
4.) Change the Reverse MACD Cross label left margin
5.) Show/hide the Reverse MACD Cross label currency
6.) Change the Reverse MACD Cross label decimal value
7.) Show/hide the MACD Histogram Divergence lines
8.) Change the MACD Histogram Divergence line offset
9.) Show/hide the MACD Histogram Divergence arrows
10.) Change the MACD Histogram Divergence arrow offset
11.) Change the MACD Histogram Divergence lookback (No. of bars to lookback)
Please PM me to obtain access.

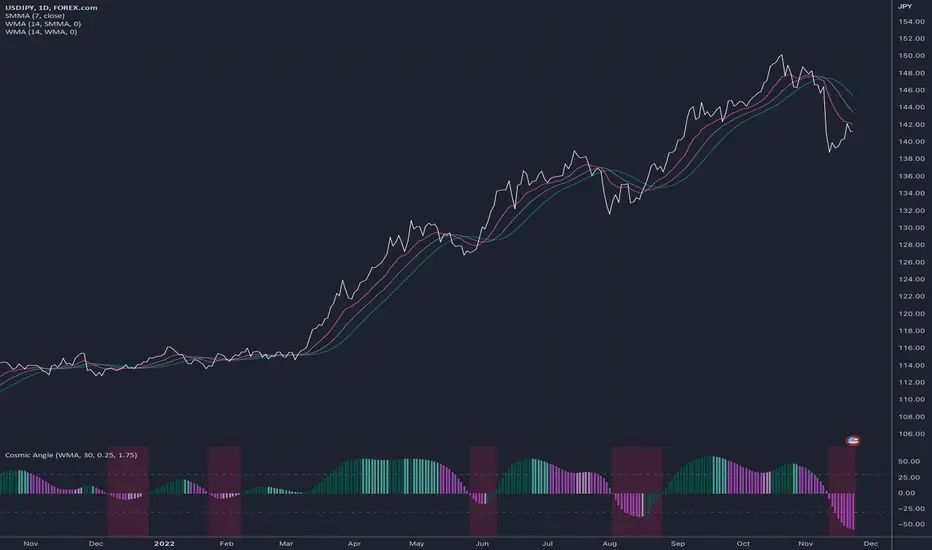
Cosmic AngleThis is a histogram that can display a moving average's angle and also show how volatile the change in angle is.
To use:
Add any moving average indicator to the chart
Click that indicator's More > Add Indicator on (MA)
Select the Cosmic Angle indicator
Adjust the Cosmic Angle 's Price To Bar Ratio value to reflect that of your chart's
Adjust the Cosmic Angle 's Threshold as per your liking (*1)
(*1) This setting affects the bar colors. It represents the minimum difference in degrees between the n and n-1 bars' angle to force a change of color.
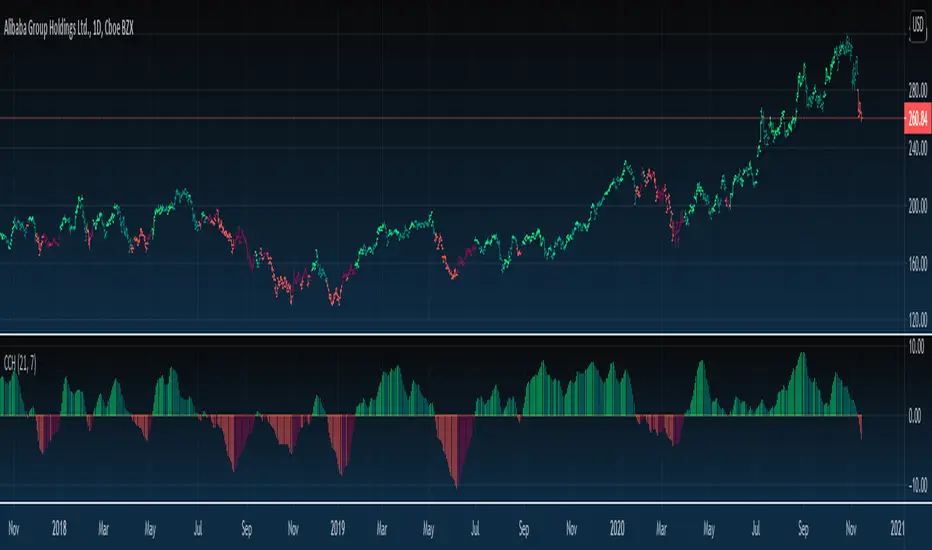
Close Counter HistogramAn interesting experiment to make an indicator act as a counter. I call it CCH - Close Counter Histogram.
It adds 1 when current close is higher than previous close and reduces -1 when current close is lower than previous close.
In the CCH settings you set how many bars to look back and use EMA to smooth the results or disable EMA smoothing.
Disable the EMA smoothing and you'll see the real deal (pure counter).
The higher the GREEN columns the more higher closes and the lower the RED columns the more lower closes.
In case columns are declining above 0 a more darker green will appear.
In case columns are declining below 0 a more darker red will appear.
Supports bar coloring (disabled by default).
Feel free to comment and Like if you like.
Enjoy :)
DMI-ADX HistogramThe Average Direction Index (ADX) coupled with the Direction Movement Index (DMI), developed by J. Welles Wilder, is a popular indicator that measures trend direction and strength.
The AX line (blue) is used to show the strength of the current trend. It does not tell you the trend direction. The under laid histogram shows relative movements of the price with green showing positive momentum and red showing negative momentum. Use these ADX and DMI together to find trend strength and direction.
- ADX line below 20 indicates that the underlying is in accumulation/distribution.
- ADX line above 20 mean that the underlying is trending with over 60 being very strong.
*When the ADX line is below 20 it is likely to see many reversal signals on the DMI Histogram. It is best to use the DMI signals when the ADX line is above 20 or higher. This is also a good level to play around with.
Motivation
Normally the direction movements are plotted as lines with the DI+ being green and the DI- being red. When the DI+ (green) crosses over DI- (red) this may indicate a buy signal, and vice versa. I found this visual representation made it difficult to see signals as well as lacked the ability to easy see the relative strength of other moves.
I have also noticed that the histogram values will periodically cross the ADX line, but not for very long periods. This could be a useful signal to explore further in the future.
In this image the top indicator is using the normal DI+/- lines, where the bottom indicator is using an absolute histogram.

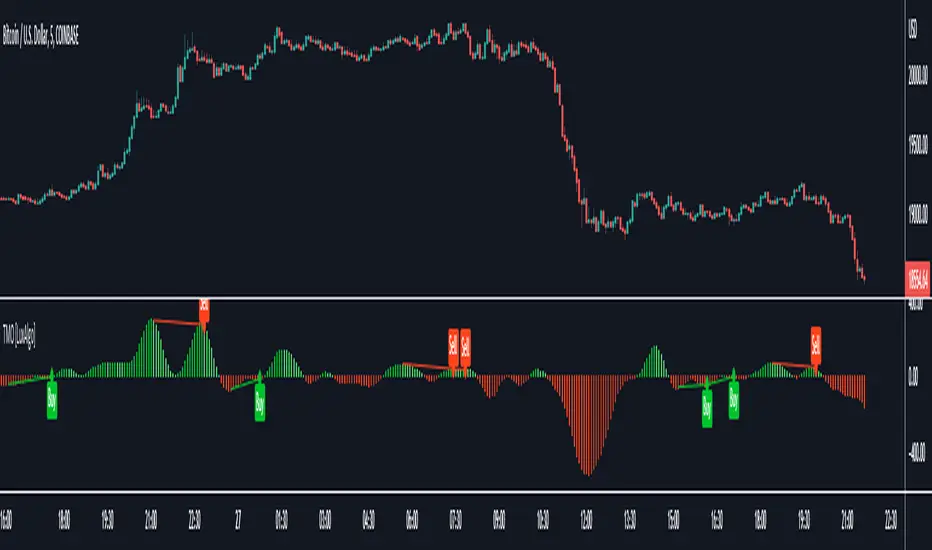
Triangular Momentum Oscillator & Real Time Divergences [LuxAlgo]Oscillators are widely used in technical analysis and can return a large amount of information to the trader depending on their design. It is common to use oscillators to detect divergences with the price, divergences occur when the tops/bottoms made by the oscillator and price are negatively correlated.
The following oscillator is based on the momentum of a triangular moving average, hence the name "triangular momentum" because of the very smooth property of the triangular moving average, we aimed at a real-time detection of divergences instead of using more common methods such as relying on pivot high/low detection which are suitable for more noisy oscillators.
The oscillator can also be colored based on a gradient derived from the correlation between its output and the price which can be useful to detect when the oscillator is out of phase (significantly lagging or leading the price).
Settings
length : Period of the oscillator, higher values return a smoother output.
src : Input source of the indicator.
Show Lines : Show lines connecting the current top/bottom with the previous one made by the oscillator when a divergence is detected. True by default.
Color Based On Price/Oscillator Correlation : Allows the color of the oscillator to change based on its correlation with the price, with red colors suggesting a negative correlation.
Usages
The advantage of having a smoother oscillator for divergences detection is that it can be done in real-time since a top or bottom is present when the oscillator first difference cross 0. Smoother oscillators are also easier to interpret, however, they will still suffer from lag.
The divergences detected by the oscillator are regular divergences, where the oscillator leads price variations.
Using higher values of length allows the oscillator to filter out longer-term variations thus being smoother as a result.
By using the color mode based on the price/oscillator correlation we can see where the oscillator leads or lag the price, and since divergences are based on the price and oscillator going in the opposite direction we can have information where price might reverse.
It is also possible to interpret the oscillator without relying on the divergence detection, with a decreasing value of the oscillator indicating a downtrend and an increasing value indicating an uptrend.
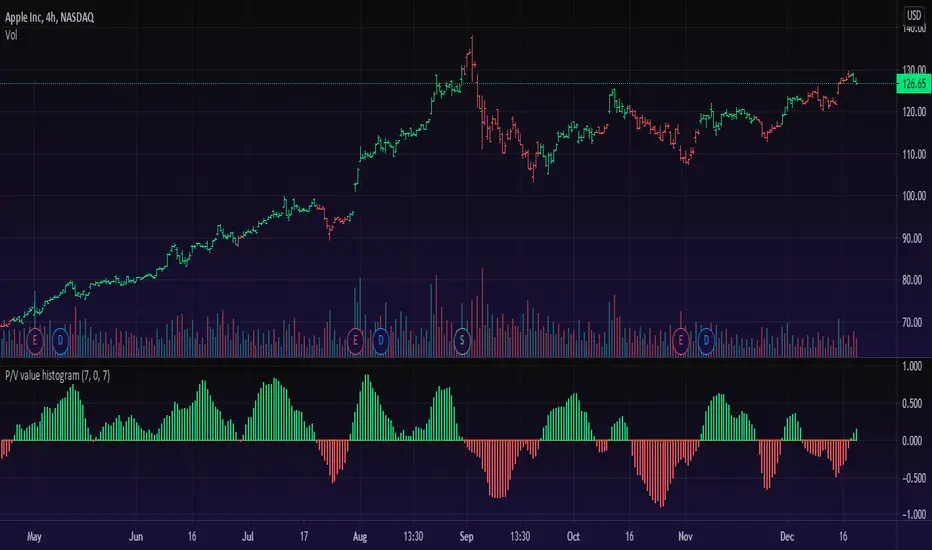
Price/Volume Value HistogramAn interesting implementation of mine to measure an asset changes based on asset price velocity and volume velocity. The indicator acts as asset value calculator. Long and Short.
==Points System Rules==
UPTRENDING
If Current Close is higher than previous Close and Current Volume is bigger than previous Volume: Adds Close Points and Volume Points
Otherwise check
If Current Close is higher than previous Close: Adds Only Close Points
DOWNTRENDING
If Current Close is lower than previous Close and Current Volume is bigger than previous Volume: Reduces Close Points and Volume Points
Otherwise check
If Current Close is lower than previous Close: Reduces Only Close Points
==Plotting==
Result of the values are summed up to a histogram.
Obviously on increasing prices and volume the histogram will be above zero line and on the Bullish side (green color), otherwise, on the Bearish side (red color).
You can't cheat the price movement, it's just what it is.
Optional to smooth it by EMA (set to true by default).
Like if you Like and Enjoy!
Follow for upcoming indicators.
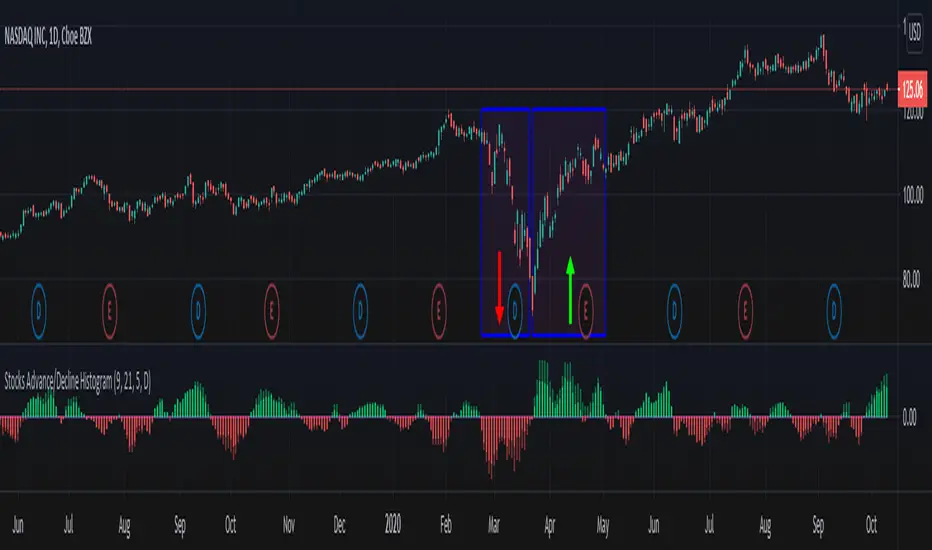
Stocks Advance/Decline HistogramStocks Advance/Decline Histogram indicator, which I call ADH is my own implementation that plots an histogram of the difference between the number of advancing and declining stocks on a daily basis (or higher time frame) for the NASDAQ and NYSE.
How to use it?
Green: More NYSE stocks are advancing than declining.
Red: More NYSE stocks are declining than advancing.
Light Green: More NASDAQ stocks are advancing than declining.
Light Red: More NASDAQ stocks are declining than advancing.
Note: Advance/Decline data is based on daily or higher time frames.
MA MTF Momentum HistogramMy own interpretation indicator which i call multi time frame moving averages momentum with NO LAG EMA support (Optional).
The indicator is calculated by subtracting the long-term EMA from the short-term EMA .
This pretty much resembles the MACD moving averages calculation but without the smoothing of the histogram.
Can also be used to find divergences.
The background shows the main trend with higher time frame which can be set in the settings.
Aimed to use with Higher time frame (Double or more) but can also work with lower time frame.
How to use the indicator?
==Histogram==
Green: Momentum of asset is positive and increasing.
Lighter Green: Momentum of asset is still positive but decreasing and can revert to negative momentum.
Red: Momentum of asset is negative and increasing.
Lighter Red: Momentum of asset is still negative but increasing and revert to positive momentum.
==Background Color - Main Trend==
Green: HTF (Higher time frame) momentum is positive.
RED: HTF momentum is negative.
Feel free to comment and Follow to stay updated with upcoming scripts: www.tradingview.com
NOTE: BARS ARE COLORED BY DEFAULT WITH HISTOGRAM COLORS! (Can be changed in settings)

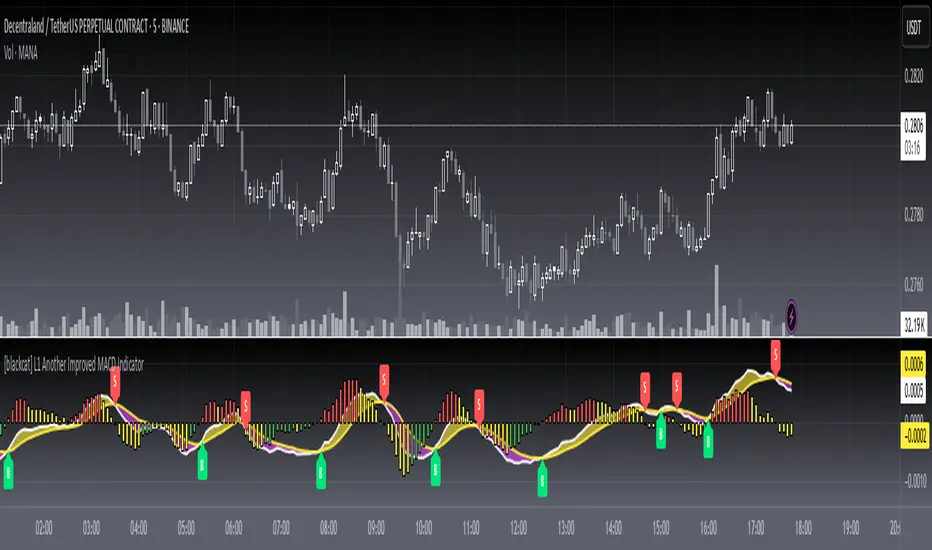
[blackcat] L1 Another Improved MACD IndicatorLevel: 1
Background
The MACD is a superior derivative of moving average crossovers and was developed by Gerald Appel in 1979 as a market timing tool. MACD uses two exponential moving averages with different bar periods, which are then subtracted to form what Mr. Appel calls the Fast Line. A 9-period moving average of the fast line creates the slow line.
Function
L1 Another Improved MACD Indicator improves MACD histogram by customized an algorithm and add three levels of long entry alerts derived from ema ().
Key Signal
diff --> classic MACD diff fast line in white
dea --> classic MACD dea slow line in yellow
macd --> classic difference histogram,but I did not use it directly in the plot.
macd1 --> ema3 of macd
Pros and Cons
Pros:
1. more clear sub level trend change with new histograms
Cons:
1. need sophisticated knowledge of MACD to use this well
2. this still requires a lot of MACD experience to obtain reliable trading signals
Remarks
Another improved MACD on histogram
Readme
In real life, I am a prolific inventor. I have successfully applied for more than 60 international and regional patents in the past 12 years. But in the past two years or so, I have tried to transfer my creativity to the development of trading strategies. Tradingview is the ideal platform for me. I am selecting and contributing some of the hundreds of scripts to publish in Tradingview community. Welcome everyone to interact with me to discuss these interesting pine scripts.
The scripts posted are categorized into 5 levels according to my efforts or manhours put into these works.
Level 1 : interesting script snippets or distinctive improvement from classic indicators or strategy. Level 1 scripts can usually appear in more complex indicators as a function module or element.
Level 2 : composite indicator/strategy. By selecting or combining several independent or dependent functions or sub indicators in proper way, the composite script exhibits a resonance phenomenon which can filter out noise or fake trading signal to enhance trading confidence level.
Level 3 : comprehensive indicator/strategy. They are simple trading systems based on my strategies. They are commonly containing several or all of entry signal, close signal, stop loss, take profit, re-entry, risk management, and position sizing techniques. Even some interesting fundamental and mass psychological aspects are incorporated.
Level 4 : script snippets or functions that do not disclose source code. Interesting element that can reveal market laws and work as raw material for indicators and strategies. If you find Level 1~2 scripts are helpful, Level 4 is a private version that took me far more efforts to develop.
Level 5 : indicator/strategy that do not disclose source code. private version of Level 3 script with my accumulated script processing skills or a large number of custom functions. I had a private function library built in past two years. Level 5 scripts use many of them to achieve private trading strategy.
ADX Histogram with DI linesInspired by the user scarf from Tradingview. In contrast with that other indicator, this one instead of a simple moving average (SMA) for the ADX calculations, uses a running moving average (RMA) or also known as Wilder's Average. I like having a histogram for the DI lines over just having lines alone because it makes it easier to see. In addition I made it so that values less than 5 for the DI lines are colored lightly to note that the movement was less significant(might not matter but some might care about it, atleast I do). The ADX has a color fainting effect too, and when it goes above the threshold then it becomes black to note that it is trending, as the indicator suggests.
The advantages with these additions and changes are that it shows a more traditional moving average like the original author Wellers Wilder suggested and you can see the crossings and directional movement changes easier from seeing the colors on the histogram easier than you would by looking at the DI lines alone. The disadvantages are you won't be able to tell when the ADX line is above both DI lines and when the ADX then makes a decrease from there(which can sometimes show a reversal), but personally it doesn't matter too much to me and perhaps to those who care more about seeing the direction than having to focus on all those 3 lines crossing all over the place.

[blackcat] L1 Close Histogram OscillatorLevel: 1
Background
A histogram is a special chart that is applied to statistical data that is divided into numerically ordered groups. For example groups with close relationships in the vicinity like "Close-ref(Close ,1)", "Close-ref(Close,2)" and so on. A histogram provides a snapshot of all the data so that you can quickly get an overview of the historical data, especially its general shape.In a histogram, the bars are linked - in contrast to a bar chart for categorical data, in which the bars represent categories that are in no particular order and are separated. The height of each bar in a histogram indicates either the number of individuals (called the frequency) in each group or the percentage of individuals (the relative frequency) in each group. Each individual in the data set falls into exactly one bar.
Function
L2 Close Histogram Oscillator is a novel overbought and oversold indicator that estimate the trend state by counting a specific bar relationship nearby. Once nearby bars reach consensus, it may spread to global quickly. The reason why I got this inspiration is because I have been engaged in the research of blockchain consensus mechanism. The market is a complex system, and its consensus depends on the common human characteristics: greed and fear. The trend of the market often also conforms to sociological characteristics. Maybe it's a bit complicated for me to say that. However, if you understand the principle of the spread of rumors and viruses, you can understand the situation where some individuals in the market have local consensus and gradually spread to the overall situation. This is the process of trend formation.
Key Signal
fastcounter --> fast close histogram counters
slowcounter --> slow close histogram counters
attention --> bottom price appears, with height of 10 in white
readybuy --> a small position buy opportunity after first bottom detected, with height of 20 in yellow
buylow --> a small position buy at low price, with height of 30 in lime
longentry --> a confirmed long entry signal by close histogram counter, with height of 40 in green
risk --> oscillator top is reached and trend reversal may happen, with height drop from 100 to 80 in red
Pros and Cons
Pros:
1. since this is based on consensus formation principle, i think this is a leading indicator by spreading local consensus to global
2. it is an oscillator, overbought and oversold can be easily observed.
Cons:
1. the model is not complex enough to depict market behavior exactly.
2. sideways and chop market will make this indicator's output hard to read.
Remarks
This is rare! I combined my previous theory of developing cellular automata with the market to produce such a weird indicator. I hope to inspire everyone and study market behavior in a deeper level.
Readme
In real life, I am a prolific inventor. I have successfully applied for more than 60 international and regional patents in the past 12 years. But in the past two years or so, I have tried to transfer my creativity to the development of trading strategies. Tradingview is the ideal platform for me. I am selecting and contributing some of the hundreds of scripts to publish in Tradingview community. Welcome everyone to interact with me to discuss these interesting pine scripts.
The scripts posted are categorized into 5 levels according to my efforts or manhours put into these works.
Level 1 : interesting script snippets or distinctive improvement from classic indicators or strategy. Level 1 scripts can usually appear in more complex indicators as a function module or element.
Level 2 : composite indicator/strategy. By selecting or combining several independent or dependent functions or sub indicators in proper way, the composite script exhibits a resonance phenomenon which can filter out noise or fake trading signal to enhance trading confidence level.
Level 3 : comprehensive indicator/strategy. They are simple trading systems based on my strategies. They are commonly containing several or all of entry signal, close signal, stop loss, take profit, re-entry, risk management, and position sizing techniques. Even some interesting fundamental and mass psychological aspects are incorporated.
Level 4 : script snippets or functions that do not disclose source code. Interesting element that can reveal market laws and work as raw material for indicators and strategies. If you find Level 1~2 scripts are helpful, Level 4 is a private version that took me far more efforts to develop.
Level 5 : indicator/strategy that do not disclose source code. private version of Level 3 script with my accumulated script processing skills or a large number of custom functions. I had a private function library built in past two years. Level 5 scripts use many of them to achieve private trading strategy.

MACD-X, More Than MACD by DGTMoving Average Convergence Divergence – MACD
The most popular indicator used in technical analysis, the moving average convergence divergence (MACD), created by Gerald Appel. MACD is a trend-following momentum indicator, designed to reveal changes in the strength, direction, momentum, and duration of a trend in a financial instrument’s price
Historical evolution of MACD,
- Gerald Appel created the MACD line,
- Thomas Aspray added the histogram feature to MACD
- Giorgos E. Siligardos created a leader of MACD
MACD employs two Moving Averages of varying lengths (which are lagging indicators) to identify trend direction and duration. Then, MACD takes the difference in values between those two Moving Averages (MACD Line) and an EMA of those Moving Averages (Signal Line) and plots that difference between the two lines as a histogram which oscillates above and below a center Zero Line. The histogram is used as a good indication of a security's momentum.
Mathematically expressed as;
macd = ma(source, fast_length) – ma(source, slow_length)
signal = ma(macd, signal_length)
histogram = macd – signal
where exponential moving average (ema) is in common use as a moving average (ma)
fast_length = 12
slow_length = 26
signal_length = 9
The MACD indicator is typically good for identifying three types of basic signals ;
Signal Line Crossovers
A Signal Line Crossover is the most common signal produced by the MACD. On the occasions where the MACD Line crosses above or below the Signal Line, that can signify a potentially strong move. The standard interpretation of such an event is a recommendation to buy if the MACD line crosses up through the Signal Line (a "bullish" crossover), or to sell if it crosses down through the Signal Line (a "bearish" crossover). These events are taken as indications that the trend in the financial instrument is about to accelerate in the direction of the crossover.
Zero Line Crossovers
Zero Line Crossovers occur when the MACD Line crossed the Zero Line and either becomes positive (above 0) or negative (below 0). A change from positive to negative MACD is interpreted as "bearish", and from negative to positive as "bullish". Zero crossovers provide evidence of a change in the direction of a trend but less confirmation of its momentum than a signal line crossover
Divergence
Divergence is another signal created by the MACD. Simply, divergence occurs when the MACD and actual price are not in agreement. A "positive divergence" or "bullish divergence" occurs when the price makes a new low but the MACD does not confirm with a new low of its own. A "negative divergence" or "bearish divergence" occurs when the price makes a new high but the MACD does not confirm with a new high of its own. A divergence with respect to price may occur on the MACD line and/or the MACD Histogram
Moving Average Crossovers , another hidden signal that MACD Indicator identifies
Many traders will watch for a short-term moving average to cross above a longer-term moving average and use this to signal increasing upward momentum. This bullish crossover suggests that the price has recently been rising at a faster rate than it has in the past, so it is a common technical buy sign. Conversely, a short-term moving average crossing below a longer-term average is used to illustrate that the asset's price has been moving downward at a faster rate and that it may be a good time to sell.
Moving Average Crossovers in reality is Zero Line Crossovers, the value of the MACD indicator is equal to zero each time the two moving averages cross over each other. For easy interpretation by trades, Zero Line Crossovers are simply described as positive or negative MACD
False signals
Like any forecasting algorithm, the MACD can generate false signals. A false positive, for example, would be a bullish crossover followed by a sudden decline in a financial instrument. A false negative would be a situation where there is bearish crossover, yet the financial instrument accelerated suddenly upwards
What is “MACD-X” and Why it is “More Than MACD”
In its simples form, MACD-X implements variety of different calculation techniques applied to obtain MACD Line, ability to use of variety of different sources , including Volume related sources, and can be plotted along with MACD in the same window and all those features are available and presented within a single indicator, MACD-X
Different calculation techniques lead to different values for MACD Line, as will further discuss below, and as a consequence the signal line and the histogram values will differentiate accordingly. Mathematical calculation of both signal line and the histogram remain the same.
Main features of MACD-X ;
1- Introduces different proven techniques applied on MACD calculation , such as MACD-Histogram, MACD-Leader and MACD-Source, besides the traditional MACD (MACD-TRADITIONAL)
• MACD-Traditional , by Gerald Appel
It is the MACD that we know, stated as traditional just to avoid confusion with other techniques used with this study
• MACD-Histogram , by Thomas Aspray
The MACD-Histogram measures the distance between MACD and its signal line (the 9-day EMA of MACD). Aspray developed the MACD-Histogram to anticipate signal line crossovers in MACD. Because MACD uses moving averages and moving averages lag price, signal line crossovers can come late and affect the reward-to-risk ratio of a trade. Bullish or bearish divergences in the MACD-Histogram can alert chartists to an imminent signal line crossover in MACD
The MACD-Histogram represents the difference between MACD and its 9-day EMA, the signal line. Mathematically,
macdx = macd - ma(macd, signal_length)
Aspray's contribution served as a way to anticipate (and therefore cut down on lag) possible MACD crossovers which are a fundamental part of the indicator.
Here come a question, what if repeat the same calculations once more (macdh2 = macdh - ma(macdh, signal_length), will it be even better, this question will remain to be tested
• MACD-Leader , by Giorgos E. Siligardos, PhD
MACD Leader has the ability to lead MACD at critical situations. Almost all smoothing methods encounter in technical analysis are based on a relative-weighted sum of past prices, and the Leader is no exception. The concealed weights of MACD Leader are such that more relative weight is used in the more recent prices than the respective weights used by the components of MACD. In effect, the Leader expresses more changes in average price dynamics for the recent price movement than MACD, thus eventually leading MACD, especially when significant trend changes are about to take place.
Siligardos creates two less-laggard moving averages indicators in its formula using the same periods as follows
Indicator1 = ma(source, fast_length) + ma(source - ma(source, fast_length), fast_length)
Indicator2 = ma(source, slow_length) + ma(source - ma(source, slow_length), slow_length)
and then take the difference:
Indicator1 - Indicator2
The result is a new MACD Leader indicator
macdx = macd + ma(source - fast_ma, fast_length) - ma(source - slow_ma, slow_length)
• MACD-Source , a custom experimental interpretation of mine ,
MACD Source, presents an application of MACD that evaluates Source/MA Ratio, relatively with less lag, as a basis for MACD Line, also can be expressed as source convergence/divergence to its moving average. Among the various techniques for removing the lag between price and moving average (MA) of the price, one in particular stands out: the addition to the moving average of a portion of the difference between the price and MA. MACD Source, is based on signal length mean of the difference between Source and average value of shot length and long length moving average of the source (Source/MA Ratio), where the source is actual value and hence no lag and relatively less lag with the average value of moving average of the source . Mathematically expressed as,
macdx = ma(source - avg( ma(source, fast_length), ma(source, slow_length) ), signal_length)
MACD Source provides relatively early crossovers comparing to MACD and better momentum direction indications, assuming the lengths are set to same values
For further details, you are invited to check the following two studies, where the first seeds were sown of the MACD-Source idea
Price Distance to its Moving Averages study, adapts the idea of “Prices high above the moving average (MA) or low below it are likely to be remedied in the future by a reverse price movement", presented in an article by Denis Alajbeg, Zoran Bubas and Dina Vasic published in International Journal of Economics, Commerce and Management
First MACD like interpretation comes with the second study named as “ P-MACD ”, where P stands for price, P-MACD study attempts to display relationship between Price and its 20 and 200-period moving average. Calculations with P-MACD were based on price distance (convergence/divergence) to its 200-period moving average, and moving average convergence/divergence of 20-period moving average to 200-period moving average of price.
Now as explained above, MACD Source is a one adapted with traditional MACD, where Source stands for Price, Volume Indicator etc, any source applicable with MACD concept
2- Allows usage of variety of different sources, including Volume related indicators
The most common usage of Source for MACD calculation is close value of the financial instruments price. As an experimental approach, this study will allow source to be selected as one of the following series;
• Current Close Price (close)
• Average of High, Low, and Close Price (hlc3)
• On Balance Volume (obv)
• Accumulation Distribution (accdist)
• Price Volume Trend (pvt)
Where,
-Current Close Price and Average of High, Low, and Close Price are price actions of the financial instrument
- Accumulation Distribution is a volume based indicator designed to measure underlying supply and demand
- On Balance Volume (OBV) , is a momentum indicator that measures positive and negative volume flow
- Price Volume Trend (PVT) is a momentum based indicator used to measure money flow
3- Can be plotted along with MACD in the same window using the same scaling
Default setting of MACD-X will display MACD-Source with Current Close Price as a source and traditional MACD can be plotted eighter as a companion of MACD-X or can be selected to be plotted alone.
Applying both will add ability to compare, or use as a confirmation of one other
In case, traditional MACD Is plotted along with MACD-X to avoid misinterpreting, the lines plotted, the area between MACD-X Line and Signal-X Line is highlighted automatically, even if the highlight option not selected. Otherwise highlight will be applied only if that option selected
4- 4C Histogram
Histogram is plotted with four colors to emphasize the momentum and direction
5- Customizable
Additional to ability of selecting Calculation Method, Source, plotting along with MACD, there are few other option that allows users to customize the MACD-X indicator
Lengths are configurable, default values are set as 12, 26, 9 respectively for fast, slow and smoothing length. Setting lengths to 8,21,5 respectively Is worth checking, slower length moving averages will lead to less lag and earlier reaction to price actions but yet requires a caution and back testing before applying
Highlight the area between MACD-X Line and Signal-X Line, with colors emphasising the direction
Label can be added to display Calculation Method, Source and Length settings, the aim of this label is to server only as a reminder to trades to be aware of settings while they are occupied with charts, analysis etc.
Here comes another question, which is of more importance having the reminder or having the indicators with multi timeframe feature? Build-in Multi Time Frame features of Pine is not supported when labels and lines introduced in the script, there are other methods but brings complexity. To be studied further, this version will be with labels for time being.
Epilogue
MACD-X is an alternative variant of MACD, the insight/signals provided by MACD are also applicable to MACD-X with early and clear warnings for the changes in the trend.
If MACD is essential to your analysis, then it is my guess that after using the MACD-X for a while and familiarizing yourself with its unique character and personality, you will make it an inseparable companion to other indicators in your charts.
The various signals generated by MACD/MACD-X are easily interpreted and very few indicators in technical analysis have proved to be more reliable than the MACD, and this relatively simple indicator can quickly be incorporated into any short-term trading strategy
Disclaimer : Trading success is all about following your trading strategy and the indicators should fit within your trading strategy, and not to be traded upon solely
The script is for informational and educational purposes only. Use of the script does not constitutes professional and/or financial advice. You alone the sole responsibility of evaluating the script output and risks associated with the use of the script. In exchange for using the script, you agree not to hold dgtrd TradingView user liable for any possible claim for damages arising from any decision you make based on use of the script

Relative Strength of Volume Indicators by DGTThe Relative Strength Index (RSI) , developed by J. Welles Wilder, is a momentum oscillator that measures the speed and change of price movements.
• Traditionally the RSI is considered overbought when above 70 and may be primed for a trend reversal or corrective pullback in price, and oversold or undervalued condition when below 30. During strong trends, the RSI may remain in overbought or oversold for extended periods.
• Signals can be generated by looking for divergences and failure swings. If underlying prices make a new high or low that isn't confirmed by the RSI, this divergence can signal a price reversal. If the RSI makes a lower high and then follows with a downside move below a previous low, a Top Swing Failure has occurred. If the RSI makes a higher low and then follows with an upside move above a previous high, a Bottom Swing Failure has occurred
• RSI can also be used to identify the general trend. In an uptrend or bull market, the RSI tends to remain in the 40 to 90 range with the 40-50 zone acting as support. During a downtrend or bear market the RSI tends to stay between the 10 to 60 range with the 50-60 zone acting as resistance
This study aim to implement Relative Strength concept on most common Volume indicators, such as
• Accumulation Distribution is a volume based indicator designed to measure underlying supply and demand
• Elder's Force Index (EFI) measures the power behind a price movement using price and volume
• Money Flow Index (MFI) measures buying and selling pressure through analyzing both price and volume (used as it is)
• On Balance Volume (OBV) , created by Joe Granville, is a momentum indicator that measures positive and negative volume flow
• Price Volume Trend (PVT) is a momentum based indicator used to measure money flow
Plotting will be performed for regular RSI and RSI of Volume indicator (RSI(VOLX)) selected from the dialog box, where the possibility to apply smoothing is provided as option. Additionally, labels can be added optionally to display the value and name of selected volume indicator
Secondly, ability to present Volume Histogram within the same study along with its Moving Average or Volume Oscillator based on selection
Finally, Volume Based Colored Bars , a study of Kıvanç Özbilgiç is added to emphasis volume changes on top of the bars
Nothing excessively new, the study combines RSI with;
- RSI concept applied to some of the common Volume indicators presented with a highlighted over/under valued threshold area, optional labeling and smoothing,
- added Volume data with additional information and
- colored bars based on volume
Thanks @Vishant_Meshram for the inspiration 🙏
Disclaimer:
Trading success is all about following your trading strategy and the indicators should fit within your trading strategy, and not to be traded upon solely
The script is for informational and educational purposes only. Use of the script does not constitute professional and/or financial advice. You alone have the sole responsibility of evaluating the script output and risks associated with the use of the script. In exchange for using the script, you agree not to hold dgtrd TradingView user liable for any possible claim for damages arising from any decision you make based on use of the script

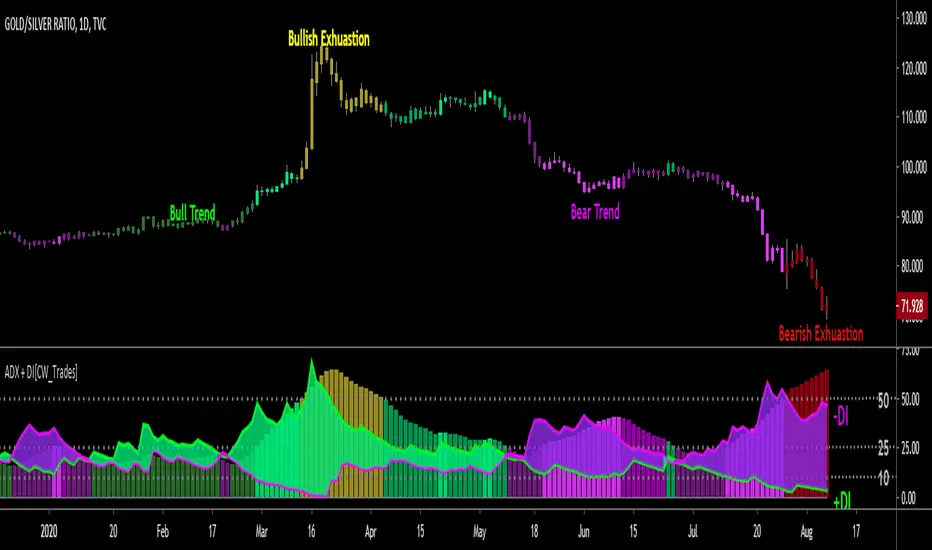
ADX + DI w/ Colored Candles [CW_Trades]The Average Directional Index (ADX) is a technical analysis indicator used to determine price trend and price strength by comparing current price to recent price history. The price trend can be either up or down(bullish/bearish), and this is shown by two accompanying indicators, the Negative Directional Indicator (-DI, purple line) and the Positive Directional Indicator (+DI, green line) which compare price highs to price lows on a 14-period lookback. The strength of the trend is shown by the histogram in the background and also utilizes a 14-period lookback in its calculation.
When the +DI is trending above the -DI it indicates a short-term bullish trend in price. If the histogram is rising while the +DI is above the -DI it indicates strength in the bullish trend. If the histogram is declining while the +DI is above the -DI it indicates weakness in the bullish trend.
When the -DI is trending above the +DI it indicates a short-term bullish trend in price. If the histogram is rising while the -DI is above the +DI it indicates strength in the bearish trend. If the histogram is declining while the -DI is above the +DI it indicates weakness in the bearish trend.
When the +DI is above the -DI the histogram will be colored shades of green. When the -DI is above the +DI the histogram will be colored shades of purple.
The ADX has 3 key levels to watch, and they are 10, 25 and 50.
-When the ADX histogram bars are below 10 it indicates no identifiable strength in the price trend, or neutral. The histogram bars will be colored gray when the ADX is below 10.
-When the ADX histogram bars are between 10 and 25 it indicates a weak trend in price. The histogram bars will be shades of dark green or dark purple when in this zone.
-When the ADX histogram bars are above 25 and below 50 it indicates a strong trend in price. The histogram bars will be shades of medium green/purple or bright green/purple when the ADX is between 25
and 50. Bright green or bright purple indicate that the current histogram bar is higher than the preceding histogram bar, medium shades of either green or purple indicate that the current histogram bar is
lower than the preceding histogram bar. The brighter the shade of green or purple, the stronger the trend.
-When the ADX histogram bars are above 50 it indicates potential trend exhaustion. When the +DI is above the -DI and the ADX is above 50 the histogram will be colored yellow which indicates a potential
end of the bull trend. When the -DI is above the +DI and the histogram bars are above 50 the histogram will be colored red which indicates a potential end of the bearish trend.
Elliott Wave Oscillator Signals by DGTElliott Wave Principle , developed by Ralph Nelson Elliott, proposes that the seemingly chaotic behaviour of the different financial markets isn’t actually chaotic. In fact the markets moves in predictable, repetitive cycles or waves and can be measured and forecast using Fibonacci numbers. These waves are a result of influence on investors from outside sources primarily the current psychology of the masses at that given time. Elliott wave predicts that the prices of the a traded currency pair will evolve in waves: five impulsive waves and three corrective waves. Impulsive waves give the main direction of the market expansion and the corrective waves are in the opposite direction (corrective wave occurrences and combination corrective wave occurrences are much higher comparing to impulsive waves)
The Elliott Wave Oscillator (EWO) helps identifying where you are in the 5-3 Elliott Waves, mainly the highest/lowest values of the oscillator might indicate a potential bullish/bearish Wave 3. Mathematically expressed, EWO is the difference between a 5-period and 35-period moving average based on the close. In this study instead 35-period, Fibonacci number 34 is implemented for the slow moving average and formula becomes ewo = ema(source, 5) - ema(source, 34)
The application of the Elliott Wave theory in real time trading gets difficult because the charts look messy. This study (EWO-S) simplifies the visualization of EWO and plots labels on probable reversals/corrections. The good part is that all plotting’s are performed on the top of the price chart including a histogram (optional and supported on higher timeframes). Additionally optional Keltner Channels Cloud added to help confirming the price actions.
What to look for:
Plotted labels can be used to follow the Elliott Wave occurrences and most importantly they can be considered as signals for possible trade setup opportunities. Elliott Wave Rules and Fibonacci Retracement/Extensions are suggested to confirm the patters provided by the EWO-S
Trading success is all about following your trading strategy and the indicators should fit within your trading strategy, and not to be traded upon solely
Disclaimer : The script is for informational and educational purposes only. Use of the script does not constitutes professional and/or financial advice. You alone the sole responsibility of evaluating the script output and risks associated with the use of the script. In exchange for using the script, you agree not to hold dgtrd TradingView user liable for any possible claim for damages arising from any decision you make based on use of the script

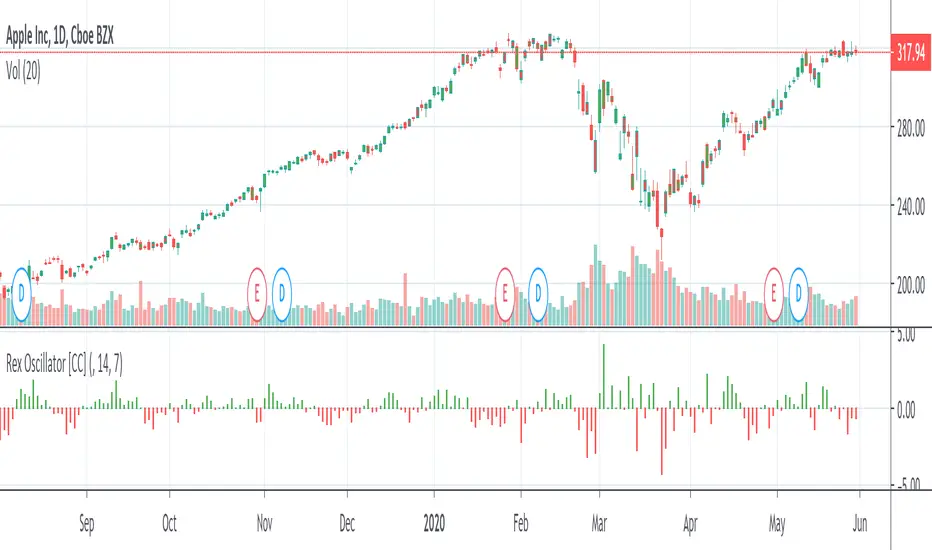
Rex Oscillator [CC]The Rex Oscillator measures market behavior based on the relationship of the close to the open, high and low values of the same bar. A big difference between the high and close on a bar indicates weakness, and wide disparity between the low and close indicates strength. The difference between open and close also indicates market performance. Buy when the indicator is green and sell when it turns red.
Let me know if you would like me to publish other scripts or if you want something custom done!
Statistical Histogram with configurable bins and Data WindowCreates a Histogram for Statistical Analysis of any source.
Input Parameters:
Sample Source: Select your source here, can be any numerical source.
Sample Period: Sample size for Mean and Standard Deviation Calculations.
Enable Cumulative Mode: Will attempt to calculate the bin for every sample in the entire dataset.
Window Period: Used only in Window Mode (Enable Cumulative Mode unchecked), Calculates the bin for the past Window Period sample size.
Bin Label Spacing: Adjust horizontal spacing of Bin Labels below the histogram for easier viewing.
Center Bin: Selects the center Bin, usually set to (0 - Bin Width) < Sample <= 0 standard deviations or (z_score)
Bin Width: Selects the Bin Width in standard deviations.
How you can use it:
View characteristics of dataset such as unimodal/bimodal and skewness to determine preferred statistical analysis.
Additional Reference:
en.wikipedia.org
en.wikipedia.org
Credits:
Thanks goes out to www.tradingview.com , for cleaning up some of the code and www.tradingview.com for the original idea.
Usage Tips:
When adjusting the bin parameters, center bin and bin width, verify that the total sum of the bins (Sum Frequency in the Data Window) is close to the Total Samples. If your Sum Frequency is drastically lower it means you need to adjust your center bin and/or bin width to capture more of the data available.

DELTA7 HistogramDELTA7 Histogram is placement of the DELTA7 core functionality script into a centered oscilator show up 3-layered waves.
(this is not a signal bot. It's meant for analysis as toolkit for DELTA7 Suit traders)
Each wave are the reperesentation of the DELTA7 on-chart overlay trends plotted into a centered oscilator.
The Delta Lead is ploted as the baseline and the difference between Delta Lead, Delta-Price and Price Average from each wave.
This indicator will allow the trader/analyst to make observations around how extended are the trends against each other as well as serving as basis for divergence and trendline studies plotted manually by the analyst. The oscilator turn green/red (default color-scheme) as observable the main chart overlay.
This offer a horizontal plotted view of the same on-chart DELTA7 trends while making divergences or hyperbolic rallies more evident.
It also has the same DELTA7 scoring ploted into the baseline that match the default settings on DELTA7 ot alternatively user chan check in options for one of the available 7 scorings.
Furthermore, script has 7 available color-scheme themes (4 for dark background and 3 for light backgrounds)
DELTA7:
DELTA7 RSI :
This script is optional and meant to be used in combo with DELTA7 Suit main scripts.
Traders interested in this suit need to get in touch via DM or contact provided in signture.

Chonky MA HistogramChoose MA settings:
- time frame (1M, 5M, 30M, 1H, 4H, D, W, etc.)
- MA lengths
- source of the averages (candle closes, opens, high/low, etc.)
- type of MA (SMA, EMA, etc.)
Plots moving averages + histogram to show difference between the MAs

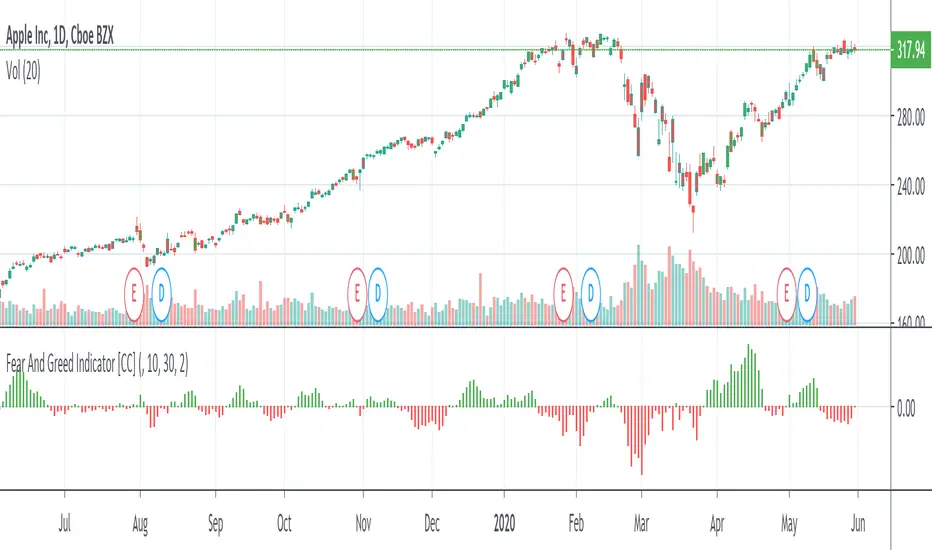
Fear And Greed IndicatorThe Fear And Greed Indicator is a very popular indicator on the Bloomberg platform and since I didn't have actual source code to work with, this is a very close approximation of that indicator. Let me know if you spot any discrepancies with the original and I will do my best to fix them.
For buy and sell signals it is pretty straightforward. Just buy when the green (greed) is in control and sell when the fear (red) is in control
This was a special request so let me know if you want to see more scripts from me or if you want something custom!