DashBoard Alt Season by KziHere is a Dashboard to have an overview of the Alt Season oportunity.
Multiple time frame (Month / Week / Daily /4H)
How to use it?
You have 4 columns
TOTAL Crypto / Btc dominance / Btc Price / Alt ?
The alt? column is the resulte of the price and dominance of btc + 1 point with the total crypto
BTC Dominance UP ? Yes = Négatif for ALTS
/// Btc Price UP ?= > Yes = Positif for ALTS
NO = super négatif for ALTS
No = Positif for ALTS
/// Btc Price UP ?= > Yes = super Positif for ALTS
NO = Neutral
The total market just smooth the total.
If Alt columm is Green= It's OK
If Alt columm is orange = carrefull
If Alt Columm is red = leave the alt
You have to considered that you look on the time frame where you want to trade.
The overtime frame help to understand the bigger view.
Hop you like it and give comment to help the évolutions.
Dashboard

Multi-Timeframe (MTF) Dashboard by RiTzMulti-Timeframe Dashboard
Shows values of different Indiactors on Multiple-Timeframes for the selected script/symbol
VWAP : if LTP is trading above VWAP then Bullish else if LTP is trading below VWAP then Bearish.
ST(21,1) : if LTP is trading above Supertrend (21,1) then Bullish , else if LTP is trading below Supertrend (21,1) then Bearish.
ST(14,2) : if LTP is trading above Supertrend (14,2) then Bullish , else if LTP is trading below Supertrend (14,2) then Bearish.
ST(10,3) : if LTP is trading above Supertrend (10,3) then Bullish , else if LTP is trading below Supertrend (10,3) then Bearish.
RSI(14) : Shows value of RSI (14) for the current timeframe.
ADX : if ADX is > 75 and DI+ > DI- then "Bullish ++".
if ADX is < 75 but >50 and DI+ > DI- then "Bullish +".
if ADX is < 50 but > 25 and DI+ > DI- then "Bullish".
if ADX is above 75 and DI- > DI+ then "Bearish ++".
if ADX is < 75 but > 50 and DI- > DI+ then "Bearish+".
if ADX is < 50 but > 25 and DI- > DI+ then "Bearish".
if ADX is < 25 then "Neutral".
MACD : if MACD line is above Signal Line then "Bullish", else if MACD line is below Signal Line then "Bearish".
PH-PL : "< PH > PL" means LTP is trading between Previous Timeframes High(PH) & Previous Timeframes Low(PL) which indicates Rangebound-ness.
"> PH" means LTP is trading above Previous Timeframes High(PH) which indicates Bullish-ness.
"< PL" means LTP is trading below Previous Timeframes Low(PL) which indicates Bearish-ness.
Alligator : If Lips > Teeth > Jaw then Bullish.
If Lips < Teeth < Jaw then Bearish.
If Lips > Teeth and Teeth < Jaw then Neutral/Sleeping.
If Lips < Teeth and Teeth > Jaw then Neutral/Sleeping.
Settings :
Style settings :-
Dashboard Location: Location of the dashboard on the chart
Dashboard Size: Size of the dashboard on the chart
Bullish Cell Color: Select the color of cell whose value is showing Bullish-ness.
Bearish Cell Color: Select the color of cell whose value is showing Bearish-ness.
Neutral Cell Color: Select the color of cell whose value is showing Rangebound-ness.
Cell Transparency: Select Transparency of cell.
Column Settings :-
You can select which Indicators values should be displayed/hidden.
Timeframe Settings :-
You can select which timeframes values should be displayed/hidden.
Note :- I'm not a pro Developer/Coder , so if there are any mistakes or any suggestions for improvements in the code then do let me know!
Note :- Use in Live market , might show wrong values for timeframes other than current timeframe in closed market!!

Nifty / Banknifty Dashboard by RiTzNifty / Banknifty Dashboard :
Shows Values of different Indicators on current Timeframe for the selected Index & it's main constituents according to weightage in index.
customized for Nifty & Banknifty (You can customize it according to your needs for the markets/indexes you trade in)
Interpretation :-
VWAP : if LTP is trading above VWAP then Bullish else if LTP is trading below VWAP then Bearish.
ST(21,1) : if LTP is trading above Supertrend (21,1) then Bullish , else if LTP is trading below Supertrend (21,1) then Bearish.
ST(14,2) : if LTP is trading above Supertrend (14,2) then Bullish , else if LTP is trading below Supertrend (14,2) then Bearish.
ST(10,3) : if LTP is trading above Supertrend (10,3) then Bullish , else if LTP is trading below Supertrend (10,3) then Bearish.
RSI(14) : Shows value of RSI (14) for the current timeframe.
ADX : if ADX is > 75 and DI+ > DI- then "Bullish ++".
if ADX is < 75 but >50 and DI+ > DI- then "Bullish +".
if ADX is < 50 but > 25 and DI+ > DI- then "Bullish".
if ADX is above 75 and DI- > DI+ then "Bearish ++".
if ADX is < 75 but > 50 and DI- > DI+ then "Bearish+".
if ADX is < 50 but > 25 and DI- > DI+ then "Bearish".
if ADX is < 25 then "Neutral".
MACD : if MACD line is above Signal Line then "Bullish", else if MACD line is below Signal Line then "Bearish".
PDH-PDL : "< PDH > PDL" means LTP is trading between Previous Days High(PDH) & Previous Days Low(PDL) which indicates Rangebound-ness.
"> PDH" means LTP is trading above Previous Days High(PDH) which indicates Bullish-ness.
"< PDL" means LTP is trading below Previous Days Low(PDL) which indicates Bearish-ness.
Alligator : If Lips > Teeth > Jaw then Bullish.
If Lips < Teeth < Jaw then Bearish.
If Lips > Teeth and Teeth < Jaw then Neutral/Sleeping.
If Lips < Teeth and Teeth > Jaw then Neutral/Sleeping.
Settings :
Style settings :-
Dashboard Location: Location of the dashboard on the chart
Dashboard Size: Size of the dashboard on the chart
Bullish Cell Color: Select the color of cell whose value is showing Bullish-ness.
Bearish Cell Color: Select the color of cell whose value is showing Bearish-ness.
Neutral Cell Color: Select the color of cell whose value is showing Rangebound-ness.
Cell Transparency: Select Transparency of cell.
Columns Settings :-
You can select which Indicators values should be displayed/hidden.
Rows Settings :-
You can select which Stocks/Symbols values should be displayed/hidden.
Symbol Settings :-
Here you can select the Index & Stocks/Symbols
Dashboard for Index : select Nifty/Banknifty
if you select Nifty then Nifty spot, Nifty current Futures and the stocks with most weightage in Nifty index will be displayed on the Dashboard/Table.
if you select Banknifty then Banknifty spot, Banknifty current Futures and the stocks with most weightage in Banknifty index will be displayed on the Dashboard/Table.
You can Customise it according to your needs, you can choose any Symbols you want to use.
Note :- This is inspired from "RankDelta" by AsitPati and "Nifty and Bank Nifty Dashboard v2" by cvsk123 (Both these scripts are closed source!)
I'm not a pro Developer/Coder , so if there are any mistakes or any suggestions for improvements in the code then do let me know!

Seasonal Statistics DashboardFor a given month, this indicator will display historical, seasonal statistics for each individual day of that month.
The indicator release comes with 5 columns and more planned:
1 — Trading Day
2 — Samples
3 — Daily Average Absolute OC Range
4 — Daily Average Absoulte HL Range
5 — Bull / Bear
The Trading Day column will display a 🎯 emoji and highlight the background for the current trading day. This will only display if you're viewing the current month's stats.
Samples is the simplest column of data: it tells you how many times that trading day has been sampled. Some days are sampled rarely, or infrequently. Days in the future will always be 1 sample short of days that have passed.
Both 3 and 4 fall into the same category: Daily Average Absolute Range calculates the difference between the open and the close, or high and low, of a specified trading day through history; each difference is then made absolute (non-negative), and then the average is taken of all those differences together. This gives the average historical range a particular trading day has.
Using an example: A larger average with open to close data can be interpreted as that day having stronger directional characteristics. In contrast, a larger historical average using high to low for a given day can be interpreted as that day experiencing more volatility than other days historically on a seasonal basis.
Bull / Bear counts the number of times a day closed green (bullish) or red (bearish). Then that's used to display some simple odds in 2 ways: as a fraction, or as odds out of 100%. You can hide either of them and only display one too if you have a preference to only see odds as a fraction or out of 100%.
I plan to add more features for increasing legibility on the table and additional columns with new information as time goes on.

_3_Period_Dashboard_A Dashboard to check the current and previous two bar values of some commonly used indicators:
==> RSI
==> ADX
==> DI +
==> DI -
==> MACD
==> MACD Signal
==> Stochastic k
==> Stochastic d

FXBABA Zscore DashboardZScore Dashboard by FXBABA
First of all I would like to give credits and thanks to QuantNomad for providing source code for the creation of Dashboards.
This Dashboard allows traders to see the Zscore value of up to 6 different averages (5,10,20,50,100,200) and up to 40 different symbols.
Depending on your screen size you might be able to fit them all on one dashboard, otherwise you can add 2 or 3 dashboards to the screen to different positions, each with 5-10 symbols for ease of viewing or markets categories.
The Zscore can be calculated based on Price, Tick Volume or Volatility.
Color changes are based on 3 type of signals. Whether above or below the Zero line. Whether above or below the Signal line, which is a 3 period moving average of the Zscore line. Whether above or below the Overbought/Oversold Level set at 1.96. A Signal Type, whether Zero/Signal line, must be chosen within the settings.
Within the settings you are able to change pretty much everything to your liking. Colors, length of moving averages, symbols, etc.

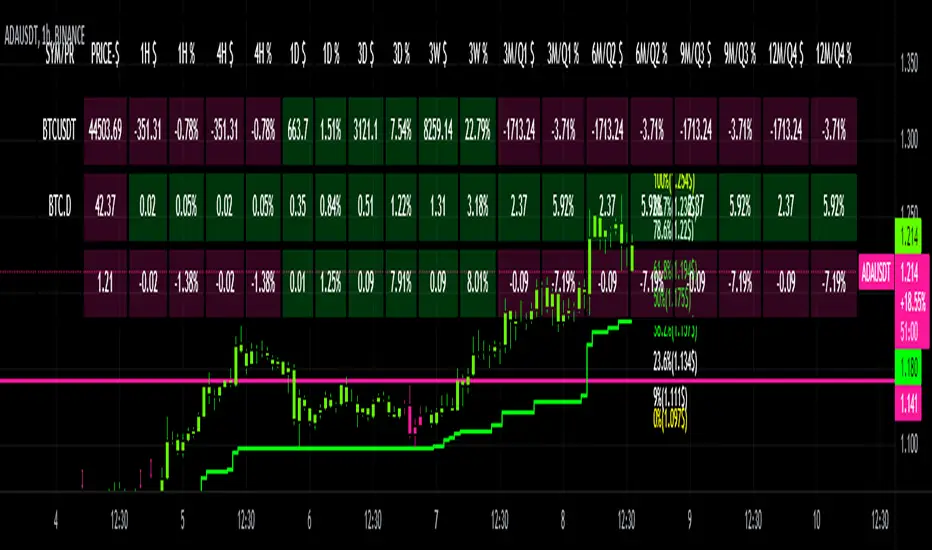
CRYPTO DASHBOARD Gs₿A Simple Crypto Dashboard/Screener which indicates the Price and percentage changes for the Given Period of time i.e for 1 Hr ,4 Hrs, 1 Day, 3 Days, 3 Weeks and 3 - 12 Months. By Default it displays #BTC and its Dominance and current trading pair Price and % changes.
Nifty and Bank Nifty Dashboard V2This shows a performance glance of Dow and major Constituents of NSE:NIFTY or NSE:BANKNIFTY . This is an enhancement to the Bank nifty dashboard published earlier.
Usage
• Customizable Table and Style settings
• Customizable Indicator Settings
• Customizable Time frame of Indicators in Table. Can change to higher or lower TF other than the chart time frame
• Customizable Input symbols. Can modify with the Scripts you want to track.
• The Last row will be the current script viewed in charts.
• Can enable or disable indicators on the chart like ST, SMA, VWAP.
• Strong Volume Indication at bottom based on the average volume inputs for Nifty, Bank Nifty and for other stocks volume > 20 ma(volume)
• Displays bank nifty stocks if Bank nifty is the open chart else it will display top Nifty Stocks.
• This will help to monitor the performance of various scripts.
• Can change the stock list according to usage/Index.
• It will show all the symbols if Additional Symbols is selected.
Buy-Sell Signal
• Volume > Average Volume, it Shows #
• ST – Buy - Price > Super trend (10,2) and vice versa
• SMA – Buy - Price > MA and vice versa
• RSI – Buy – RSI > 50, Sell – RSI < 40
• ADX: Buy - ADX > 25, DMI+ Above DMI - and vice versa
• Previous day High low is not considered for buy or sell score calculation. This is just for additional observation.
• ATR will be highlighted when change > 0.75 of the average true range of daily price.
Strong colours will be shown for respective boxes when some additional conditions satisfy.
Style settings
Dashboard Location: Location of the dashboard on the chart
Dashboard Size: The size of the dashboard on the chart
Text/Frame Color: Determines the colour of the frame grid as well as the text colour
Bullish Cell Color: Determines the colour of cell associated with a rising indicator direction
Bearish Cell Color: Determines the colour of cell associated with a decreasing indicator direction
Cell Transparency: Transparency of each cell

MTF WatchList Charts [Anan]█ OVERVIEW
I am happy to present this script with a nice idea!
You can now customize a watchlist with your preferred time frame and any symbol from any market.
The main purpose is to be aware of any moves and watch a brief overview of the chart.
█ FEATURES
- 8 customizable symbols with the option to show/hide anyone
- Multi time frame support
- 3 Types of charts (Candles / Heikin Ashi / Line)
- Displaying up to 10 candles for every chart
- Customizable chart colors
- Option to Show/hide Price
- Option to Show/hide Price Line
- Option to change Labels and Text Size
- Show Symbol name and used time frame
- Option to change gaps between charts
- Hover over on the top of any candle to see (Open/High/Low/Close) Prices
█ SCREENSHOTS
-----------------------------------------------
Special thanks to @dgtrd for inspiration and for the amazing framework used here ( HTF Candles by DGT )
Special thanks to Pine Chat @fareidzulkifli @Bjorgum @JohnBaron @fpainchaud

Pivot High/Low Analysis & Forecast [LuxAlgo]Returns pivot points high/low alongside the percentage change between one pivot and the previous one (Δ%) and the distance between the same type of pivots in bars (Δt). The trailing mean for each of these metrics is returned on a dashboard on the chart. The indicator also returns an estimate of the future time position of the pivot points.
This indicator by its very nature is not real-time and is meant for descriptive analysis alongside other components of the script. This is normal behavior for scripts detecting pivots as a part of a system and it is important you are aware the pivot labels are not designed to be traded in real-time themselves
🔶 USAGE
The indicator can provide information helping the user to infer the position of future pivot points. This information is directly used in the indicator to provide such forecasting. Note that each metric is calculated relative to the same type of pivot points.
It is also common for analysts to use pivot points for the construction of various figures, getting the percentage change and distance for each pivot point can allow them to eventually filter out points of non-interest.
🔹 Forecast
We use the trailing mean of the distance between respective pivots to estimate the time position of future pivot points, this can be useful to estimate the location of future tops/bottoms. The time position of the forecasted pivot is given by a vertical dashed line on the chart.
We can see a successful application of this method below:
Above we see the forecasted pivots for BTCUSD15. The forecast of interest being the pivot high. We highlight the forecast position with a blue dotted line for reference.
After some time we obtain a new pivot high with a new forecast. However, we can see that the time location of this new pivot high matches perfectly with the prior forecast.
The position in time for the forecast is given by:
x1_ph + E
x1_pl + E
where x1_ph denotes the position in time of the most recent pivot high. x1_pl denotes the position in time of the most recent pivot low and E the average distance between respective pivot points.
🔶 SETTINGS
Length: Window size for the detection of pivot points.
Show Forecasted Pivots: Display forecast of future pivot points.
🔹 Dashboard
Dashboard Location: Location of the dashboard on the chart
Dashboard Size: Size of the dashboard on the chart
Text/Frame Color: Determines the color of the frame grid as well as the text color

Bank Nifty DashboardThis shows a performance glance of Dow, India Vix and Major Constituents of Bank Nifty. Which will help to take quick decision.
Style settings
Normalized Change Mode: Allows the user to access a different interpretation of the indicator by showing the normalized first differences of each indicator in the dashboard instead of their sign
Dashboard Location: Location of the dashboard on the chart
Dashboard Size: Size of the dashboard on the chart
Text/Frame Color: Determines the color of the frame grid as well as the text color
Bullish Cell Color: Determines the color of cell associated with a rising indicator direction
Bearish Cell Color: Determines the color of cell associated with a decreasing indicator direction
Cell Transparency: Transparency of each cell
Usage
This will help to monitor the banks Performance on various time frames . You can change the stock list according to your usage/Index.
All showing in green indication strong momentum.

Normalized Oscillators Spider Chart [LuxAlgo]This indicator displays a spider chart overlaid on the user’s current chart allowing the visualization of information given by various normalized oscillators. It is possible to customize the spider chart by hiding certain oscillators from within the settings which removes their corresponding spokes from the chart.
Users can control the length settings of each oscillator individually or use a global length setting that applies to every oscillator. An additional meter element is displayed and aims to give the overall sentiment returned by the oscillators. This can also be used to gauge whether the market is trending or ranging.
This is a relatively simple application of a spider chart but can prove to be useful to some users.
1. Settings
RSI: Displays the Relative Strength Index spoke on the spider chart, includes the length setting on the right of the toggle.
%K: Displays the Stochastic Oscillator "%K" spoke on the spider chart, includes the length setting on the right of the toggle.
COR: Displays the Correlation Oscillator spoke on the spider chart, includes the length setting on the right of the toggle.
MFI: Displays the Money Flow Index oscillator spoke on the spider chart, includes the length setting on the right of the toggle.
WPR: Displays the Williams Percent Rank oscillator spoke on the spider chart, includes the length setting on the right of the toggle.
%UP: Displays the percentage of upward variations spoke on the spider chart, includes the length setting on the right of the toggle.
CMO: Displays the Chande Momentum Oscillator spoke on the spider chart, includes the length setting on the right of the toggle.
AOS: Displays the Aroon oscillator spoke on the spider chart, includes the length setting on the right of the toggle.
Global Oscillators Length: Determines whether all oscillators should use the same length settings, determined by the setting on the right of the toggle.
1.1 Style Settings
Spider Chart Length: Determines the horizontal width of the spider chart.
Spider Chart Offset: Offset between the most recent bar and the left extremity of the spider chart.
2. Usage
A spider chart can be a very useful visualization tool when it comes to seeing the individual characteristics of various variables at the same time.
Here, the tool can give a general sentiment on the direction of the trend without adding each indicator to your chart. It is also possible to determine when an oscillator is considered overbought or oversold with this indicator.
The dashed line represents the central value for each oscillator.
Disabling any of the oscillators from the settings will return a spider chart using fewer spokes.
The script also displays a meter that can be used to determine the overall sentiment given by all oscillators. This metric is based on the average value between each oscillator. An overall sentiment closer to 50 would indicate a ranging market.

Tolueno StrategyTolueno Strategy is a help tool for the average trader of tradingview. This tool facilitates the interpretation of entries either long or short.
The use of magic trend has been implemented, in addition to different types of ema and fully configurable signals.
Soon the use of more sophisticated support and resist will be added to be used for inputs and outputs. RR will be improved too.
The tool has alerts
The tool has a dashboard that shows current signal (LONG / SHORT), shows a recommended take profit (not mandatory), recommended stop loss (not mandatory) and the profit that the current operation is achieving, all this to help the trader and his emotions do not harm him.
The tool is constantly updated and will be gradually improved over time with feedback from tradingview users.
Any questions ask in the comment box or by pm.
This indicator is not for sale, it is not a commercial publication.

MechaOscillatorWhat is MechaOscillator?
MechaOscillator was created as a companion to our main script MechaAlgo. Using MechaOscillator along with MechaAlgo will allow you to boost your overall understanding of any market, and make more informed decisions as a trader.
Feature List
Built-In Improved WaveTrend Oscillator
Buy & Sell Signals
Bullish and Bearish Divergences
Short and Long Term Trend Indicators
Trend Strength Indicator
Market State Indicator
Real Time Informational Dashboard
Bullish and Bearish Breakout Indicator
Many More Features to Come!
By using this script you acknowledge that MechaOscillator cannot guarantee you profit, and that this product was only created in attempt to benefit traders. You also acknowledge that past performance is not indicative of future results, and that the experience of other users or what you see online may not always be your experience.

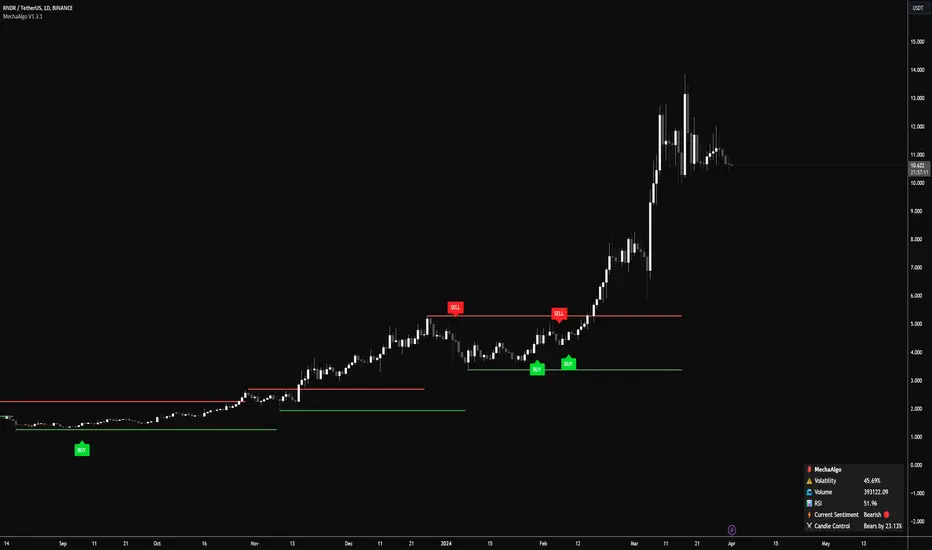
MechaAlgoWhat is MechaAlgo?
MechaAlgo was created to assist any type of trader on a day to day basis. Our intelligent and accurate algorithms turn complex charts into profitable plays, minimizing losses and maximizing profits. We hope that you will find use in the tools and resources we provide, and we will continue to improve on our products in order to take your trading to new heights!
Any Time, Any Market
Our indicators work with real time data on any market. This means that any kind of trader will find our tools useful, regardless of what you are trading.
Feature List
Multiple Signal Modes
Numerous Candle Coloring Modes
Reversal Cloud Overlay
Auto Support & Resistance
Auto Trendlines
Auto Profit Targets
Real Time Informational Dashboard
Multi-Timeframe Trend Panel
Future Trend Projection
Many More Features to Come!
By using this script you acknowledge that MechaAlgo cannot guarantee you profit, and that this product was only created in attempt to benefit traders. You also acknowledge that past performance is not indicative of future results, and that the experience of other users or what you see online may not always be your experience.
Earnings DashboardThe Earnings Dashboard Indicator is a fast way to check the most recent quarterly earnings growth on TradingView.
Colors
The colors should help you get an easy overview of the quarters that are particularly outstanding.
- Earnings /Sales Growth & Surprise >= 20% -> Green
- Earnings /Sales Growth & Surprise <= -20% -> Red
- Net Margin < 5% -> Red
- Net Margin >15% -> Green
Indicator Configuration
- Not available at the moment. Feel free to leave us a comment on TradingView with your idea and we will see what we can do.
Planned Future Update
- Extension with annual (FY) financial data
Happy Trading 📈😎
Important : All data is retrieved using the variables provided by TradingView.

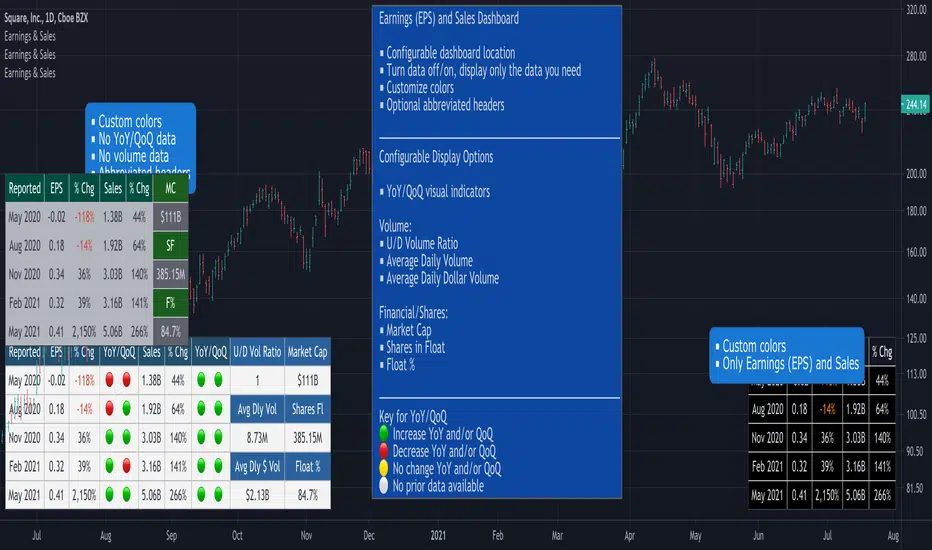
Earnings, Sales & Volume Dashboard [LevelUp]View quarterly earnings per share (EPS) and sales data. Optional visual icons can be shown comparing data on a Year-over-Year (YoY) and/or Quarter-on-Quarter (QoQ) basis.
YoY: quarterly earnings/sales compared to the value in the same quarter of the previous year.
QoQ: quarterly earnings/sales compared to the value of the previous quarter.
Earnings Calculation - Basic EPS vs Diluted
This indicator uses basic EPS data to calculate earnings. For relatively new issues (IPOs, etc), some platforms/tools may use diluted EPS data as a means to account for outstanding stock options, convertible preferred shares, etc. In this scenario, you will notice differences in the earnings information.
Features
■ View quarterly earnings per share (EPS) and sales data.
■ Configure colors for dashboard header and rows.
■ Change location of dashboard.
■ Choose which charts display the dashboard (daily, weekly or monthly).
Pro Tip: Show the dashboard on top of other chart elements:
- Right click on the indicator
- Select 'Visual Order'
- Select 'Bring to Front'
Directional Matrix [LuxAlgo]Returns a dashboard showing the direction taken by 4 overlay indicators, SMA (simple moving average), TMA (triangular moving average), WMA (weighted moving average), and REG (linear regression), all using different length periods.
The user can select the minimum and maximum length of these indicators and introduce an increment.
1. Settings
Maximum Length: The end value of sequences of the indicator periods to analyze
Minimum Length: The starting value of sequences of the indicator periods to analyze
Step: Determines the spacing between each indicator periods values
Src: Data source for each of the 4 indicators
1.1 Style settings
Normalized Change Mode: Allows the user to access a different interpretation of the indicator by showing the normalized first differences of each indicator in the dashboard instead of their sign
Dashboard Location: Location of the dashboard on the chart
Dashboard Size: Size of the dashboard on the chart
Text/Frame Color: Determines the color of the frame grid as well as the text color
Bullish Cell Color: Determines the color of cell associated with a rising indicator direction
Bearish Cell Color: Determines the color of cell associated with a decreasing indicator direction
Cell Transparency: Transparency of each cell
2. Usage
Each of the indicators included in the dashboard aim to give an estimate of the underlying trend in the price. Knowing which direction they are taking can help us have a broader view regarding the direction of shorter/longer-term trends. We will later see that this is not the only kind of information that we can get from this indicator.
Rising indicators are represented by blue cells (or the color selected in the Bullish Cell Color setting) while decreasing indicators are represented by red cells (or the color selected in the Bearish Cell Color setting).
The percentage of bullish cells is given in the top-left cell of the dashboard.
2.1 Normalized change mode
Enabling the Normalized Change mode will display the normalized changes returned by the indicators over different length periods. This metric is within a range (0,1), with 1 indicating the highest change over the selected length periods, while 0 indicates the lowest one.
When enabling this mode the color of the cells makes use of a gradient with a color palette ranging from the color selected in the Bearish Cell setting to the color selected in the Bullish Cell setting.
2.1 Other Usage
The direction taken by certain indicators can give more information than one would think. Indeed, the sign of the change of one indicator can often be given by different indicators.
A positive change in a simple moving average indicates that the price is greater than the price p bars ago, where p is the period of the simple moving average.
A positive change in a triangular moving average indicates that a simple moving average of period p is above a simple moving average of period p × 2 , where p is the period of the triangular moving average (note that we assume here that the TMA is given by cascading two SMAs of period p ).
A positive change in a weighted moving average indicates that the price is above a simple moving average of period p+1 , where p is the period of the WMA.
Finally, a positive change in a linear regression indicates that a weighted moving average is above a simple moving average of period p , where p is the period of the linear regression.

MA+ ROC MTF DashboardThis is a Multi Timeframe moving average ROC (percent of change) dashboard.
This dashboard shows percent of change of current price to a moving averages on different time frames.
Most left value in the dashboard always represents your chart time frame, while the next 3 represent other time frames which you can set in 'MA+ ROC' settings.
Support User Defined time frames or automatic time frames based on a multiplier value.
Better define same or higher time frames than your chart time frame to get accurate results.
Can work in conjunction with MA+ to display the moving average line, click here:
Like if you Like and follow-up for up coming new indicators: www.tradingview.com

Pivot ProbabilitiesThis indicator gives traders historical probabilities based on how often price closed between any two pivot points.
What are the features? (as of release)
Get the historical statistics of how often price closed between any two pivot points.
Manually set your own pivot point resolution to any higher timeframe. So get the historical statistics from any pivot point you'd like.
Why would someone use this?
Reversion: We can more clearly see between which pivots price has highest probability of mean reversion towards.
Risk Management: By adding the statistics between groups of pivots, we can have a better idea of what the normal trading range for pivot points on any given asset should be. Making it easier to identify which pivot points are more likely to have extreme price movements go past.
Could you add an option to show probabilities for "x" style of pivot points?
I plan on adding more types of pivot points in the future. Check out if there are any updates to this indicator that include the pivots you're looking for. Otherwise, tell me what you're looking for in the comments here.
Why don't I see any pivot points on my chart when I apply this indicator?
This indicator does not draw pivot points on your chart. It strictly draws probabilities. So feel free to use it in combination with your favorite one.

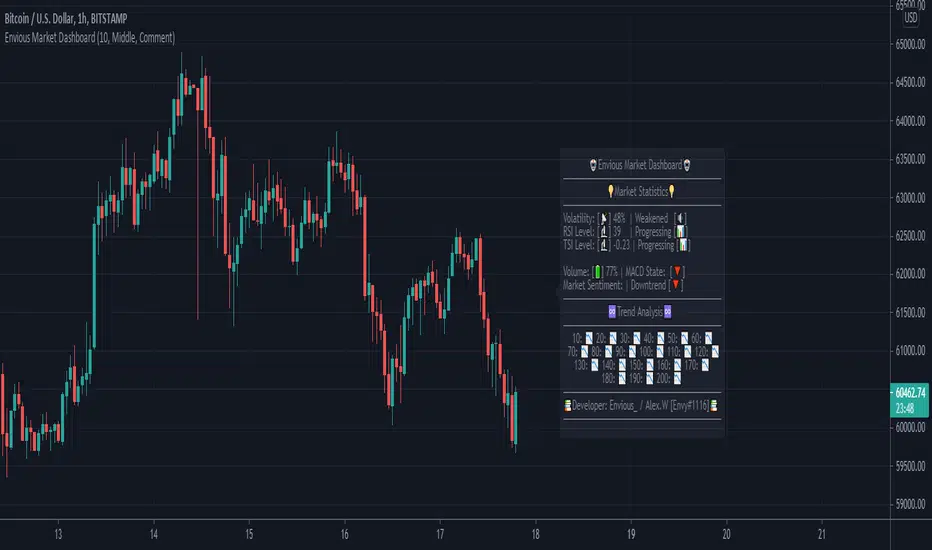
Envious Market DashboardHey traders, this is a market dashboard that can be useful to have on top of your charts. It provides information of the trends discovered, the volatility, the current MACD Trend, the current trend, RSI level, RSI Overbought / Oversold state, TSI level, TSI Overbought / Oversold state, the volume percentage, and more. You can customise the dashboard location, the colour of the dashboard, the background of the dashboard and its background colour. Hope this is useful to you traders :).
TV Community AlgoTV Community Algo is a free TradingView script that I designed from the ground to benefit the traders of this community. It has plenty of features that you will enjoy, and I have included documentation for how to use this below!
Settings:
Basic:
Turn the Void Lines on or off
Turn the Dashboard on or off
Turn the Signal Bars on or off
Turn the Support & Resistance Lines on or off
Turn the EMA 8 and EMA 200 on or off
Turn the Buy & Sell Signals on or off
Turn the Fibonacci Retracement Tool on or off
Style:
Change the Dashboard's distance from the price action
Change the Dashboard's Color and Transparency
Change the Dashboard Text Color
Change the Fibonacci Deviation
Make the Fibonacci Retracement Tool reverse
Make the Fibonacci Lines extend left, right, both directions, or none
Turn Fibonacci Prices on or off
Turn Fibonacci Levels on or off and change between percent or value
Change Fibonacci Label Position from the left or the right
Usage:
This algo has many uses including but not limited to:
Finding entries and exits using the EMA 8 and EMA 200 crossovers
Using the Void Lines to identify bounces or reversals
Using the Signal Bars to identify trend and confirmation for entries and exits
Using the Dashboard information for confirmation and informational purposes
In the images below, I give a few examples of the many uses of the TV Community Algo!
VOID LINES
The Void Lines are very helpful when it comes to identifying reversals.
TV COMMUNITY ALGO DASHBOARD
The Dashboard is filled with useful information that all traders can benefit from!
SIGNAL BARS
The colored candles known as Signal Bars inform you of when the price action is above or below the midpoint of the Void Lines.
AUTO SUPPORT & RESISTANCE LINES
These lines help traders find accurate levels of support & resistance on all time frames, and the lines change color depending on if the price is above or below them.
EMA 8 AND 200
The EMA 8 and EMA 200 crossovers can be used as entry and exit signals.
BUY & SELL SIGNALS
The BUY & SELL signals can be used to find optimal entries and exits for trades on any time frame. Smaller time frames are best for scalping, while larger time frames are more suited for longer trades. When combined with the EMA lines and Dashboard information, these signals can produce incredibly profitable trades.
AUTO FIBONACCI RETRACEMENT TOOL
The Auto Fibonacci Retracement Tool allows you to plot perfect Fib Lines every time.
Conclusion:
I truly hope that the TV Community Algo benefits the TradingView community and that you all find some value in it. I worked very hard on this product and I would love to see it put to good use.
with love,
-Lemon 🍋
This work is licensed under a Attribution-NonCommercial-ShareAlike 4.0 International (CC BY-NC-SA 4.0) creativecommons.org

Multi-timeframe Dashboard for RSI And Stochastic RSI Dashboard to check multi-timeframe RSI and Stochastic RSI on 4h, 8h, 12h, D and W
Great side tool to assist on the best time to buy and sell and asset.
Shows a green arrow on a good buy moment, and a red when to sell, for all timeframes. In case there are confluence on more than one, you have the info that you need.
Uses a formula with a weight of 5 for RSI and 2 for Stochastic RSI, resulting on a factor used to set up a color for each of the timeframes.
Legend per each timeframe:
- Blue: Excellent buy, RSI and Stoch RSI are low
- Green: Great buy, RSI and Stoch RSI with a quite positive entry point
- White: Good buy
- Yellow: A possible sell, depending on combination of timeframes. Not recommended for a buy
- Orange: Good sell, depending on combination of timeframes
- Red: If on more than one timeframe, especially higher ones, it is a good time to sell
For reference (But do your own research):
- Blue on Weekly: Might represent several weeks of growth. Lower timeframes will cycle from blue to red, while daily and Weekly gradually change
- Blue on Daily: Might represent 7-15 days of growth, depending on general resistance and how strongly is the weekly
PS: Check the RSI, Stochastic RSI and other indicators directly as well
