双重指数移动均线(DEMA)

Multi-Filter Momentum Candle Strategy (Non-Repaint)Momentum Candle Precision Scanner is a price action–based indicator designed to detect high-quality momentum candles after consolidation phases.
It combines candle structure analysis, volume confirmation, ATR control, consolidation filtering, and higher timeframe EMA trend alignment to reduce false signals.
⚠️ This indicator is NOT standalone and MUST be used together with an external RSI indicator.
RSI is intentionally not included in the script to allow traders full flexibility in choosing their preferred RSI settings.
🎯 Purpose
This indicator helps traders:
Identify valid impulsive candles, not just large candles
Avoid entries during sideways or consolidation zones
Trade in alignment with the higher timeframe trend
Improve entry selectivity through a scoring-based validation system
⚙️ Core Logic Explained
1️⃣ Momentum Candle Structure
Candle body must fall within a predefined pip range
Minimum body-to-range ratio is required
Upper and lower wick percentages are strictly limited
This helps filter out candles caused by noise or fake breakouts.
2️⃣ Volume Confirmation
Current volume must be above its moving average
Ensures momentum is supported by market participation
3️⃣ ATR-Based Control
Candle body size is capped using ATR
Prevents signals during abnormal volatility spikes (e.g., news events)
4️⃣ Consolidation Filter (Box & Core Zone)
A dynamic price box is built from recent candles
Signals are ignored inside the core consolidation zone
Focuses entries on breakout or expansion phases
5️⃣ Scoring System
Each candle is evaluated using a weighted score:
Candle body quality
Wick structure
Volume strength
ATR validity
Position relative to consolidation
Signals are triggered only when the minimum score threshold is met.
📈 Trend Filtering (EMA HTF & Current TF)
Higher Timeframe EMA defines the main trend direction
Current Timeframe EMA reflects local momentum
Options available:
Trade with HTF trend only
Or allow counter-trend signals (user controlled)
🚨 Alert Feature
Alerts can trigger minutes before candle close
Designed for traders who wait for near-close confirmation
⚠️ IMPORTANT – RSI IS REQUIRED
This indicator does NOT include RSI internally.
📌 You must add an external RSI indicator and use it as:
Additional momentum confirmation
Overbought / oversold filter
Trend strength validation
👉 General RSI usage example:
Buy setups → RSI above 50 and strengthening
Sell setups → RSI below 50 and weakening
(Users are free to adapt RSI settings to their own strategy.)
🛠️ Recommended Usage
Best suited for M5
Optimized for XAUUSD
Can be adapted to other instruments by adjusting pip size
📌 Disclaimer
This indicator is a technical analysis tool, not a trading system.
No guarantees of profitability. Always apply proper risk management, RSI confirmation, and personal backtesting before live trading.

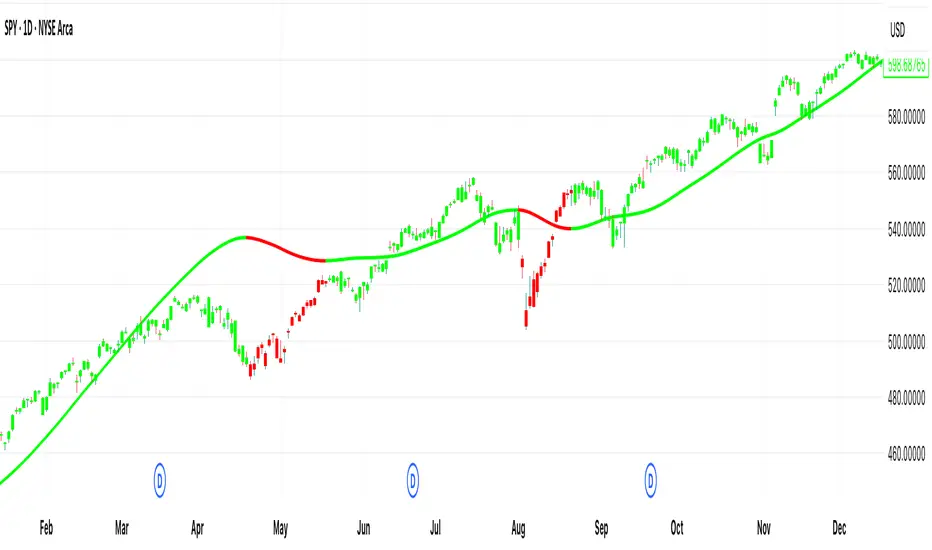
Big Trend Catcher: Dual-Gate EMA & ATR Trailing Swing TraderThe Big Trend Catcher: Long-Only Progressive Swing System
OVERVIEW
The Big Trend Catcher is a high-conviction, long-only swing trading strategy designed to identify and ride sustained market moves. Unlike traditional trend-following systems that often get "chopped out" during sideways consolidation, this strategy utilizes a Dual-Gate Filter to ensure you only enter when short-term momentum and the long-term trend are in total alignment.
It is specifically tuned for high-growth stocks and ETFs where capturing the lion’s share of a multi-week or multi-month move is the primary objective.
CORE LOGIC: THE DUAL-GATE SYSTEM
To maintain a high quality of entries, the strategy requires a "confirmed launch" through two distinct filters:
The Momentum Gate (20 EMA): Identifies immediate price acceleration and volume-backed impulse.
The Long-Term Gate (100 EMA): Acts as the ultimate trend filter. The script utilizes a "Signal Memory" logic—if an impulse happens while price is still below the 100 EMA, the trade is held in a "Pending" state. The entry only triggers once the price closes firmly above the 100 EMA.
Goal: This prevents "bottom fishing" in established downtrends and keeps you in cash during sideways "death loops" when the long-term direction is unclear.
KEY FEATURES
1. Progressive Pyramiding (Scale-In)
The biggest profits in swing trading are often made by adding to winners. This system features two automated scale-in triggers:
Velocity Adds (VOLC): Adds to the position if the stock is up >10% and moving with rising momentum, allowing you to build a larger position as the trend proves its strength.
Pullback Adds: Adds to the position when the price tests the 20 EMA and holds, allowing you to buy the "dip" within a healthy uptrend.
2. The Phoenix Re-Entry
This logic is designed to catch "V-shaped" recoveries. If the strategy exits on a trend break but the price aggressively reclaims the 20 EMA on massive volume shortly after, it re-enters the trade. This ensures you aren't left behind during the second leg of a major run after a temporary shakeout.
3. Iron-Floor ATR Exit
We use a 3.5x ATR Trailing Stop combined with the 100 EMA. This wider-than-average "breathing room" is designed to keep you in for significant gains while ignoring the minor daily volatility that often shakes out traders with tighter stops.
HOW TO USE
Best Timeframes: Daily (D) is recommended for identifying major cycles, but it can be applied to the 4-Hour (4H) for more active swing trading.
Settings:
* 20 EMA: Your short-term momentum guide.
* 100 EMA: Your long-term trend guide.
* ATR Multiplier: Set to 3.5 for maximum "trend hugging."
SUMMARY OF VISUALS
Blue Line (100 EMA): The Long-Term Trend.
Yellow Line (20 EMA): The Short-Term Momentum.
Red Stepped Line: Your ATR Trailing Floor (The "Iron Floor").
Lime Triangle: Initial Trade Entry.
Blue/Orange Shapes: Progressive Scale-in points.

HaP MACDHaP MACD - Advanced DEMA Assisted Signal Indicator
Overview
The HaP MACD is an evolution of the classic MACD, designed for traders who demand faster response times and clearer trend visualisations. By integrating DEMA (Double Exponential Moving Average) logic into the standard MACD framework, this indicator filters out noise and highlights momentum shifts with a unique color-coded dot system.
How It Works
The indicator calculates two types of MACD: a standard one for the main lines and a DEMA-based one for signal generation. This dual approach ensures you stay in the trend while being alerted the moment the momentum starts to fade.
Visual Guide & Color Logic
The signal dots are placed directly on the MACD line to guide your decisions:
🔵 Blue Dot: The Entry Signal. Appears when DEMA conditions first align for a bullish move.
🟢 Green Dot: Strong Momentum. The trend is active and the MACD value is increasing.
🟠 Orange Dot: Warning Signal. The bullish trend is still active, but the momentum is slowing down (MACD is lower than the previous bar).
🔴 Red Dot: Exit Signal. The bullish condition has ended. It’s time to consider closing the position or tightening stops.
Key Features
Reduced Lag: DEMA integration provides earlier signals than standard EMA-based MACDs.
Trend Monitoring: Easily distinguish between a healthy trend (Green) and a tiring trend (Orange).
Customizable: Choose between EMA and SMA for both the oscillator and signal calculations.
Crossover Markers: Optional triangle markers for classic MACD crossovers (can be enabled in settings).

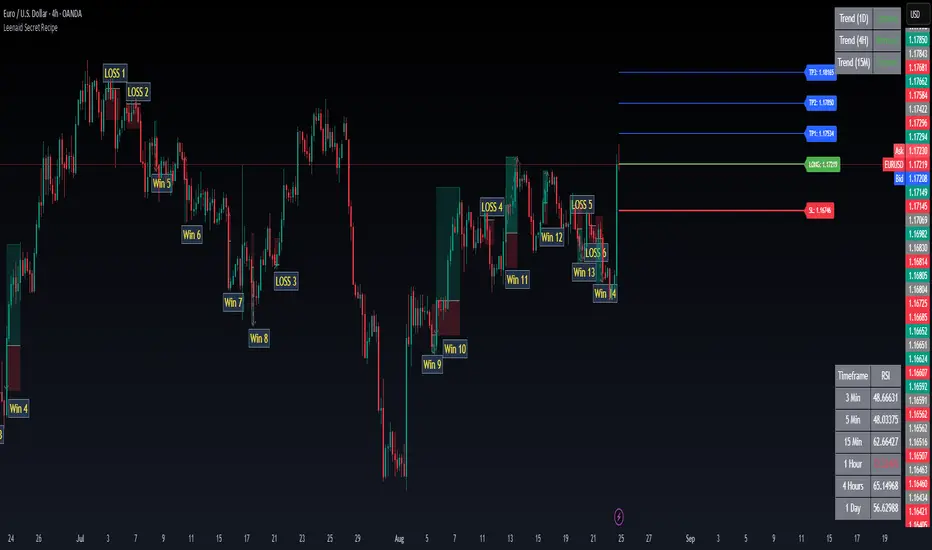
Sultan Weekly Level Manager XAUUSDThis script is a comprehensive "Level Management Utility" designed to help traders efficiently map, monitor, and react to their weekly Support and Resistance plans.
Instead of manually drawing rectangles and lines every week, this tool allows traders to input their specific price levels (Buy Zones, Sell Zones, and Invalidation Levels) into the settings. The script then automatically renders these zones, sets up alert conditions, and provides essential technical context (Trend and Momentum) in a single workspace.
Why this is a "Manager" (Use Case): Many traders execute "Level-to-Level" plans. This script streamlines that workflow by:
Visual Automation: Instantly drawing standardized zones based on user inputs.
Context Integration: Unlike simple drawing tools, this script integrates EMA Trend Filters (50/200 EMA) and RSI Momentum monitoring directly alongside the manual levels. This allows the trader to see if a price level is being approached with high momentum (RSI Overbought/Oversold) or against the major trend (EMA Cross), reducing the risk of blind limit orders.
Dashboard: A mini-dashboard tracks the current status (e.g., "Inside Buy Zone 1") so traders can assess the state of their plan at a glance.
How to Use:
Step 1: Open the settings and input your weekly Buy/Sell zone coordinates (High and Low prices). Note: The default values are placeholders; you must update them based on your analysis.
Step 2: Use the Trend Context (EMAs) to decide if you are trading with the flow or against it.
Step 3: Use the Momentum Context (RSI) to wait for overbought/oversold conditions before entering a zone.
Features:
Customizable Zones: 2 Buy Zones, 1 Sell Zone, 1 Invalidation Line.
Confluence Tools: Integrated 50/200 EMA and RSI readout.
Alerts: Built-in alert conditions trigger when price enters any of your defined zones.
Credits:
EMA and RSI logic are based on standard open-source library calculations.
Zone plotting logic utilizes standard Pine Script drawing functions.

Brahmastra Basic1. Core Purpose and Strategy
This is a multi-timeframe (MTF) indicator designed to identify high-probability entry points for a specific trend-following options selling strategy. It works by confirming a trend on higher timeframes (Daily and Hourly) before waiting for a precise entry trigger on a lower timeframe (15-Minute).
The core principle is confluence: ensuring that the Daily trend bias and the Hourly trend momentum are aligned before looking for a trade. This filters out many false signals that can occur when trading on a single timeframe.
IMPORTANT: This indicator MUST be applied to a 15-minute chart to function correctly.
2. How to Read the Visual Signals on Your Chart
The indicator provides several visual cues to guide you through the trading setup from start to finish.
A. Candle Colors: The "Setup is Ready" Signal
The primary signal to start paying attention is the change in candle color.
Aqua Candles: The market is in a Bullish Alignment. This means both the Daily and Hourly trends are bullish. You should now be preparing for a Put Sell entry. The very first aqua candle in a sequence is your "alert candle."
Yellow Candles: The market is in a Bearish Alignment. This means both the Daily and Hourly trends are bearish. You should now be preparing for a Call Sell entry. The very first yellow candle in a sequence is your "alert candle."
B. Entry Signals: The "Execute Trade" Signal
These signals appear only after the alert candle's level has been breached.
Green "PUT SELL" Label (below candle): This is your signal to enter a Put Sell (or a long position). It appears on the close of the 15-minute candle that breaks above the high of the first aqua alert candle.
Red "CALL SELL" Label (above candle): This is your signal to enter a Call Sell (or a short position). It appears on the close of the 15-minute candle that breaks below the low of the first yellow alert candle.
C. Exit Signals: The "Close Position" Signal
Red 'X' (above candle): This is the signal to close your Put Sell position. It appears when the primary daily trend has reversed to bearish.
Green 'X' (below candle): This is the signal to close your Call Sell position. It appears when the primary daily trend has reversed to bullish.
D. Background & EMA Lines: The "Context"
EMA Lines: The indicator plots two key EMAs from the higher timeframes onto your 15-minute chart so you can see the context.
Orange Line: Daily 5 EMA
Blue Line: Hourly 51 EMA
Faint Background Color: After an entry signal appears, the background will remain faintly colored (green for a bullish trade, red for a bearish trade) to remind you that you are in a hypothetical position.
3. The Step-by-Step Strategy Logic
Here is the precise set of rules the indicator follows to generate its signals:
For a PUT Sell (Bullish Trade):
Alignment Check: The indicator first confirms that:
The Daily Close is above the Daily 5 EMA.
AND the Hourly Close is above the Hourly 51 EMA.
Alert Phase: As soon as this alignment is true, the 15-minute candles turn aqua. The indicator internally notes the high of the very first aqua candle.
Entry Trigger: The indicator waits for a 15-minute candle to close above the high of that first alert candle. When this happens, the green "PUT SELL" label is plotted.
Exit Condition: The position is held until the Daily Close crosses back below the Daily 5 EMA. When this happens, the red 'X' exit signal is plotted.
For a CALL Sell (Bearish Trade):
Alignment Check: The indicator first confirms that:
The Daily Close is below the Daily 5 EMA.
AND the Hourly Close is below the Hourly 51 EMA.
Alert Phase: As soon as this alignment is true, the 15-minute candles turn yellow. The indicator internally notes the low of the very first yellow candle.
Entry Trigger: The indicator waits for a 15-minute candle to close below the low of that first alert candle. When this happens, the red "CALL SELL" label is plotted.
Exit Condition: The position is held until the Daily Close crosses back above the Daily 5 EMA. When this happens, the green 'X' exit signal is plotted.

Aydan Scalper v2This indicator, called the Aydan Scalper, combines an 8-period EMA (plotted in green) and a 20-period EMA (plotted in red) to identify buy and sell signals based on their crossovers. When the green 8 EMA crosses above the red 20 EMA from below, it signals a buy opportunity. Conversely, when the green 8 EMA crosses below the red 20 EMA from above, it signals a sell opportunity. Additionally, an ATR (Average True Range) indicator is included to gauge market volatility. This combination helps scalpers make informed trading decisions on a one-minute chart.”

Aydan Scalper 2This indicator, called the Aydan Scalper, combines an 8-period EMA (plotted in green) and a 20-period EMA (plotted in red) to identify buy and sell signals based on their crossovers. When the green 8 EMA crosses above the red 20 EMA from below, it signals a buy opportunity. Conversely, when the green 8 EMA crosses below the red 20 EMA from above, it signals a sell opportunity. Additionally, an ATR (Average True Range) indicator is included to gauge market volatility. This combination helps scalpers make informed trading decisions on a one-minute chart.”
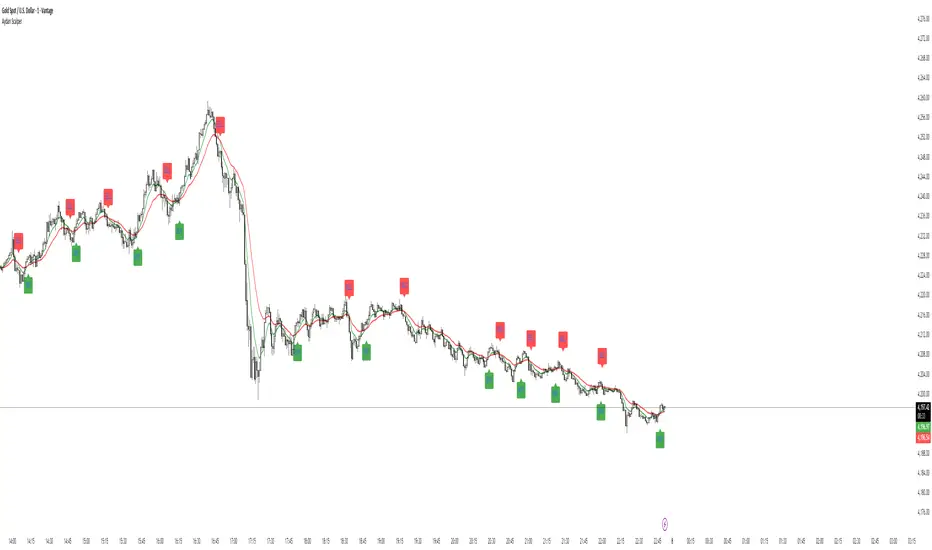
Aydan ScalperBy when EMA 8 cross EMA 21 from Below to Abouve and SELL when EMA 21 cross EMA 8 from Abouve to Belove


Dynamic Momentum OscillatorDescription:
The Dynamic Momentum Oscillator is a statistically-driven momentum tool that goes beyond traditional oscillators. Instead of using raw price, it analyzes the momentum of a DEMA (Double Exponential Moving Average) itself, creating a smoother, more refined signal. Its innovative approach incorporates volatility-weighted z-scoring, allowing the indicator to automatically adjust its sensitivity based on market conditions, helping to identify both the strength and sustainability of momentum shifts.
🔍 How It Works:
DEMA Momentum Core: The indicator first calculates a DEMA of the price. It then analyzes the momentum of this DEMA, effectively creating a "momentum of momentum" measure that filters out market noise.
Volatility-Adaptive Z-Score: The core signal is a statistical z-score, which measures how many standard deviations the DEMA is from its mean. This tells you not just the direction, but the statistical significance of the move.
Dynamic Volatility Weighting: The unique addition is a normalized standard deviation component that weights the z-score. In high volatility periods, this amplifies the signal, making strong trends more pronounced. In low volatility, it provides a more muted, conservative output.
🎯 Interpreting the Oscillator:
Zero Line: The baseline. Momentum is considered neutral here.
Orange Histogram (Above Zero): Indicates bullish momentum. The further the bar extends above zero, the stronger and more statistically significant the bullish momentum.
Purple Histogram (Below Zero): Indicates bearish momentum. The further the bar extends below zero, the stronger and more statistically significant the bearish momentum.
Signal Strength: The height of the histogram bars reflects the combined momentum and volatility, giving you a direct visual gauge of momentum strength.
⚙️ Input Parameters (Group: Core Settings):
DEMA Length: The period for the primary Double Exponential Moving Average.
Standard Deviation Length: The lookback period for calculating volatility and the z-score.
StDev Weight: Controls the influence of volatility on the final signal (0.1 = minimal, 1.0 = maximum). Adjust this to fine-tune the indicator's responsiveness.
By focusing on the statistical properties of price momentum, the Dynamic Momentum Oscillator offers a unique lens for pinpointing high-probability trend continuations and reversals. It's a powerful tool for traders who appreciate quantitative methods.

Trendz EMA VersionSupertrend + double EMA Indicator that calls out high quality trade ideas. This is the Logic:
✅ Buy only when SuperTrend turns bullish and 21 EMA > 50 EMA.
✅ Sell only when SuperTrend turns bearish and 21 EMA < 50 EMA.

Robust Scaled Dema | OquantOverview
The Robust Scaled DEMA indicator is a tool designed for traders seeking to identify potential trend directions in financial markets. It combines the smoothing capabilities of a Double Exponential Moving Average (DEMA) with a robust scaling mechanism to normalize the data, making it more resilient to outliers and extreme price movements. This scaling helps in generating long and short signals based on predefined thresholds, visualized through color-coded plots and bars. The indicator aims to provide a balanced view of market momentum, reducing the impact of noise while highlighting significant shifts in price behavior.
Key Factors/Components
DEMA (Double Exponential Moving Average): Serves as the core smoothing component, reducing lag compared to simple averages by emphasizing recent price action more effectively.
Robust Scaling Mechanism: Utilizes statistical measures like median and interquartile range to normalize the DEMA values, ensuring the indicator is less sensitive to extreme values or price spikes.
Thresholds: User-defined upper and lower levels that trigger long or short signals when the scaled DEMA crosses them.
Visual Elements: Includes plotted lines for the scaled DEMA and thresholds, plus color-coded candlestick bars for intuitive interpretation.
Alerts: Built-in conditions for notifying users of potential entry points for long or short positions.
How It Works
The indicator starts by applying a DEMA to the chosen price source to create a smoothed representation of the market's direction. This smoothed value is then scaled using a robust statistical approach that accounts for the distribution of recent DEMA values, centering it around a median and adjusting for variability to minimize the influence of outliers. The resulting scaled metric is compared against user-set upper and lower thresholds: crossing above the upper suggests a bullish momentum (long signal), while dipping below the lower indicates bearish conditions (short signal). A state variable tracks these conditions to color the chart accordingly, helping traders visualize regime changes. Optional alerts fire on transitions.
For Who Is Best/Recommended Use Cases
This indicator is ideal for traders who employ trend-following or momentum-based strategies and need tools that perform well in non-normal market conditions, such as during high volatility or in assets prone to spikes. Use cases include identifying entry/exit points in trending environments, confirming breakouts, or integrating into multi-indicator systems for added confirmation. Quantitative traders or those backtesting strategies will appreciate its customizable parameters for optimization.
Settings and Default Settings
Source: The price data input for calculations, such as close, open, high, or low. Default: close.
DEMA Length: Controls the period for the DEMA smoothing; shorter values increase responsiveness but may add noise, longer ones provide more lag but smoother signals. Default: 25.
Robust Scaling Length: Defines the lookback period for the scaling statistics; affects how adaptive the normalization is to recent data distributions. Default: 40.
Upper Threshold: The level above which a long signal is triggered; higher values make signals rarer but potentially more reliable. Default: 0.5.
Lower Threshold: The level below which a short signal is triggered; lower values allow for more aggressive bearish detection. Default: 0.
Conclusion
The Robust Scaled DEMA offers an outlier-resistant alternative to traditional moving average indicators, empowering traders to navigate volatile markets. By blending exponential smoothing with statistical robustness, it provides actionable insights into trend shifts while minimizing false positives from extreme events..
⚠️ Disclaimer: This indicator is intended for educational and informational purposes only. Trading/investing involves risk, and past performance does not guarantee future results. Always test and evaluate indicators/strategies before applying them in live markets. Use at your own risk.

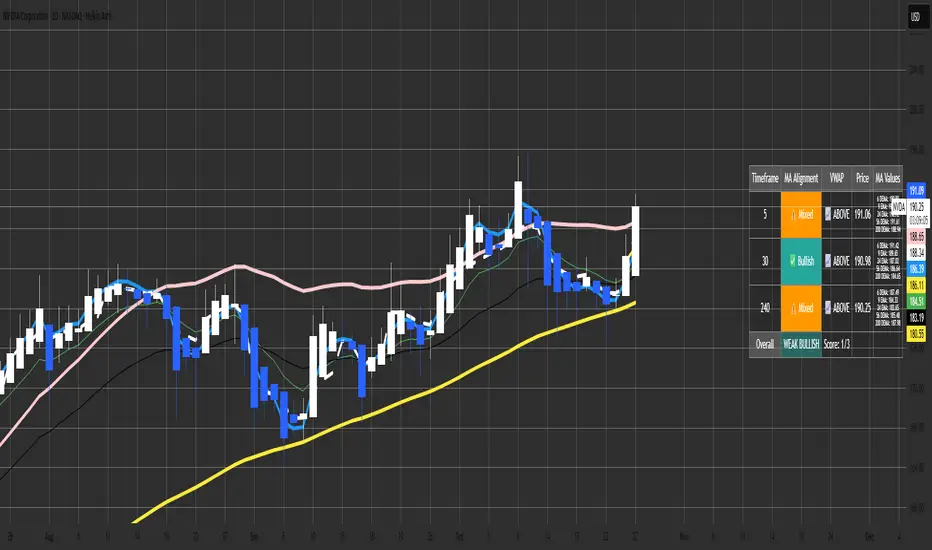
Malama's MTF MA Alignment ScannerMalama's Multi-Timeframe Moving Average Alignment Scanner (MTF MA Scanner) is an overlay indicator designed to simplify trend analysis by evaluating the alignment of multiple moving averages (MAs) across user-defined timeframes. It scans for bullish (MAs stacked ascending), bearish (descending), or mixed/neutral configurations, incorporating a VWAP (Volume Weighted Average Price) filter to contextualize price position relative to volume-based equilibrium. The result is a compact dashboard table summarizing signals from up to three timeframes, helping traders spot confluence for entries or reversals without manually switching charts. This tool draws from classic MA ribbon concepts but adds flexible MA types, dynamic sorting, and an overall trend score for quicker multi-TF insights.
Core Mechanics
The indicator processes data in layers to detect alignment and bias:
Moving Average Calculation: Supports five customizable MAs per timeframe, with types including Simple (SMA), Exponential (EMA), Double Exponential (DEMA for reduced lag), Smoothed (SMMA), or Butterworth 2-Pole filter (a low-lag recursive smoother approximating Ehlers' design for cleaner signals). Defaults use EMAs at lengths 6, 9, 21, 56, and 200—shorter for fast trends, longer for structure. Users enable/disable each independently.
Alignment Detection: For enabled MAs, it dynamically sorts them by length (shortest first) and checks their relative order: All ascending (shortest MA > longest) signals "Bullish" (uptrend strength); all descending signals "Bearish" (downtrend); otherwise "Mixed" or "Neutral" (if <2 MAs). This avoids bias from unsorted plots.
VWAP Integration: Computes session-anchored VWAP (daily/weekly/monthly) as a volume-weighted mean, classifying price as "Above" (bullish bias) or "Below" (bearish) to filter alignments—e.g., bullish MA stack above VWAP strengthens longs.
Multi-Timeframe Aggregation: Pulls MA and VWAP data from up to three timeframes (e.g., current, 5m, 15m) using secure requests without lookahead bias. It consolidates into a table: Per-TF rows show alignment status (with icons: ✅ Bullish, ❌ Bearish, ⚠️ Mixed, ➖ Neutral), VWAP icon/status (📈 Above, 📉 Below), current price, and optional MA values (e.g., "9 EMA: 1.2345").
Overall Summary: Counts bullish/bearish TFs for a net score (e.g., 2/3 bullish = "Weak Bullish"), highlighting confluence in the final row.
This setup emphasizes regime detection: Aligned short-term MAs confirm momentum, while longer ones validate structure, all filtered by VWAP for volume context.
Why This Adds Value & Originality
Standard MA crossovers or ribbons often clutter charts or require manual TF switches, leading to analysis fatigue. Here, the mashup of diverse MA types (e.g., lag-reduced DEMA with smooth Butterworth) into a sortable alignment check creates a "trend thermometer" that's adaptable—e.g., EMAs for responsiveness in forex, SMAs for stocks. The VWAP layer adds a fair-value anchor absent in pure MA tools, while the dashboard condenses MTF data into one glanceable view with a net score, reducing cognitive load. It's not a simple merge: Dynamic UDT-based sorting ensures consistent evaluation regardless of user tweaks, and optional value display aids precise level targeting. This makes it uniquely practical for confluence trading, evolving basic alignment into a scannable system without repainting risks.
How to Use
Setup: Add to your chart (overlay=true). In inputs: Enable TFs (e.g., 1H for structure, 15m/5m for entries); customize MAs (e.g., switch to DEMA for volatile crypto); set VWAP anchor (Daily for intraday). Toggle table position/size and chart plots.
Interpret the Dashboard (top-right default):
Per-TF Rows: Green cells for Bullish (long bias); red for Bearish (short); orange for Mixed (caution); gray for Neutral/low data. Check VWAP for confirmation—e.g., Bullish + Above = strong buy setup.
MA Values Column (if enabled): Lists current levels (e.g., "21 EMA: 4500.50") for support/resistance pulls.
Overall Row: "Strong Bullish" (all green) for aggressive longs; "Weak" variants for scaled entries. Score like "2/3" shows TF agreement.
Trading Application: On a 1H chart, look for 3/3 Bullish with price above VWAP for longs—enter on pullback to shortest MA. Use alerts (e.g., "All Timeframes Bullish") for notifications. Best on liquid assets (e.g., EURUSD, SPX) across 15m-4H. Combine with price action for edges.
Customization Tips: Disable unused MAs to declutter; test Butterworth on noisy data for smoother aligns.
Limitations & Disclaimer
Alignments lag by MA lengths and TF resolutions, so they're directional filters—not precise entries (pair with candlesticks). VWAP resets on anchors, potentially skewing mid-session. In sideways markets, "Mixed" dominates—avoid forcing trades. No built-in risk management; backtest on your symbols (e.g., via Strategy Tester) to validate. Results use historical data without guarantees—markets evolve. Not financial advice; trade at your own risk. For feedback, comment publicly.1.1s
Better DEMAThe Better DEMA is a new tool designed to recreate the classical moving average DEMA, into a smoother, more reliable tool. Combining many methodologies, this script offers users a unique insight into market behavior.
How does it work?
First, to get a smoother signal, we need to calculate the Gaussian filter. A Gaussian filter is a smoothing filter that reduces noise and detail by averaging data with weights following a Gaussian (bell-shaped) curve.
Now that we have the source, we will calculate the following:
n2 = n/2 (half of the user defined length)
a = 2/(1+n)
ns
Now that we have that out of the way, it is time to get into the core.
Now we calculate 2 EMAs:
slow EMA => EMA over n
fast EMA => EMA over n2 period
Rather then now doing this:
DEMA = fast EMA * 2 - slow EMA
I found this to be better:
DEMA = slow EMA * (1-a) + fast EMA * a
As a last touch I took a little something from the HMA, and used a EMA with period of √n to smooth the entire the thing.
The Trend condition at base is the following (but feel free to FAFO with it):
Long = dema > dema yesterday and dema < src
Short = dema < dema yesterday and dema > src
Methodology
While the DEMA is an amazing tool used in many great indicators, it can be far too noisy.
This made me test out many filters, out of which the Gaussian performed best.
Then I tried out the non subtractive approach and that worked too, as it made it smoother.
Compacting on all I learned and smoothing it bit by bit, I think I can say this is worth looking into :).
Use cases:
Following Trends => classic, effective :)
Smoothing sources for other indicators => if done well enough, could be useful :)
Easy trend visualization => Added extra options for that.
Strategy development => Yes
Another good thing is it does not a high lookback period, so it should be better and less overfit.
That is all for today Gs,
Have fun and enjoy!

RED RICHI EMA 34&55This indicator displays two exponential moving averages (EMA 34 & EMA 55) to identify mid-term trend direction.
It also marks crossover points with green and red circles for bullish and bearish trend shifts.

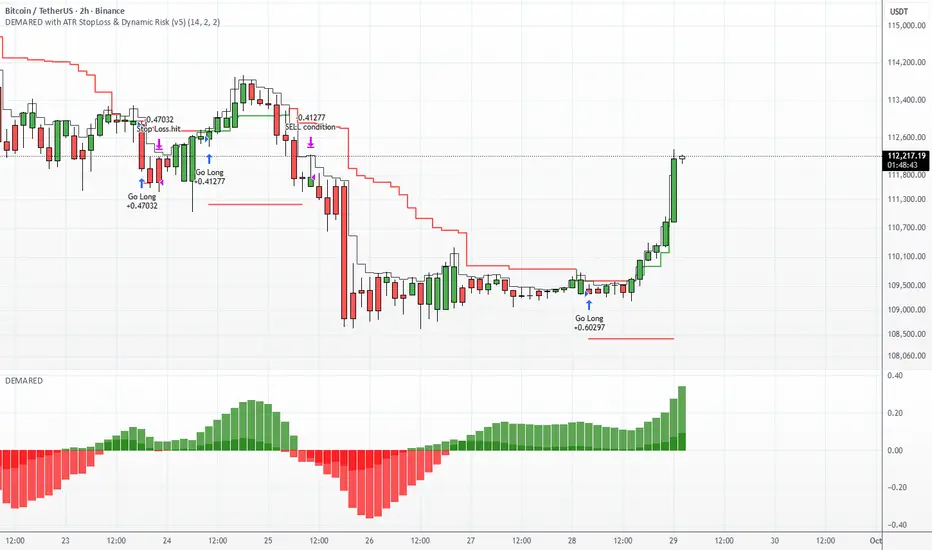
DEMARED with ATR StopLoss & Dynamic Risk (v5)DEMARED with ATR StopLoss & Dynamic Risk
This strategy combines Double Exponential Moving Averages (DEMA) with EMA and Donchian midline filters to capture trend-following signals. A long entry is triggered when both DEMA pairs are aligned bullishly, price is above EMA, and above the Donchian midpoint. Exits occur on opposite signals or when the ATR-based stop loss is hit.
Key features:
ATR Stop Loss: dynamic stop based on ATR with user-defined multiplier.
Dynamic Risk Management: position size is automatically calculated based on account equity and risk percentage.
Visualization: plots stop loss, EMA, Donchian midline, and optional bar coloring.
Flexible Display: toggle all indicator visuals on/off with a single input.
The goal is to provide a trend-following system with controlled risk and adaptability across different markets and timeframes.
[DEM] Double Hull Moving Average (DHMA) Double Hull Moving Average (DHMA) is designed to create an ultra-smooth and responsive trend-following indicator by applying the Hull Moving Average calculation twice to reduce lag while maintaining smoothness. The indicator first calculates a Hull Moving Average of the source price over the specified length (default 233), then applies another Hull Moving Average to the result, and finally uses the standard Hull formula (2 * HMA1 - HMA2) to create the Double Hull Moving Average. The resulting line changes color dynamically from green when trending upward to red when trending downward, with matching bar colors to provide clear visual confirmation of trend direction, offering traders a highly refined moving average that responds quickly to price changes while filtering out most market noise.
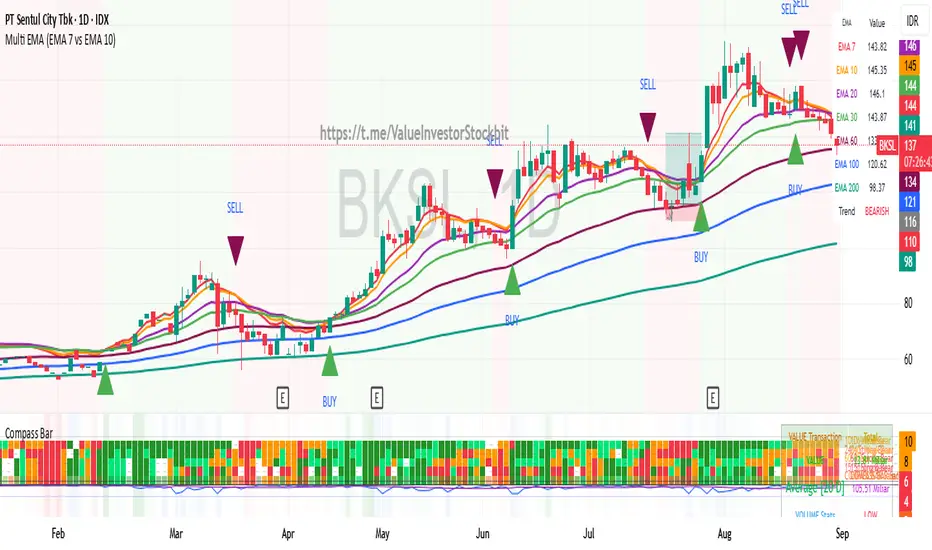
Multi Triple EMA Crossover [Salamun]Multi EMA Crossover Indicator Function:
1. Identifying Trends:
Short EMA (7, 10, 20) for short term trend
Intermediate EMA (30, 60, 100) for intermediate trends
Long EMA (200) for long term trend
The shorter the EMA period, the more sensitive it is to price changes.
2. Providing Entry/Exit Signals:
Green Arrow (BUY) : When fast EMA crosses above slow EMA = bullish momentum
Red Arrow (SELL) : When the fast EMA crosses below the slow EMA = bearish momentum
How to Read Indicators:
✅ Bullish Condition:
Price is above the majority of EMA
The short EMA is above the long EMA
Light green background
A green arrow appears.
❌ Bearish Condition:
Price is below the majority of EMA
The short EMA is below the long EMA
Pink background
A red arrow appears
📊 Tips Trading:
Trend confirmation : Make sure the EMAs are in sequence (EMA7 > EMA10 > EMA20 for uptrend)
Support/Resistance : EMA can function as dynamic support/resistance
Signal filter : Use higher timeframe for confirmation
Risk management : Do not trade against the 200 EMA trend.
The table on the top right displays the real-time values of all EMAs and the current trend status for easy quick analysis.
Script_Algo - High Low Range MA Crossover Strategy🎯 Core Concept
This strategy uses modified moving averages crossover, built on maximum and minimum prices, to determine entry and exit points in the market. A key advantage of this strategy is that it avoids most false signals in trendless conditions, which is characteristic of traditional moving average crossover strategies. This makes it possible to improve the risk/reward ratio and, consequently, the strategy's profitability.
📊 How the Strategy Works
Main Mechanism
The strategy builds 4 moving averages:
Two senior MAs (on high and low) with a longer period
Two junior MAs (on high and low) with a shorter period
Buy signal 🟢: when the junior MA of lows crosses above the senior MA of highs
Sell signal 🔴: when the junior MA of highs crosses below the senior MA of lows
As seen on the chart, it was potentially possible to make 9X on the WIFUSDT cryptocurrency pair in just a year and a half. However, be careful—such results may not necessarily be repeated in the future.
Special Feature
Position closing priority ❗: if an opposite signal arrives while a position is open, the strategy first closes the current position and only then opens a new one
⚙️ Indicator Settings
Available Moving Average Types
EMA - Exponential MA
SMA - Simple MA
SSMA - Smoothed MA
WMA - Weighted MA
VWMA - Volume Weighted MA
RMA - Adaptive MA
DEMA - Double EMA
TEMA - Triple EMA
Adjustable Parameters
Senior MA Length - period for long-term moving averages
Junior MA Length - period for short-term moving averages
✅ Advantages of the Strategy
🛡️ False Signal Protection - using two pairs of modified MAs reduces the number of false entries
🔄 Configuration Flexibility - ability to choose MA type and calculation periods
⚡ Automatic Switching - the strategy automatically closes the current position when receiving an opposite signal
📈 Visual Clarity - all MAs are displayed on the chart in different colors
⚠️ Disadvantages and Risks
📉 Signal Lag - like all MA-based strategies, it may provide delayed signals during sharp movements
🔁 Frequent Switching - in sideways markets, it may lead to multiple consecutive position openings/closings
📊 Requires Optimization - optimal parameters need to be selected for different instruments and timeframes
💡 Usage Recommendations
Backtest - test the strategy's performance on historical data
Optimize Parameters - select MA periods suitable for the specific trading instrument
Use Filters - add additional filters to confirm signals
Manage Risks - always use stop-loss and take-profit orders.
You can safely connect to the exchange via webhook and enjoy trading.
Good luck and profits to everyone!!

Volume Weighted EMAsIt's a script to calculate the volume weighted moving averages using exponential moving averages such as EMA, DEMA and TEMA instead of the pre-existing VWMA which uses SMA to calculate it.
Note: works only with charts that have volume data present, obviously !!!

Blended EMA (50 & 100)Plots EMA 50, EMA 100, and a blended EMA (average of the two)
Option to hide/show the original EMAs
Clean and lightweight — great for trend filtering on 1hr/4hr
