Moving Averages For All Timeframes [LevelUp]Manage moving averages, for every timeframe, from within one indicator.
Features:
■ Intraday - Up to 3 moving averages
■ Daily - Up to 4 moving averages
■ Weekly - Up to 2 moving averages
■ Monthly - Up to 2 moving averages
■ Choose between simple, exponential or volume weighted moving averages (SMA, EMA or VWMA)
Exponentialmovingaverage

200 EMA RoC Vs IndexThis indicator calculates 200 EMA rate of Change, between today's value vs yesterday's value
I found it useful and easier to track the trend.
I added 50 SMA as additional help top calculate averages between data. if the 50 SMA crosses over it will show gray background, and red if it crosses down.
The Histogram represent Index data.
Best use for Stock Market
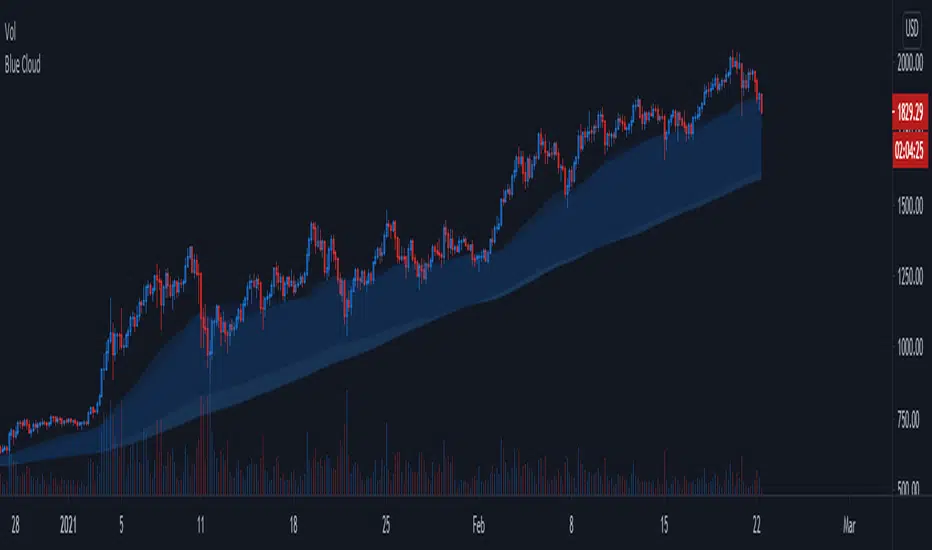
Blue CloudTrend Indicator
- Based on 4h 50/200 ma/ema
- Static, same accross all timeframes
- Works best with trending assets (espacially altcoins)
- 4h 50/200 ma/ema 's are transparent by default but can be enabled to improve visibility
Blue Cloud = Bullish, cloud often acts as support
Red Cloud = Bearish, cloud often acts as resistance
Moving Average Ribbon Master StrategyThe following features available in this strategy are listed below. To access, please visit the website in the signature area of this posting.
INTRODUCTION
Robust, fast, trading system
Multiple time frame (MTF) aspects built in everywhere into the strategy
Combines swing, scalp, greedy, volatile trading mechanisms
Works on intraday day time frames as well as Daily and Weekly
Trade sizing, targets, and stops are shown as new trades form and existing trades develop
Alerts warn the trader on all aspects of the trade evolution
Alerts are ready to be used for complete lifecycle automated trading
EMA TRADING
Combining EMAs on a higher time frame than the chart time frame is key
Trade conditions are met on a lower time frame that agree with the EMA ribbon direction
WHY DOES IT WORK?
With the right EMA settings, it is "hard" to generate trades.
The trade direction can easily shift
Successful trade entry triggers require a strong trend
While the EMA trend is positive, longs are taken on pullbacks, opposite for shorts
A basic learning algorithm is used to create a stop behind the trades
Learns over time the best stop offset from the price based on volatility
SWINGS AND SCALPS
Swings and scalps are treated differently.
Swings are the very first trade taken upon a directional shift. This is similar to the DIVINE series trading strategies
Swings are held until stopped out, Scalps always have a target based on the current volatility of the ticker and multiplier
Both swings and scalps start out in the "building" or "forming" phase.
A building phase is triggered when all criteria are met to form a long or short
Both trade types are executed as a market long or short when the ATR execution sensitivity reverses
The current ATR direction can be seen by the colored bars.
TRADING STYLES
Conservative
Aggressive
Greedy
Volatile
TRADE SIZING
Contract/Unit
VIX Multiplier
Percent of Equity
Percent Risk
TRADE INFORMATION
Historical trades show the price target of a scalp and the number of ticks of profit in parenthesis
New trades show all of the extra information surrounding the trade. This can be turned on to show the same information for past trades, but is left off to reduce clutter
Go over trade information categories one-by-one
Recent historical trades have a tooltip loaded to hover over and see the hidden information
Scalp trade is filled the numbered scalp icon shows as a (N)
SESSION WINDOW
Longs and shorts can only receive an execution signal when the ticker is within one of three session options provided
ADJUSTMENT
Last 3 sizing types show the quantity required to enter the trade to meet the parameters
Percent risk automatically adjusts the quantity to meet the risk criteria given the account equity, per trade
The account currency can be changed with will update the quantities automatically
Tick Unit and Value can also be changed if they are not accurate
ALERTS
Alerts for entire trade lifecycle
Full automated trading ready

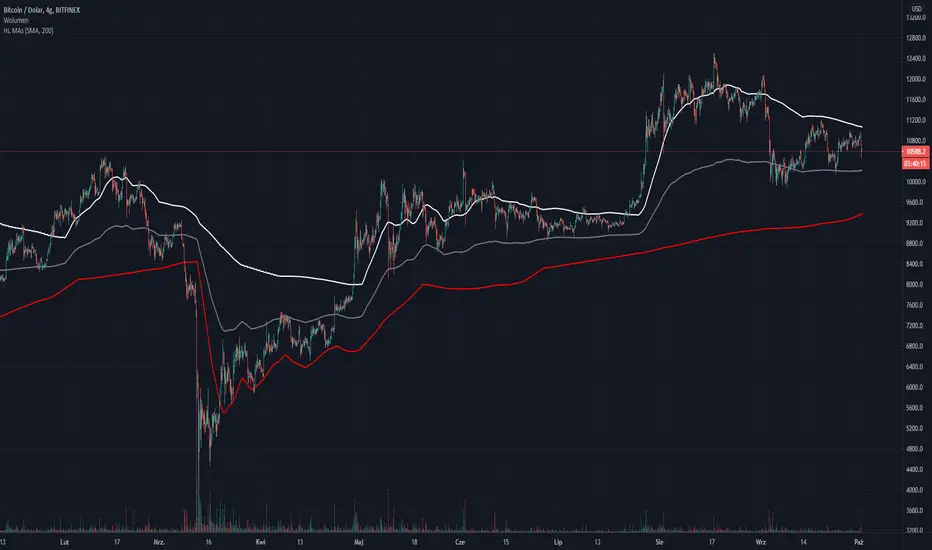
HL MAsMain features of this script are:
* To show always highest and lowest value from given Moving Averages of certain intervals (30min, 1h, 2h, 4h. 6h, 12h, 1D, 3D, 1W to choose from, multiple choices are possible and desired).
* It also draws the middle line made of highest and lowest MA lines.
* If you would like to see all the MAs to see how its working you can turn them on from the scripts options ("Show all MAs").
* You may switch between SMA and EMA.
* You may set the length of which MAs on all set intervals will be calculated.
* The plus of using this is also that no matter what interval you have on chart, you will always see MAs from set up intervals, so lines will be always in the same places on chart.
ps. This script is invite-only for the members of our trading group (info in signature, group is free of charge).

EMA with time-interval dependant visiblity settingThis scrip exposes 4 Exponential Moving Average (EMA) indicators which their visibility can be set to a daily or weekly time-frame (aka intervals). Based on your current chart time-frame, the matching EMA indicators come on and off.
This helps to have meaningful EMAs relevant to your time internal.
In a traditional 10 EMA indicates a plotted indicator would bear a meaning of a 10 day EMA when in daily and 10 week EMA when in weekly chart which may or may not be useful as some who for example only require a 10 week EMA for thier analysis and wouldn't want to cloud a daily chart with an EMA which won't resemble a valuable output for this particular user.
With EMA+, you can choose to see the 10 week EMA only when your chart is in the weekly time interval, so when switched to a daily interval a 10x EMA is not shown anymore.
If you prefer to see a 10 week EMA and a 21 day EMA on the other hand, you will only have 1 EMA shown when in weekly mode which is a 10 week EMA and one EMA when in daily mode with is 21 day EMA.

EMA 50 cross 200 with Strong TrendEMA 50 cross 200 with Strong Trend
Just Buy when Green apears and close it when disapear.
and
Just Sell when Red apears and close it when disapear.
if you combine with upper Time Frame , it will be supper decision
Good Luck

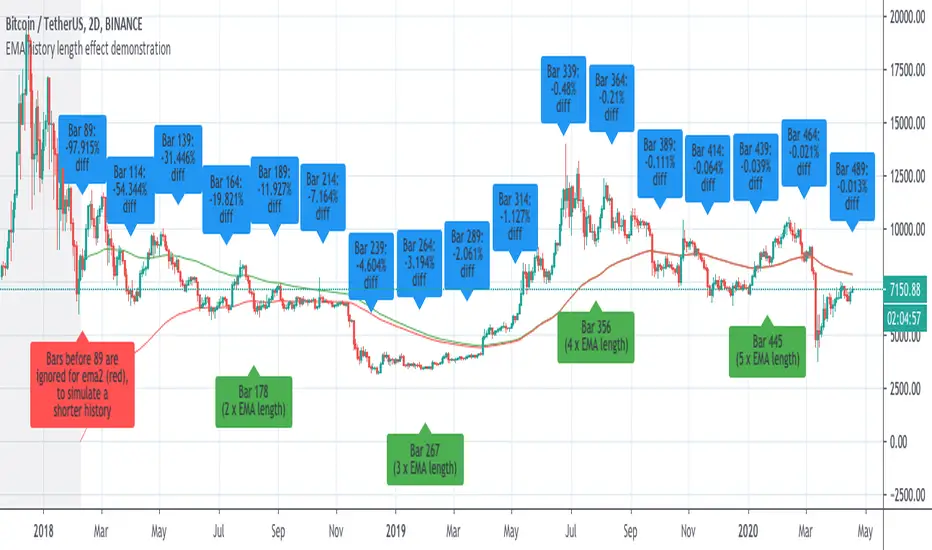
Demonstration of how history length affects all EMA valuesI saw some discussion of this so I whipped up an example to prove the that effect of history length on EMA values is pronounced, even for bars much further than the EMA length from the first candle of the chart.
This chart has two 89-bar EMAs of the close: a green one and a red one. However, for the red one, the first 89 bars of the graph are considered to have a close of "0", which is exactly whatTradingView's EMA calculation uses for bars before the start of the graph.
This is because unlike other moving averages, which reference the price of previous bars, the EMA references the EMA of previous bars. Therefore, bars closer to the beginning of the chart, where TradingView can't calculate an EMA because there is no previous EMA and therefore uses 0, will return substantially different values for the EMA() function that the same cart would with more history.
The further a bar is back in history, the less influence it has. However, every single historical bar has some influence on the EMA of every later bar.
To allow you to see this for yourself, this script contains the following inputs which you can change to see the effect:
-EMA period (default 89)
-Number of bars to ignore for EMA2 (default 89)
-decimal precision to show differences in. By making this a large number you can see that, although the effects diminish, history length affects all EMA values for the char.
-label spacing (increase this if you have a long history and run into TV's 50-label limit)
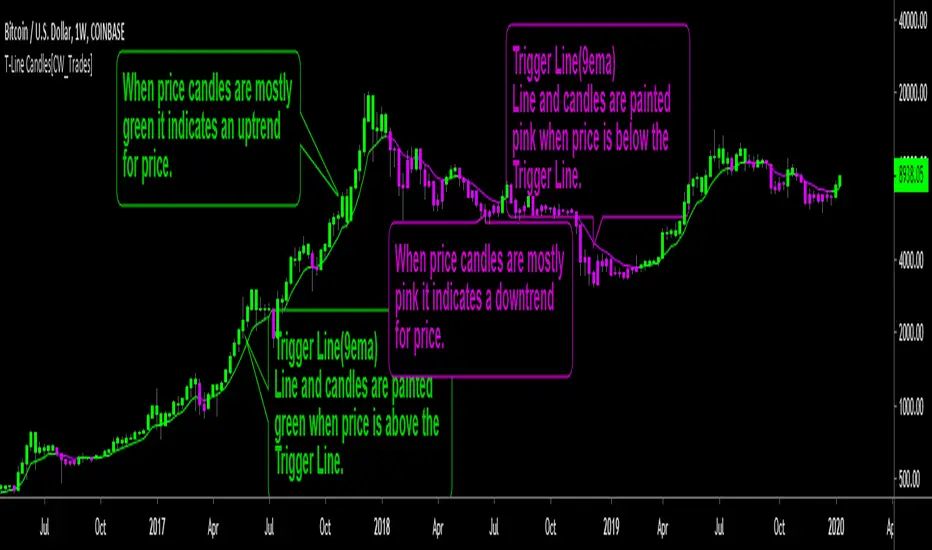
Trigger Line CandlesThis is a trend indicator utilizing a 9-period exponential moving average, known as the Trigger Line. When price is above the Trigger Line both the candles and Trigger Line are colored green, indicating an uptrend for price. Price will tend to find support at the Trigger Line when trending above the Trigger Line. When price is below the Trigger Line both the candles and the Trigger Line are colored pink, indicating a downtrend for price. Price will tend to find resistance at the Trigger Line when trending below the Trigger Line.
Coloring price candles based on price relation to the Trigger Line paints a clearer picture of the true short-term trend behind price, rather than traditional price candles which only paint price in two colors representing individual candle up and down movement while no short-term trend identification is utilized.
Indicator inputs are editable; candle colors and T-Line can be turned on/off.
Indicator inspired by Stephen Bigalow's T-Line strategy.
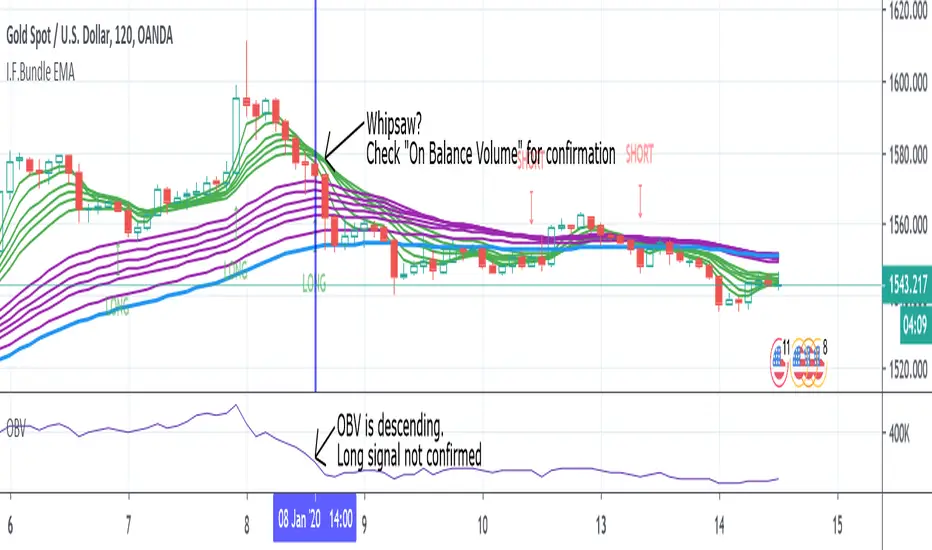
Investing Fellow Bundle EMAThis script uses the Bundle EMA to signal possible entry points for Long or Short positions. Bundle EMA could be used in Forex, Commodities, and other markets (e.g., Crypto), and it is not influenced by seasonality. I'm personally using it also on stocks.
The script is built over the theory of Daryl Guppy, and it has been manipulated to have good reliability on all timeframes, even if I prefer to use it with D, H1, H2, H4. The Investing Fellow Bundle EMA is set to give trading signals when the opportunity is still forming (be aware because this could generate many whipsaws). I preferred it to be faster, and you can experiment it on lower timeframes. In addition to the fast (green) and slow (purple) Bundle EMA, I plotted a further EMA (70 EMA - in blue) to be used as the signal line. 70 EMA is useful to better analyze script signals and to weigh the importance of them. A Long signal on a candle under the 70 EMA and a Short signal on a candle above 70 EMA are strong signals. Furthermore, signals that form around the 70 EMA tend to be stronger (possible trend reversal) than signals that form far away from that line.
I use the script together with On Balance Volume "OBV" (strongly suggested) to confirm signals and avoid whipsaws. OBV relies on the theory that volume precedes prices. Divergences are seen as an important confirmation of trend reversal with this indicator.
In case of no divergence on a Bearish/Bullish market, a Long/Short signal could be generated by the Investing Fellow Bundle EMA in the opposite direction of the market. Check the OBV to verify if the signal is matching increasing/decreasing volume (the chart shows an example).
Don't forget to like this script if you find it useful!
You are always welcome to follow me here on TradingView.
Investing Fellow
Disclosure: My ideas contain statements and projections based on assumptions on capital markets, and therefore inherently subject to numerous risks and uncertainties.
Before buying or selling any stock you should do your own research and reach your own conclusion or consult a financial advisor. Investing includes risks, including loss of principal.
I am not a financial advisor.
EMA Bar'sPlots the EMA's of 8,21,55 and 200.
when 21EMA crosses Up 55 EMA : Bar's Turn Green
when 21 EMA crosses down 55 EMA : Bar's Turn Red
Arrows are indicated at the crossovers.
Candles are colored to make an easy view of the trend.
All in One OverlayAll in One Overlay
SMA 1-3 / EMA 1-3 / H-L 1-3 / VWAP
VWAP is Volume-Weighted Average Price
SMA 1-3 is 1,2,or 3 Simple Moving Average Line(s).
EMA 1-3 is 1,2,or 3 Exponential Moving Average Line(s).
H-L 1-3 is the Highest high and Lowest low of x bars from the current bar.
Function is where you choose SMA 1, SMA 2, SMA 3, or EMA1, EMA 2, EMA 3, or H-L 1, H-L 2, H-L 3 to show up on your chart.
Input 1-3 is the number of bars the Function uses to generate its value, Input 1 determines SMA 1 or EMA 1 or H-L 1, Input 2 determines SMA 2 or EMA 2 or H-L 2, and Input 3 determines SMA 3 or EMA 3 or H-L 3.

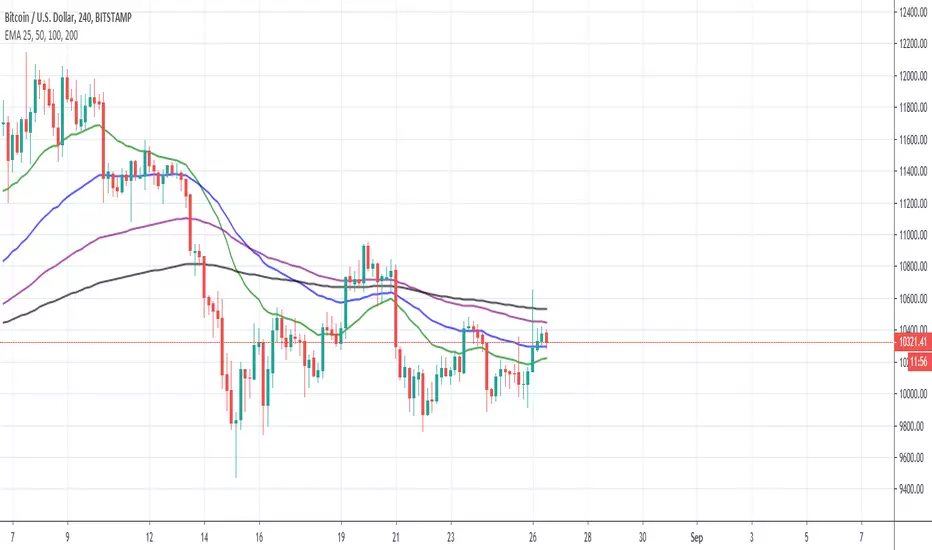
EMA 25, 50, 100, 200Use this script to reduce the amount of indicators. The darker the color, the longer timeframe the EMA is.
Multi EMA/SMA with Bollinger Bands Combo 1.0This script provides:
5 regular EMAs
5 regular SMAs
3 multiple time frame EMAs
3 multiple time frame SMAs
Bollinger Bands
All features can be turned on/off and customized regarding color, lines, etc.
Excellent for TradingView users with limited or free accounts.

4 Fibonacci EMAsAdd 4 Fibonacci EMAs to your charts with one indicator.
Configureable by value, so they don't necessarily have to use Fibonacci numbers, and by colors.

(JS) Fibonacci Moving Averages RibbonI am a big fan of Fibonacci EMAs, however I added the ability to look at multiple moving average types.
Having the Fibonacci Moving Averages grouped together like this will make them much easier to manage with the object tree as well.
Something I plan on using myself to remove clutter on my charts! Hope you like it!
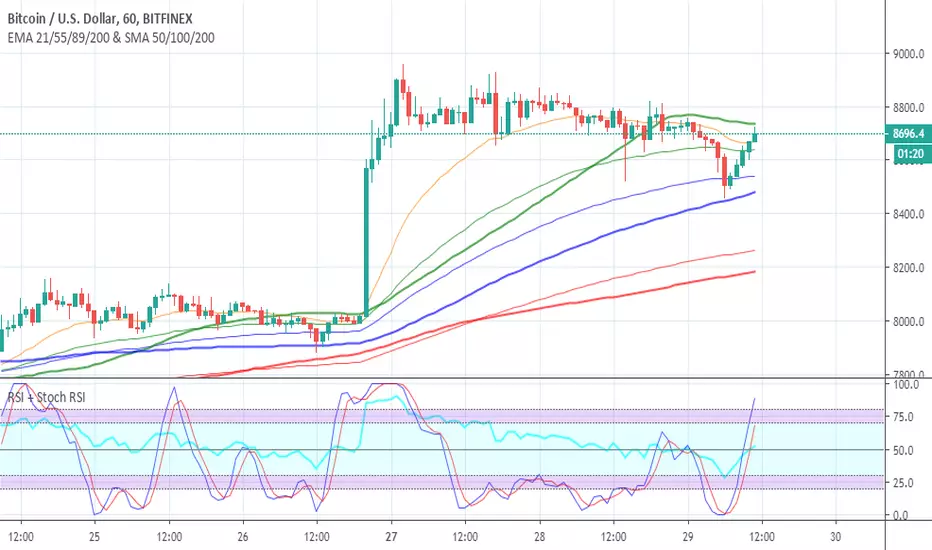
EMA 21/55/89/200 & SMA 50/100/200Free to use indicator combining all important time periods for two of the most valuable trading tools: EMAs and SMAs . As you can see on the chart and previous time periods, BTC often bounces off these, giving you an insight into possible future price movement. Add to your favourite scripts now at the bottom of this page and stay ahead of the game.
Switching off all except the most important periods in the indicator settings (21 & 55 EMA + 100 & 200 MA) can help keep a nice clean trading chart, if that is your preference.
SIMPLE MOVING AVERAGE
Smooths out the price across each period to reveal short, medium and long term trends and potential areas of support or resistance.
50, 100 and 200 are three of the most commonly used/respected moving averages.
The 200MA in particular provides very strong support/resistance on longer time frames.
EXPONENTIAL MOVING AVERAGE
A slightly more sophisticated version of the moving average, the EMA gives more weight to recent price action (i.e. a recent big move up/down will be reflection sooner... "the trend is your friend").
21, 55, 89 and 200 are four of the most commonly used/respected exponential moving averages.
The 21 and 55 EMA are undoubtedly the most powerful, and somewhat a self-fulfilling prophecy since so many people follow them.
Just so you know...
Green = 55/50, blue = 89/100, red = 200/200
EMAs are shown with thinner lines (as they change direction faster, think light and quick)
SMAs are shown with thicker lines (as they change direction slower, think heavier and more respected)
My free Combined RSI and Stochastic RSI Indicator , is also shown on the chart above and will save you valuable space on your trading screen, since you are strictly limited to the number of indicators you can use at one time. Give it a try and you'll wonder why you ever had separate indicators for RSI and Stoch RSI clogging up both your screen and indicator allowance.
These tools are for educational purposes only and not a recommendation to buy or sell. Always do your own research before trading.
Multiple EMAMultiple EMA. Color switch of slowest EMA (def=200) when price close below or above. Trend marker when fastest EMA (def=9) cross slowest EMA (def=200).
Multiple EMAMultiple EMA lines. Color switch of slowest EMA (def=200) when price close above or below. Trend marker when fastest EMA (def=9) cross slowest one.


Pivot Boss 4 EMA + Bollinger Bands + Parabolic SARA combination of some of my favorite indicators.
All credit to original authors.
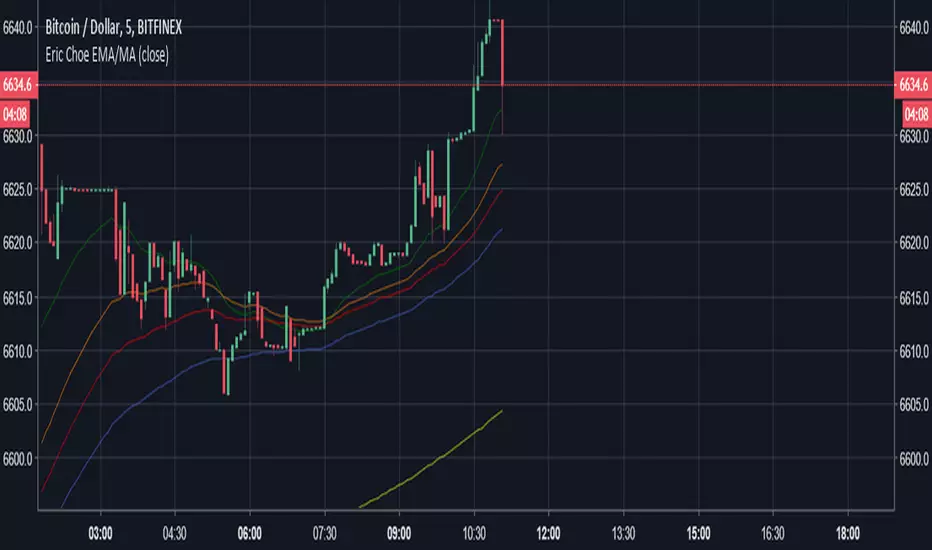
Eric Choe EMA/MAThis is Eric Choe's moving averages.
This indicator is really helpful on trading the trend with his EW (Elliot Wave) trading system