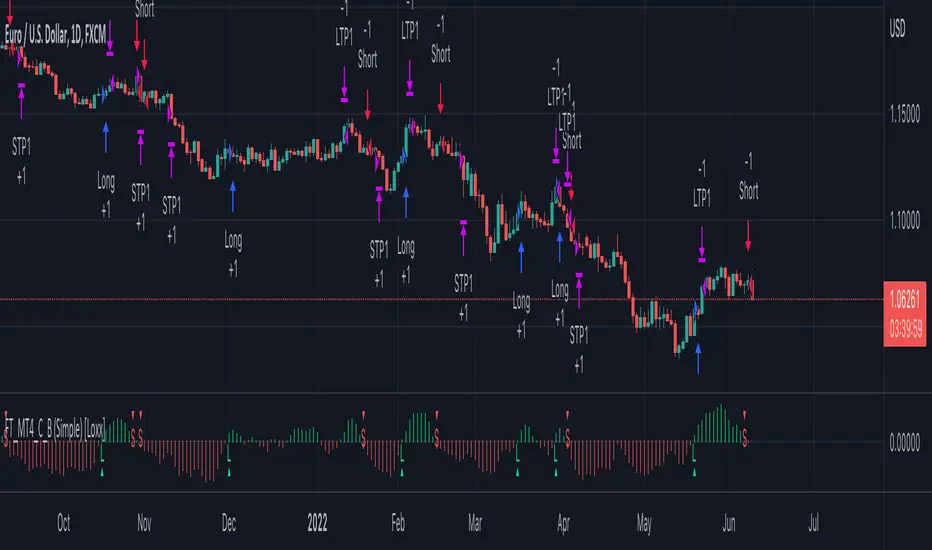
Fisher Transform, MT4 "Fisher_no_repainting" Backtest (Simple)Simple backtest for Fisher Transform, clone of MT4 "Fisher_no_repainting" found here:
What this backtest includes:
-Customization of inputs for Fisher Transform calculation
-Take profit 1 (TP1), and Stop-loss (SL), calculated using standard RMA-smoothed true range
-Activation of TP1 after entry candle closes
-Zero-cross entry signal plots
-Longs and shorts
Happy trading!
费舍尔转换(FT)
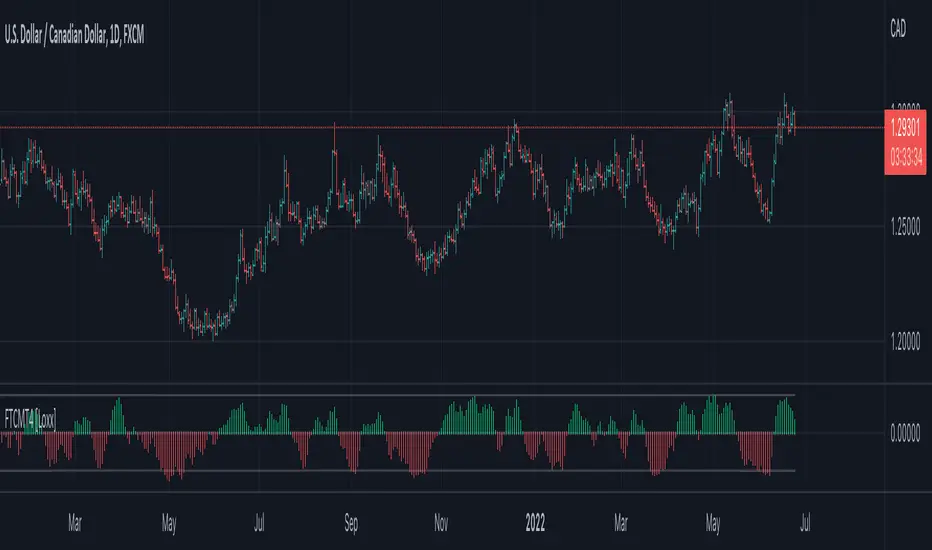
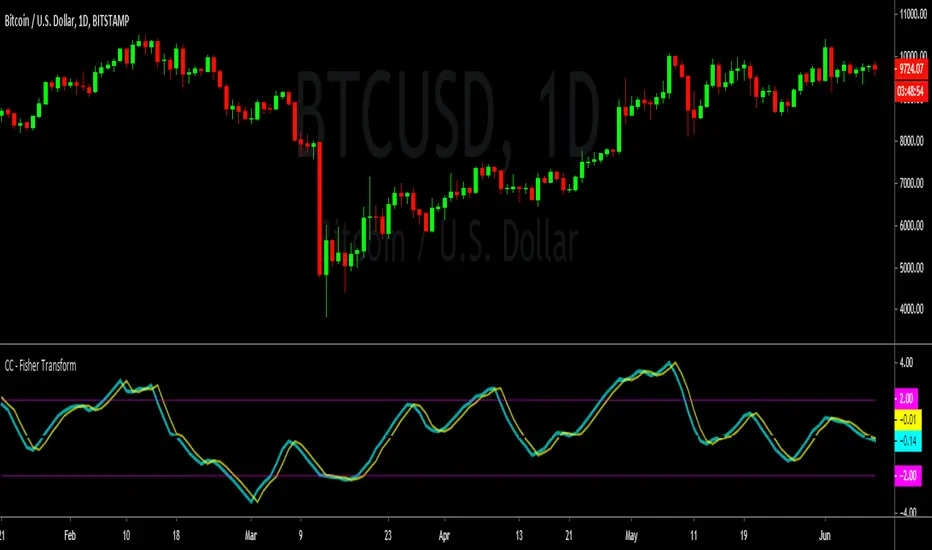
Fisher Transform, clone of MT4 "Fisher_no_repainting" [Loxx]The Fisher Transform is a technical indicator created by John F. Ehlers that converts prices into a Gaussian normal distribution.1 The indicator highlights when prices have moved to an extreme, based on recent prices. This may help in spotting turning points in the price of an asset. It also helps show the trend and isolate the price waves within a trend.
Included:
- Oversold and overbought regions
This is an exact clone of the "Fisher_no_repainting" MT4 indicator
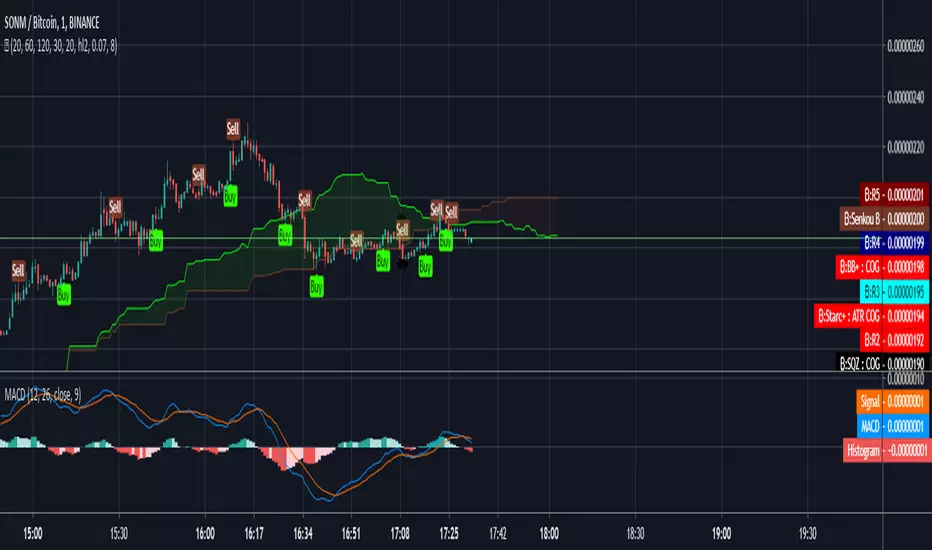
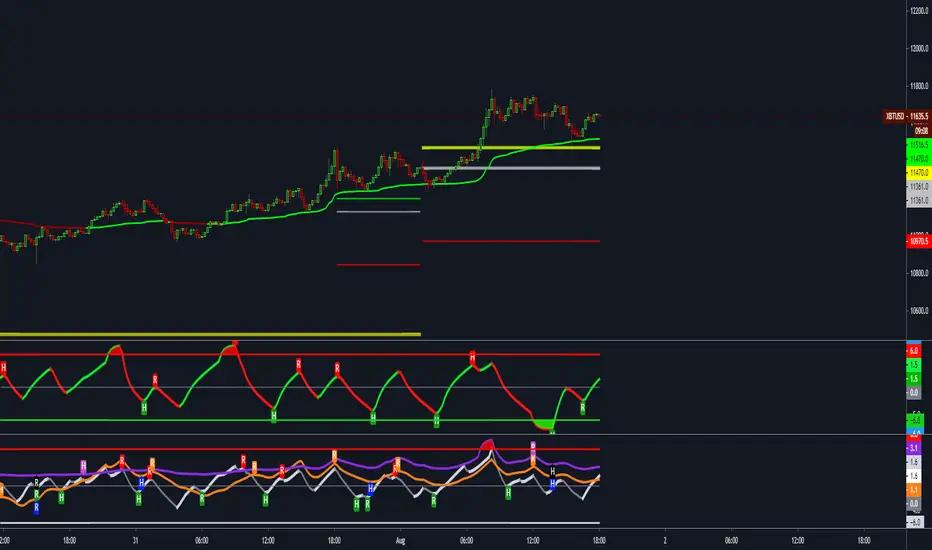
Directional Movement Index + Fisher Price Action With LabelsDIRECTIONAL MOVEMENT INDEX + FISHER PRICE ACTION WITH LABELS
Directional Movement Index shows buy and sell pressure.
Fisher transform shows price action trending bullish or bearish.
Caution dots notify you of conflicting trends.
***HOW TO USE***
The top lines are the fisher transform showing you the price action trend.
The bottom lines filled with color shows the DMI directional movement index.
The yellow dots at the bottom tell you if these two indicators are currently giving conflicting signals.
DMI
If the green line is above the red line and the background is colored green, there is more market buying than selling.
If the red line is above the green line and the background is colored red, there is more market selling than buying.
FISHER TRANSFORM
If the lines are painted green, the price action is trending up.
If the lines are painted red, the price action is trending down.
CAUTION DOTS
If a yellow dot shows up at the bottom of the chart, it is notifying you that the DMI and Fisher Transform are currently giving opposite signals…. so use caution.
***BULLISH/BEARISH LABEL***
There is also a label on the right side that tells you whether there is more buying or selling. This table updates in real time and changes colors so you can get an easy, quick interpretation of the current buy/sell pressure without having to look at the indicator data so you can make faster decisions on whether to enter or exit a trade.
Green means more market buying than selling.
Red means more market selling than buying.
Blue means an equal amount of market buying and selling.
If buying pressure is bullish but below the 20 level, a second label will show up in purple letting you know there is weak buying pressure so use caution.
If selling pressure is bearish but below the 20 level, a second label will show up in purple letting you know there is weak selling pressure so use caution.
There is a third label showing the current trend of the fisher transform. Green means bullish price action. Red means bearish price action.
The fourth label is orange and only shows up when the DMI and Fisher Transform are currently giving opposite signals, so make sure you use caution during those times.
***MARKETS***
This indicator can be used as a signal on all markets, including stocks, crypto, futures and forex.
***TIMEFRAMES***
This directional movement index + fisher transform indicator can be used on all timeframes.
***TIPS***
Try using numerous indicators of ours on your chart so you can instantly see the bullish or bearish trend of multiple indicators in real time without having to analyze the data. Some of our favorites are our Auto Fibonacci, Volume Profile, Momentum, Auto Support And Resistance and Money Flow Index in combination with this Directional Movement Index + Fisher Transform. They all have real time Bullish and Bearish labels as well so you can immediately understand each indicator's trend.

Fisher Cycle Adaptive, Fisher Transform [loxx]Fisher Cycle Adaptive, Fisher Transform
Things to know
-Experimental, not to be used in trading
Calculation
-Uses a measurement where the dominant, raw Fisher Transform position is measured and then used as the length input for the next bar
-This is based on raw recursive look backs, not based on any sine wave or signal processing measure of cycle dominance
How to use
-Change from Fixed to Fisher Cycle, adjust the wave cycle percent look back %
Features
-Bar coloring
-Thresholds

ADX Screener// Identify potential trend reversals using ADX on up to 40 crypto assets.
// ADX shows the strength of a trend, not the direction.
// By monitoring the difference of ADX values between candles, you can potentially identify reversals before they happen.
// A strong trend has a 14 period ADX slope increasing .5 or more from the prior candle.
// At a minimum, a weak trend has a 14 period ADX slope of +.25 or less, and strictly it would be decreasing.
// This indicator prints one row for each asset with three columns for ADX differences one candle back each.
// The asset name is colored green or red dependent on whether +DI > -DI or not.
The market was in a down trend (-DI > +DI).
A bullish wave moved price up to EMA 8 resistance with strong ADX momentum (ADX diff of prior candle >= 0.5).
A Spinning Top showed that the trend was losing momentum (ADX diff lower than previous candle, showed the bullish wave losing momentum).
A Morning Star bearish reversal pattern draws resistance at the high of the pattern. (ADX Bullish momentum exhausted).
Symbol: -DI > +DI
2: Strong momentum
1: Losing momentum (spinning top)
0: Trend reversal (bearish engulfing pattern)

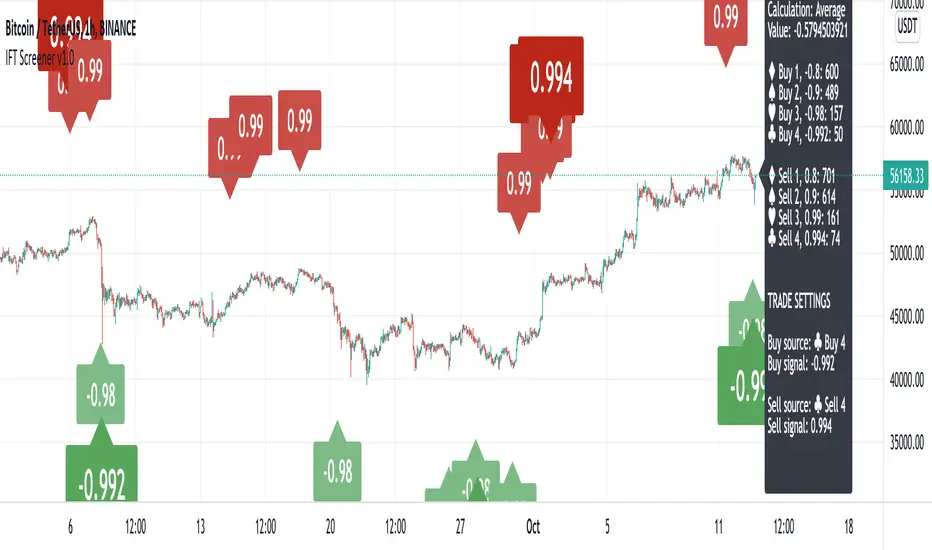
Inverse Fisher Transform ScreenerThis is a Screener for Inverse Fisher Transform on multiple oscillators
This tool is intended to aid you to visually analyse reasonable buy and sell IFT-signal thresholds across multiple tokens and different sources. It will help you speed up the tedious and manual work of trying out different IFT-settings when you're able to review the chart visually to find which values are present the most often and the location of that signal on the chart.
What does it bring to the table, why is it useful?
- Invese Fisher Transform on multiple oscillators such as RSI, MFI, CCI, Stochastic
- Combine multiple sources into one signal, select how it's calculated
- Visually review the chart for good IFT-settings
- 4 dynamic buy labels with different thresholds
- 4 dynamic sell labels with different thresholds
- Buy and sell on signal reversal
- Create your own trade alerts for automation
- Backtester compatible (plots 1 and 2 for buy and sell signals)
- A dynamic table counting amount of signals for each setting
- The labels are automatically updated when you change the values in the settings
How to use?
1. Change signal source and method
2. Change buy and sell thresholds
3. Show/hide additional labels
4. Review chart
5. Change trade settings
6. Backtest
7. Create alerts
Description
With this indicator you're able to visually review the signal strength of one or multiple oscillators processed with Inverse Fisher Transform ( IFT ), combine them and choose the method of calculation when they are combined. This produces a signal which strongly fluctuates between -1 and +1 instead of the more common 0-100 most oscillators uses. The intention is to make the decision making clearer and easier when you decide when to enter or exit a trade. This aims to help you remove the feelings from your trading.
Inverse Fisher Transform was first presented by John Ehlers in Stocks & Commodities V. 22:5 where he proposes to process RSI with the formula for hyperbolic tangent, tanh (x). This transforms the oscillator into a smoother and more compressed version with quicker oscillations.
VictoriaThis indicator visualises different oscillators processed through Inverse Fisher Transform
What is included:
Inverse Fisher Transform on different oscillators
You can combine multiple oscillators into one
The combination of sources can be calculated in different ways
Set different buy and sell signal thresholds
View selected thresholds in the chart
Use TradingView Technicals Buy and Sell signals to dynamically change threshold values
Convert signal to alerts
Multiple filters to allow or block signals
Backtest compatible
Alerts compatible
Two different chart modes:
You can view multiple oscillators in the same chart
You can view trade signals/alerts on the chart from the thresholds you have selected
Description:
With this indicator you're able to visually review the signal strength of one or multiple oscillators processed with Inverse Fisher Transform (IFT), combine them and choose the method of calculation when they are combined. This produces a signal which strongly fluctuates between -1 and +1 instead of the more common 0-100 most oscillators uses. The intention is to make the decision making clearer and easier when you decide when to enter or exit a trade. This aims to help you remove the feelings from your trading.
Inverse Fisher Transform was first presented by John Ehlers in Stocks & Commodities V. 22:5 where he proposes to process RSI with the formula for hyperbolic tangent, tanh(x). This transforms the oscillator into a smoother and more compressed version with quicker oscillations.
Within a bull or bear period of the traded asset the signal have different strengths. To harness this to our advantage we use the combined strength of the TradingView Technical indicator which gives us a Buy, Strong Buy, Sell or a Strong Sell on the selected timeframe and asset. This makes it possible to delay the buy in bearish conditions to only trigger when it is really oversold and also allow the signal be more relaxed and exit the trade sooner. While on the other hand if the condition is bullish the buy signal is relaxed and the sell requires a stronger signal. All of this is possible to change in the indicator to fine tune the settings for the specific asset and timeframe selected. We also have the possibility of blocking the buy signals with different filters.

Inverse Fisher Transform on RSI for backtest w/alertsThis version of the Inverse Fisher Transform on RSI comes with support for
1) Backtesting with Gavin's backtest script
2) Bypass, you can use another indicator to pause buy signals from this indicator. Just create another indicator that plots "1" whenever you want to activate the bypass on the IFTRSI signal.
3) Independent buy and sell level thresholds. Some tokens perform better with a higher sell level, even levels as high as 0.996, sometimes the buy level can also be relaxed to even 0.6 and get incredible results on the 5 minute chart.
4) alerts for Buy and Sell signals
Make sure you add Gavin's backtest and select external signal and this indicator as the source.

Fish Sniper - TrendicatorThis is a modified version of the Fisher Indicator.
How to use:
If you see the white stream crossing up or down on the dotted/dashed hlines then you are seeing the price and trend heading that direction. The green bars indicate an optimal long position, and the red bars indicate a short or an exit position. The green and red bars show when the white stream passes just above or below the ZERO line (dashed Aqua line).
While entering/exiting on the green/red bars generally a good strategy, it's good to look at the bigger picture and see how far the white stream has traveled to reach the ZERO line. You can often avoid trading on a sideways market if you notice smaller movements on the white stream.
This indicator will also draw a grey candle on your chart to signal it's time to exit a long trade and it will draw a purple candle when it's time to enter a long.
I mostly use this indicator as an additional confirmation to enter or exit an open position, it's worked well for me in avoiding some big drops in my crypto trading and entering early on some nice uptrends.

Ehler Fisher applied on distance EMAThis is an improved version of Fisher, which use as a source the distance from EMA , compared to the initial source which was on the close of a candle.
It can be used in any market, any time frame .
For conditions we have multiple conditions for the logic, in this case initially if our fisher is above 0 is a long direction ,if its belowe 0 its a short direction.
Also we can improve this condition even further, in this case if we cross up our previous line its a buy signal, and if we cross down its a sell signal.
For best usage combine the cross together with the position of fisher respecting the 0.
If you have any other questions, let me know with a private message.

Hull FisherThis strategy has a Fisher-Transform indicator applied to the highs and lows of a Hull moving average instead of the price. It also has a Commodity Channel Index to help with entry/exit. Each part of the strategy can be turned on and off, for example turn off CCI or HMA so they are not used in the order opening/exiting. The base of the strategies entry and exit logic is the fisher transform line, if it crosses over outside the lines or either side of zero (adjustable in settings).
This example on ETHBTC Daily chart has common crypto exchange commission 0.25% added. Please adjust that setting to suit your pair/broker. For example a Forex pair does not have that much commission so reduce it for Forex charts.
Can be applied to any time frame or trading instrument.

[NLX-L2] Fisher Stochastic Center of Gravity (v4)- Fisher Stochastic Center of Gravity-
This is Fisher's Stochastic Center of Gravity converted to pine v4 by blackcat. A very powerful entry indicator!
The original was published by DasanC & EmpiricalFX and it's a very interesting take on FSCG.
All the credit for the indicator goes to the authors and inventor of FSCG, this is just a mod to be used with my NLX Modular Trading Framework .
- How to Use -
1. Add a Trend Indicator like Trend Index MTF to your chart
2. Add " Fisher Stochastic Center of Gravity" Indicator to your Chart and select the Trend Index MTF with Type L1 in the Settings as Source
2. Add the Backtest to your Chart and select the FSCG Signal with Type L2 as Source
- Alerts for Automated Trading -
See my signature below for more information. Contact me for the Alert module.

Cracking Cryptocurrency - Fisher TransformCracking Cryptocurrency - Fisher Transform
A modern spin on a classic. John Ehler's formulas helped transform a generation of traders from working with traditional indicators such as Stochastic and moving average filters to applying frequency and wave theory to their price chart analysis. There are few tools as powerful as Ehler's Fisher Transform , which transforms the behavior of price in a Gaussian Distribution, or a Normal Probability Distribution. This allows us to attain a bell curve of price, with our outliers clearly and objectively identifiable as well as accurately indicate trend direction by bisecting our wave into peaks and troughs.
Features & Functions
Simple and Clean. Only the data you want, no unnecessary information cluttering your work flow.
Adjustable Sources. Select which data source you want to compile your data from from an easy drop-down menu.
Adjustable Triggers. Standard versions of the Fisher have been unable to innovate on the Trigger Line, a vital part of utilizing this to generate trade signals and setups. In this version, choose and adjust your own Trigger and Smoothing Filter based on tried and true implementations.
Adjustable Thresholds. Most versions of the Fisher do not truly allow the customization of the algorithm to suit the asset you are analyzing. All thresholds in this version are fully adjustable to customize this indicator to work for you, not against you.
---
Purpose
To remain true to Ehler's original vision of the Fisher Transform while providing traders a functional and efficient indicator with modern innovations and conveniences.
Ehlers Fisher Transform Indicator [CC]The Fisher Transform Indicator was created by John Ehlers and the beauty of this indicator is that it provides sharp and clear turning points that are also very early. Buy when the indicator line is green and sell when it is red.
This was a special request so let me know if you would like me to publish other scripts or if you want something custom done!

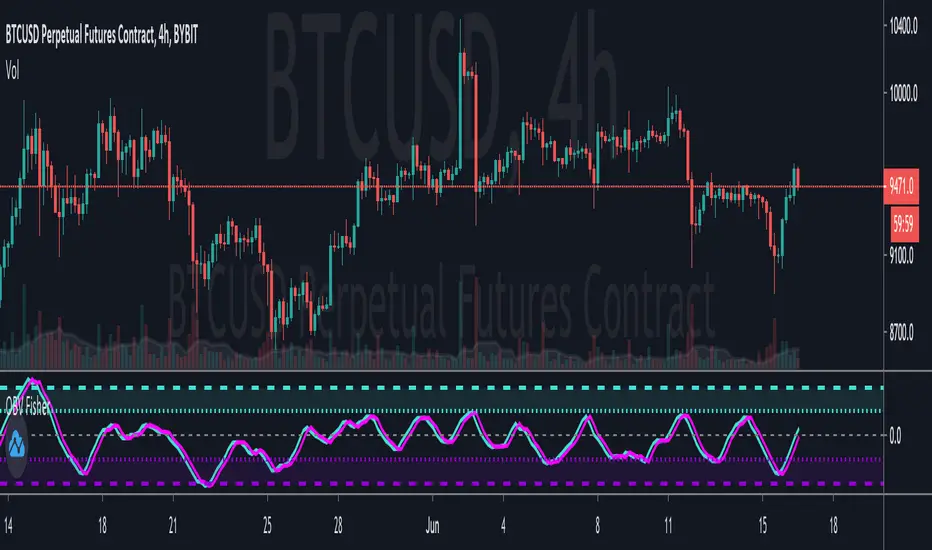
Fisher Transform on OBVApplies Ehlers Fisher Transform on to OBV, with EMA as trigger line.
Useful for identifying overbought and oversold conditions.

Fisher Transform Divergence PointerThis script points regular and optionally hidden types of bullish and bearish Fisher Transform divergences on the chart by drawing the divergence lines and optionally labels.
Hidden divergence is disabled by default, it can be enabled over settings window.
Regular divergence is enabled by default, it can be disabled over settings window.
There is an option to display the price channel additionally.
Added alerts for all types of divergences.

Ifish KAMA Kaufman’s Adaptive Moving Average (KAMA) was developed by American quantitative financial theorist, Perry J. Kaufman, in 1998. The technique began in 1972 but Kaufman officially presented it to the public much later, through his book, “Trading Systems and Methods.” Unlike other moving averages, Kaufman’s Adaptive Moving Average accounts not only for price action but also for Market Volatility.
When market volatility is low, Kaufman’s Adaptive Moving Average remains near the current market price, but when volatility increases, it will lag behind. What the KAMA indicator aims to do is filter out “market noise” – insignificant, temporary surges in price action. One of the primary weaknesses of traditional moving averages is that when used for trading signals, they tend to generate many false signals. The KAMA indicator seeks to lessen this tendency – generate fewer false signals – by not responding to short-term, insignificant price movements.
Traders generally use the moving average indicator to identify market trend and reversals.
When calculating Kaufman’s Adaptive Moving Average, the following standard settings are used:
10 – Number of periods for the Efficiency Ratio
2 – Number of periods for the fastest exponential moving average
30 – Number of periods for the slowest exponential moving average
One of the uses of Kaufman’s Adaptive Moving Average is to identify the general trend of current market price action. Basically, when the KAMA indicator line is moving lower, it indicates the existence of a downtrend. On the other hand, when the KAMA line is moving higher, it shows an uptrend. As compared to the regular MA.
the KAMA indicator is less likely to generate false signals that may cause a trader to incur losses.
Kaufman’s Adaptive Moving Average can also be used to spot the beginning of new trends and pinpoint trend reversal points. One way to do this is by plotting two KAMA lines on a chart – one with a more short-term moving average and another with a longer-term moving average. When a faster KAMA line crosses above a slower KAMA line, this indicates a change from a downtrend to an uptrend. The trader can take a long position and close the trade when the faster MA line crosses back to beneath the slower MA line. Trading signals can also be derived by the movement of market price in relation to Kaufman’s Adaptive Moving Average. If price crosses from below to above the KAMA line, that is a bullish (buy) signal. Conversely, price falling from above the KAMA line to below it is a bearish (sell) signal.
Kama will color flip automatically when cross happens.
green = bullish flip
red = bearish flip
Ma line by its self just great to find s/r levels.
the periods that I like to use as input, I prefer fib sequence numbers
ea: 3,13, 21, 34 etc.
For more info or trading concept check my profile.

Fisher Transform DivergenceEhler's Fisher transform with instant confirmation divergences.
Scheduled update is adding hidden divergences, currently under construction
Fisher Transform SmoothThis is a smooth version of Fisher, what it really does;
Value1 is a function to normalize price within its last 10 day range. The period for the range is adjustable as an input. Value1 is centered on its midpoint and then doubled so that Value1 will swing between the –1 and +1 limits. Value1 is also smoothed with an EMA whose alpha is 0.33. The smoothing may allow Value1 to exceed the ten day price range, so limits are introduced to preclude the Fisher Transform from blowing up by having an input value larger than unity . The Fisher Transform is coded to delayed by one bar to provide a crossover system that identifies the cyclic turning points.
If Fisher transformed indicator has a value of −1, it has a value of negative one standard deviation and therefore there is a 32 percent chance prices will go lower. If the transformed indicator has a value of −2, it has a value of negative two standard deviations, and therefore there is only an 8 percent chance prices will go lower. This is a high-probability buying opportunity. At a level of −3, the negative 3 standard deviations means there is only a 2 percent chance of the prices going lower. Fisher transform values are symmetrical, so positive deviations are high-probability indications to exit a long position or to sell short. If the prices are normalized to fall within the range from –1 to +1 and subjected to the Fisher Transform , the extreme price movements are relatively rare events. This means the turning points can be clearly and unambiguously identified. “J.Ehler”
Bollinger Bands measures 21 period of FTransfrom’s expansion (deviations). When fisher very close to bands or touches the bands it tells that FT is due for crossover. The most profitable trades (entry/exits) are the crossovers by the bands on extreme deviations, and it doesn’t matter what time frame you are looking, FT always will be inside the bands, it hardly goes above or below bands, where you will be able to catch the market turn out points. For trading Concept DM

ote 3d v0This was supposed to be an automatic ICT OTE (Optimal Trade Entry) Fib level placement on a 3-day scale, but this did not turn out anywhere near close to how I envisioned it working.
Probably with some more development and applied math for the fib levels, I can get this to work even with breached 3D levels, but currently it's an exercise in frustration.