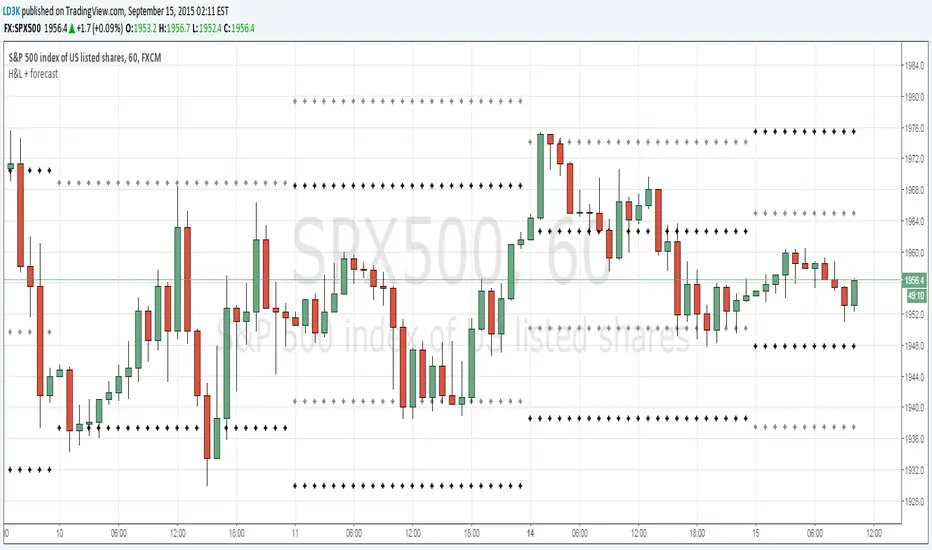
Previous H/Ls and Forecast H/LPlots the previous periods High and Lows (black crosses) and forecasts the next day's High and Lows (gray crosses)Pine Script®指标由LD3K提供66336