Fed Funds Rate-of-ChangeFed Funds Rate-of-Change
What it does:
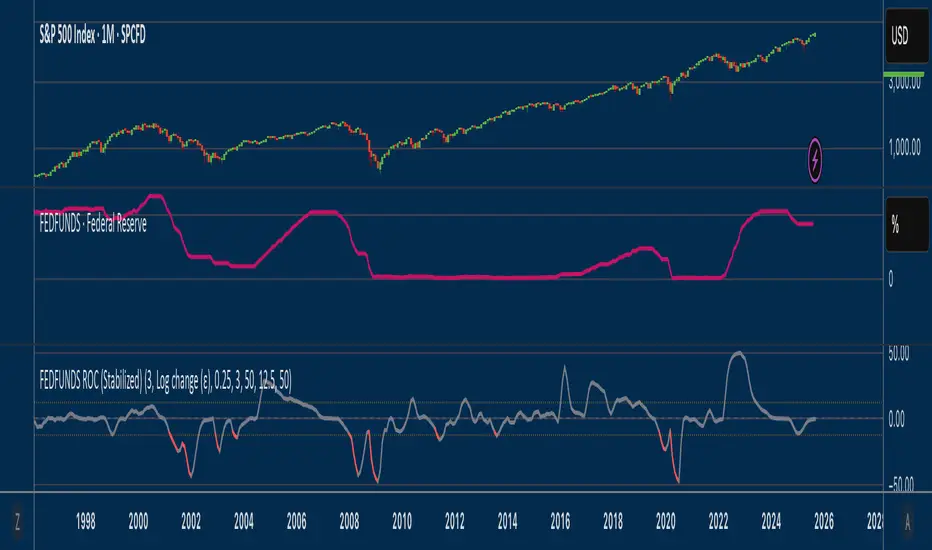
This indicator pulls the Effective Federal Funds Rate (FRED:FEDFUNDS, monthly) and measures how quickly it’s changing over a user-defined lookback. It offers stabilized change metrics that avoid the “near-zero blow-up” you see with naive % ROC. The plot turns red only when the signal is below the lower threshold and heading down (i.e., value < –threshold and slope < 0).
This indicator is meant to be useful in monitoring fast cuts on the part of the FED - a signal that has preceded recession or market pullbacks in times prior.
Change modes: Percentage, log and delta.
Percent ROC (ε floor): 100 * (now - prev) / max(prev, ε)
Log change (ε): 100 * (ln(now + ε) - ln(prev + ε))
Delta (bps): (now - prev) * 100 (basis points; avoids percentage math)
Tip: For “least drama,” use Delta (bps). For relative change without explosions near zero, use Log change (ε).
Key inputs:
Lookback (months): ROC window in calendar months (because source is monthly).
Change Metric: one of the three options above.
ε (percentage points): small constant (e.g., 0.25 pp) used by Percent ROC (ε) and Log change (ε) to stabilize near-zero values.
EMA Smoothing length: light smoothing of the computed series.
Clip |value| at: optional hard cap to tame outliers (0 = off).
Threshold % / Threshold bps: lower/upper threshold band; unit adapts to the selected metric.
Plot as histogram: optional histogram view.
Coloring / signal logic
Red: value is below the lower threshold (–threshold) and the series is falling on the current bar.
How to use:
Add to any chart (timeframe doesn’t matter; data is monthly under the hood).
Pick a Change Metric and set Lookback (e.g., 3–6 months).
Choose a reasonable threshold:
Percent/Log: try 10–20%
Delta (bps): try 50–100 bps
Optionally smooth (EMA 3–6) and/or clip extreme spikes.
Interpretation
Sustained red often marks periods of accelerating downside in the Fed Funds change metric (e.g., policy easing momentum when using bps).
Neutral (gray) provides context without implying direction bias.
Notes & limitations
Source is monthly FRED series; values update on monthly closes and are stable (no intrabar repainting of the monthly series).
Threshold units switch automatically with the metric (%, %, or bps).
Smoothing/clip are convenience tools; adjust conservatively to avoid masking important shifts.
基本面分析
Kraliyet Trend Dashboard (Sabit + R:R + BE Alarm)v6 Sertaç AKMANRoyal Trend Dashboard combines EMA8–EMA200, SuperTrend, MACD, RSI, and ATR in one panel to automatically spot trend direction, pullbacks, and breakout entries while showing live risk-reward. It marks EMA8 touches and next-bar confirmations, triggers an ENTRY alert on the latest pivot break, calculates SL via SuperTrend±ATR or ATR×multiplier, and sets TP1/TP2 by R multiples. While in a trade it tracks live R:R and, when TP1 hits, prompts SL = BE to lock profits. Markers are pinned to price and the dashboard docks to any corner; on lower timeframes (e.g., 15m) you can align with a 1H higher-timeframe filter. In short: the Trend → Pullback → Breakout playbook with disciplined risk management and ready-made alerts—fast and practical.

Mongoose Global Conflict Risk Index v1Overview
The Mongoose Global Conflict Risk Index v1 is a multi-asset composite indicator designed to track the early pricing of geopolitical stress and potential conflict risk across global markets. By combining signals from safe havens, volatility indices, energy markets, and emerging market equities, the index provides a normalized 0–10 score with clear bias classifications (Neutral, Caution, Elevated, High, Shock).
This tool is not predictive of headlines but captures when markets are clustering around conflict-sensitive assets before events are widely recognized.
Methodology
The indicator calculates rolling rate-of-change z-scores for eight conflict-sensitive assets:
Gold (XAUUSD) – classic safe haven
US Dollar Index (DXY) – global reserve currency flows
VIX (Equity Volatility) – S&P 500 implied volatility
OVX (Crude Oil Volatility Index) – energy stress gauge
Crude Oil (CL1!) – WTI front contract
Natural Gas (NG1!) – energy security proxy, especially Europe
EEM (Emerging Markets ETF) – global risk capital flight
FXI (China ETF) – Asia/China proxy risk
Rules:
Safe havens and vol indices trigger when z-score > threshold.
Energy triggers when z-score > threshold.
Risk assets trigger when z-score < –threshold.
Each trigger is assigned a weight, summed, normalized, and scaled 0–10.
Bias classification:
0–2: Neutral
2–4: Caution
4–6: Elevated
6–8: High
8–10: Conflict Risk-On
How to Use
Timeframes:
Daily (1D) for strategic signals and early warnings.
4H for event shocks (missiles, sanctions, sudden escalations).
Weekly (1W) for sustained trends and macro build-ups.
What to Look For:
A single trigger (for example, Gold ON) may be noise.
A cluster of 2–3 triggers across Gold, USD, VIX, and Energy often marks early stress pricing.
Elevated readings (>4) = caution; High (>6) = rotation into havens; Shock (>8) = market conviction of conflict risk.
Practical Application:
Monitor as a heatmap of global stress.
Combine with fundamental or headline tracking.
Use alert conditions at ≥4, ≥6, ≥8 for systematic monitoring.
Notes
This indicator is for informational and educational purposes only.
It is not financial advice and should be used in conjunction with other analysis methods.

US Net Liquidity + M2 / US Debt (FRED)US Net Liquidity + M2 / US Debt
🧩 What this chart shows
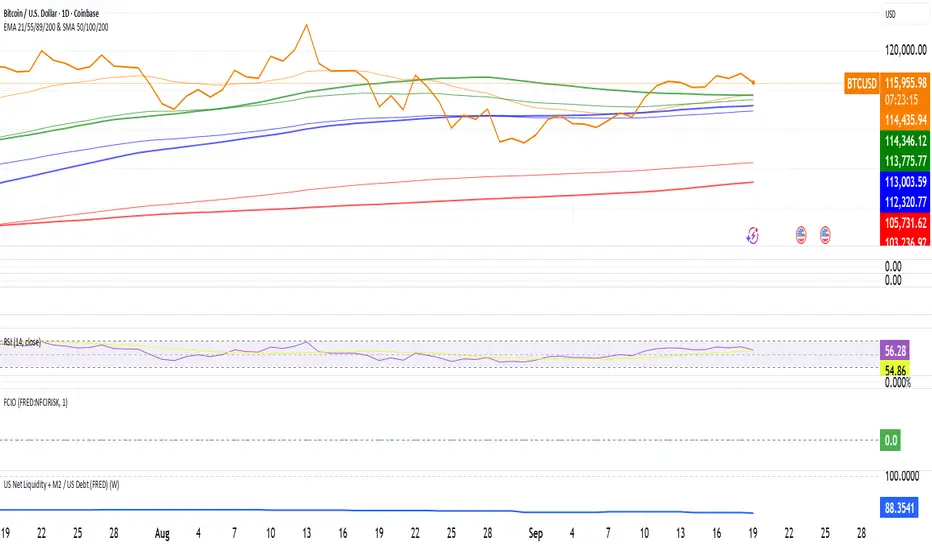
This indicator plots the ratio of US Net Liquidity + M2 Money Supply divided by Total Public Debt.
US Net Liquidity is defined here as the Federal Reserve Balance Sheet (WALCL) minus the Treasury General Account (TGA) and the Overnight Reverse Repo facility (ON RRP).
M2 Money Supply represents the broad pool of liquid money circulating in the economy.
US Debt uses the Federal Government’s total outstanding debt.
By combining net liquidity with M2, then dividing by total debt, this chart provides a structural view of how much monetary “fuel” is in the system relative to the size of the federal debt load.
🧮 Formula
Ratio
=
(
Fed Balance Sheet
−
(
TGA
+
ON RRP
)
)
+
M2
Total Public Debt
Ratio=
Total Public Debt
(Fed Balance Sheet−(TGA+ON RRP))+M2
An optional normalization feature scales the ratio to start at 100 on the first valid bar, making long-term trends easier to compare.
🔎 Why it matters
Liquidity vs. Debt Growth: The numerator (Net Liquidity + M2) captures the monetary resources available to markets, while the denominator (Debt) reflects the expanding obligation of the federal government.
Market Signal: Historically, shifts in net liquidity and money supply relative to debt have coincided with major turning points in risk assets like equities and Bitcoin.
Context: A rising ratio may suggest that liquidity conditions are improving relative to debt expansion, which can be supportive for risk assets. Conversely, a falling ratio may highlight tightening conditions or debt outpacing liquidity growth.
⚙️ How to use it
Overlay this chart against S&P 500, Bitcoin, or gold to analyze correlations with asset performance.
Watch for trend inflections—does the ratio bottom before equities rally, or peak before risk-off periods?
Use normalization for long historical comparisons, or raw values to see the absolute ratio.
📊 Data sources
This indicator pulls from FRED (Federal Reserve Economic Data) tickers available in TradingView:
WALCL: Fed balance sheet
RRPONTSYD: Overnight Reverse Repo
WTREGEN: Treasury General Account
M2SL: M2 money stock
GFDEBTN: Total federal public debt
⚠️ Notes
Some FRED series are updated weekly, others monthly—set your chart timeframe accordingly.
If any ticker is unavailable in your plan, replace it with the equivalent FRED symbol provided in TradingView.
This indicator is intended for macro analysis, not short-term trading signals.
CAGR Indicator (Flexible Holding Period)CAGR Indicator (Flexible Holding Period)
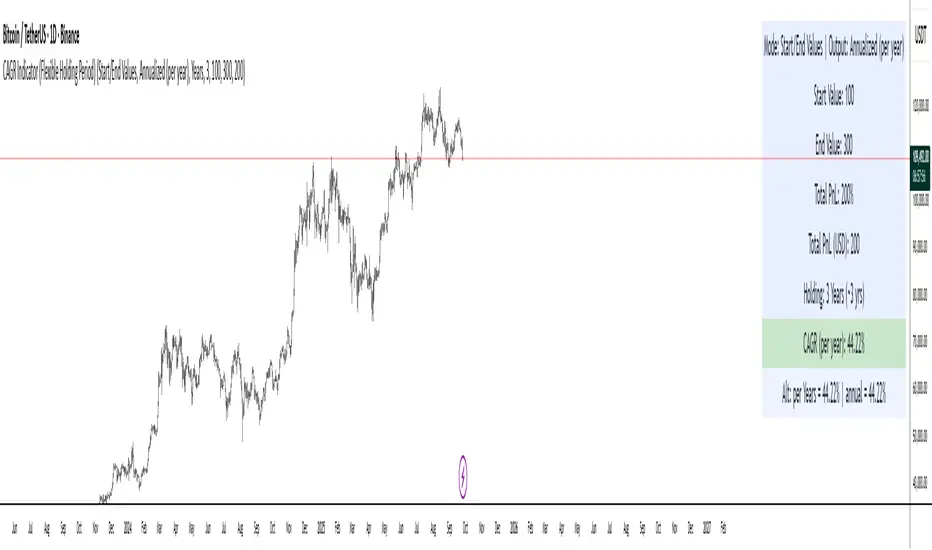
The CAGR Indicator (Flexible Holding Period) is designed to convert any cumulative investment outcome into a standardized, annualized growth rate that can be compared across assets, strategies, and time horizons. Its core metric is the compound annual growth rate, which represents the constant yearly rate that, if compounded smoothly, transforms an initial value into a final value over a specified horizon. By annualizing returns, the indicator removes distortions caused by unequal test lengths and allows direct comparison with benchmarks such as index returns or risk-free rates.
Conceptually, the indicator proceeds in two stages: measuring growth and normalizing time. Growth is summarized by the growth multiple, which is the ratio of ending value to starting value when concrete values are provided, or equivalently 1 plus total percentage return divided by 100 when only a cumulative percent is known. Time is normalized by converting the user’s holding period into a year-equivalent, so that a 45-day, 30-week, 18-month, or multi-year interval can all be mapped onto a common annual scale. The conversions use widely accepted approximations: days divided by 365.25, weeks divided by approximately 52.1429, and months divided by 12, while years are used as entered.
Once growth and time are expressed in compatible units, the indicator applies the standard compounding identity: CAGR = (Growth Multiple)^(1/T) − 1, where T is the year-equivalent holding period. This transformation inverts the compounding process and yields the geometric mean rate of return per year. Because the geometric mean is path-independent, the CAGR summarizes start-to-finish performance without reference to the sequence of gains and losses. The output therefore reflects the constant annual rate that would have produced the observed terminal value from the initial value if returns had been smooth.
The indicator admits two data entry modes to accommodate common reporting practices. In Start/End Values mode, the user supplies initial and final portfolio values; the indicator computes the growth multiple as end divided by start and also displays absolute profit or loss in currency terms to aid practical interpretation. In Total PnL (%) mode, the user supplies a cumulative return percentage; the indicator converts this to a growth multiple and estimates a corresponding ending value for display, while the CAGR computation itself relies only on the multiple and the time horizon.
Validity checks ensure that reported numbers are meaningful. The growth multiple must be strictly positive; cumulative losses at or below minus one hundred percent make the multiple nonpositive and render the CAGR undefined. The holding period must be positive and convertible to a year-equivalent. In Start/End mode, the starting value must exceed zero to avoid division by zero and degenerate ratios. When these conditions are not met, the indicator withholds a numeric result and signals that the quantity is not well defined.
Interpreting the output requires recognizing both its strengths and its limits. The CAGR is a concise, comparable measure of long-run performance that abstracts from timing and volatility. It is particularly useful for benchmarking strategies of different durations, setting policy targets for funds, communicating results to stakeholders, and aligning outcomes with hurdle rates. However, because it is path-independent, the CAGR does not reflect interim drawdowns, variance, or tail risk. It also presumes a lump-sum investment with no intermediate cash flows; when deposits or withdrawals occur, internal rate of return methods such as IRR or XIRR are more appropriate.
Typical applications include comparing backtests with unequal sample lengths, reporting consolidated results from discrete projects on a common annual basis, and translating short-horizon event outcomes (for example, a multi-week campaign) into an annualized figure for decision-making. The indicator’s auxiliary displays, such as total profit or loss in currency and the explicit statement of the original holding period alongside its year-equivalent, improve transparency and auditability of the transformation.
Users should remain mindful of several caveats. Time conversions rely on conventional averages and may differ from calendar-exact counts by small amounts, which is usually immaterial but worth noting for edge cases. Selection bias can inflate reported CAGRs if intervals are cherry-picked; robust practice involves rolling windows, out-of-sample tests, and sensitivity analysis. Most importantly, the CAGR should be paired with risk and stability measures—such as maximum drawdown, Sharpe or Sortino ratios, downside deviation, or ulcer index—to form a complete assessment of a strategy’s quality.
In sum, the indicator operationalizes a simple but powerful idea: separate the measurement of growth from the normalization of time, then apply the compounding identity to express outcomes as a consistent per-year rate. By combining flexible period inputs with a rigorous geometric transformation, it enables fair, intelligible comparisons while encouraging the complementary use of risk diagnostics to avoid over-reliance on a single summary statistic.
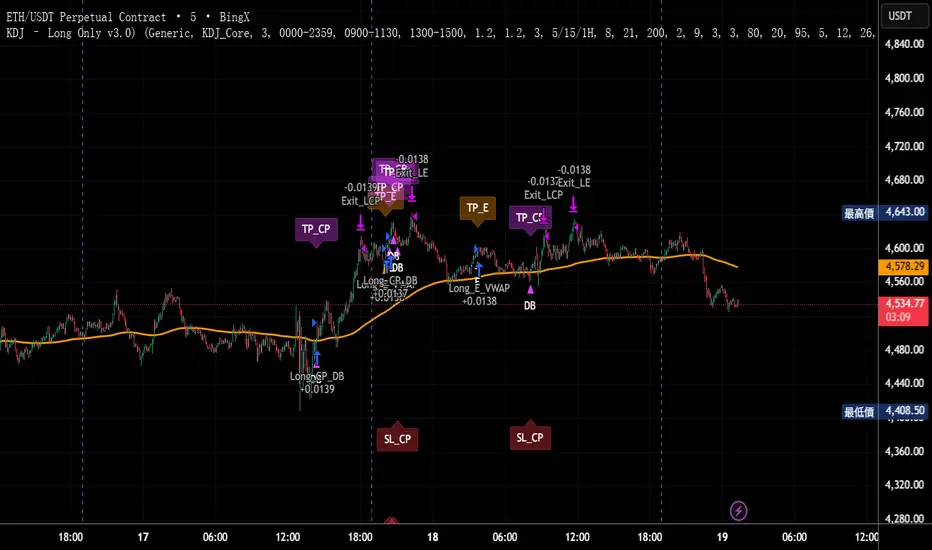
KDJ – Long Only v3.0 (TradingView Strategy)
Overview|概覽
EN
A research strategy that automates long-only entries using a KDJ-centric core with multi-layer confirmations and volatility-aware exits. Default preset targets ETH 5m; other symbols/timeframes can be tuned.
中文
研究用策略,透過 KDJ 核心與多層確認來自動化只做多進場,並以隨波動調整的出場邏輯運作。預設為 ETH 5 分鐘;其他商品/週期可自行調參。
Backtest (hypothetical) example: ETHUSDT.P, 5m, 2024-09-18→2025-09-18, fee 0.05%, slippage 1 tick.(僅示意,屬假設性回測)
What it does|做什麼
EN
Signals are organized into channels:
A KDJ trend core
B OB/FVG touch pullback
CP Double-bottom (buffered neckline)
SR Support/Resistance bounce with rejection/zone checks
D EMA pullback (long EMA length)
E VWAP reclaim (lower-band pierce & recapture)
F Prior-low sweep & reclaim
中文
訊號分成多通道:
A KDJ 順勢核心
B OB/FVG 回踩觸價
CP 雙底(頸線含緩衝)
SR 支撐/阻力觸價不破(含拒絕與區域檢查)
D EMA 回踩(長週期 EMA)
E VWAP 收復(下緣穿越後收回)
F 前低掃回
High-level logic|高層級原理
HTF/Mid-TF context:內建 5/15/1H 或 15/60/4H 組合;以簡化趨勢線/區域提供觸價參考
Trend & structure:本階 EMA(8/21/200) 結構;Structure Breakout(近期高低點 ±ATR 緩衝)/EMA8/21 回踩
Momentum/volume:MACD、KDJ 金叉與低區偵測、量能驗證
Regime:ADX 閘(趨勢/盤整門檻)、EMA 帶寬過濾震盪、Peak Guard 避免過度延伸
No look-ahead:入場不使用前視;樞紐/趨勢線僅作情境參考
Inputs & Features|參數與功能
Market Preset:Generic / ETH(ETH 預設收緊若干門檻,開箱即用)
Entry Mode:KDJ_Core / CandleOnly / KDJ_and_Candle
Session Filter:最多三段交易時窗
Lite Filters:過度延伸、實體大小、DI 差距
S/R 模組:拒絕條件、KDJ 覆核、區域要求、即時 R:R 檢核
OrderBlock/FVG:近棒位移掃描
Chart Pattern:雙底 W,ATR 容差與頸線緩衝
Plotting:EMA200、通道字母標記、可選 TP/SL 標籤
Automation via Alerts(generic)|快訊自動化(通用)
EN
On entries/exits the strategy emits JSON through alert_message. Create alerts with “Any alert() function call” and route them to your own webhook/bridge. Symbol mapping, sizing mode, and user info are configurable in inputs.
中文
進出場時透過 alert_message 輸出 JSON。建立快訊時選 “Any alert() function call”,再由你的 webhook/橋接服務轉單;輸入面板可設定商品代碼、下單型式與使用者資訊。
提示:調整參數後,請重建快訊,並將訊息欄設為 {{strategy.order.alert_message}}。
Position sizing|部位大小
base / quote / percent_local / percent(percent_local 以本地 USD 估值計算)
可選「按數量模式」以便與本地部位同步(position_size sync)
Risk & Exits|風險與出場
SL:ATR / Swing / ATR_or_Swing;TP Cap 以 ATR 或 % 限制上限
Breakeven & Trailing:達指定 R:R 啟動保本;之後以 最高價回看 − ATR×k 追蹤
Same-bar exits:可允許/禁止同根觸發 TP/SL
Pyramiding:pyramiding=2,最多兩筆多單可同時存在(淨倉交易所請留意整體倉位的平倉行為)
Suggested workflow|建議流程
回測目標市場/週期 → 設定時段/濾網與門檻 → 微調 TP/SL 與部位大小 → 建立快訊({{strategy.order.alert_message}})→ 監看執行日誌
Notes & Disclaimer|注意與免責
回測結果仰賴時間框解析與成交規則;棒內路徑與實盤可能不同
僅供研究/教育;非投資建議
本頁無廣告、無外部連結或聯絡資訊
Release Notes|版本說明
2025-09-19
新增:One-shot Force Flat(一鍵清倉僅一次)— 於下一根收盤執行,完成後自動失效
Webhook:進/出場皆輸出 JSON;提醒更新參數後重建快訊
行為澄清:pyramiding=2,允許同圖表最多兩筆多單並存;同棒出場可設定
2025-09-18
Netted venue 說明:在淨倉模式下,出場會影響同商品的整體淨多倉;請留意手動單與策略單的互動
2025-08-28
修正小數顯示;預設優化(ETH/5m);保留隨波動的 RR/SL 邏輯
Stocker++Stocker++ Trading Indicator: Complete User Guide
This comprehensive trading indicator combines technical analysis, fundamental analysis, risk management, and value investing principles into an integrated decision-making system. Here's how to use it effectively for investment decisions.
Core Functionality Overview
The indicator provides six customizable data tables that display on your chart, each serving a specific analytical purpose. You can enable/disable individual tables and adjust their positions, colors, and text sizes to suit your preferences.
Table 1: Risk Management and Volume Analysis
Risk Management Section
This table calculates your optimal position size based on your account size and risk tolerance. Key components include:
Account Size and Risk Parameters: Enter your total trading capital and the percentage you're willing to risk per trade (typically 1-2%). The indicator automatically calculates the dollar amount at risk.
Stop Loss Calculation: Choose between two methods - ATR-based (Average True Range) or Low of Day. The ATR method provides a volatility-adjusted stop loss, while LoD uses the day's low as support.
Position Sizing: The indicator calculates exactly how many shares to buy based on your risk parameters and stop loss distance. It also shows your total position size as both a dollar amount and percentage of your account.
Liquidity Analysis: Critical safety features include:
Maximum allowed position based on daily volume (prevents you from taking positions too large for the stock's liquidity)
Minimum required daily volume for your position size
Liquidity ratio showing if there's sufficient volume for your trades
Float analysis indicating what percentage of shares are publicly tradeable
Position impact assessment showing how your trade might affect the stock price
Volume Analysis Section
Provides real-time liquidity metrics:
Average daily dollar volume (20-day average)
Average daily share volume
Relative volume (current vs average)
Volume buzz (unusual activity indicator)
Table 2: Company Information and Analyst Ratings
Company Metrics
Displays essential market data:
Daily price change in dollars
ATR (14-day volatility measure)
Average Daily Range percentage
Low of Day price and distance from current price
Market capitalization
Total shares outstanding
Float shares and percentage
Free cash flow and yield
Employee count and shareholder numbers
Sector and industry classification
Gap analysis (today's low vs yesterday's high)
Analyst Recommendations
Shows consensus analyst opinions:
Number of buy, strong buy, sell, strong sell, and hold ratings
Total analyst coverage
Date of most recent recommendations
Table 3: Earnings History
Displays quarterly earnings performance across multiple periods:
Standardized EPS (adjusted for one-time items)
Reported EPS
Analyst estimates
Earnings surprise (beat/miss) with percentages
Revenue actuals vs estimates
Revenue surprise percentages
Color coding: Green for beats, red for misses
Table 4: Comprehensive Financial Analysis
Income Statement Metrics
Quarterly revenue with gross profit margins
Operating income and margins
Net income and profit margins
Earnings per share
Balance Sheet Analysis
Total assets, liabilities, and equity
Cash and equivalents
Total debt
Debt-to-equity ratio (risk indicator)
Valuation Metrics
Market cap and enterprise value
EV/Revenue ratio
Price-to-book ratio
Book value per share
Return on Equity (ROE)
Return on Assets (ROA)
Key Multipliers
P/E ratio (Price to Earnings)
P/S ratio (Price to Sales)
PEG ratio (P/E to Growth)
EV/EBITDA
Advanced Valuation Analysis
The indicator calculates fair value using multiple methodologies:
Graham Number for profitable companies
DCF (Discounted Cash Flow) model
Revenue-based valuation for unprofitable companies
Asset-based valuation for pre-revenue companies
It provides:
Fair value estimate with methodology used
Current price vs fair value percentage
Investment rating (0-10 scale)
Long-term outlook assessment
Warren Buffett Criteria Section
Evaluates stocks against Buffett's investment principles:
ROE Quality (must exceed 15%)
Debt Payoff Time (should be under 3 years)
Economic Moat score (competitive advantages)
Owner Earnings (Buffett's preferred cash flow metric)
Margin of Safety (discount to intrinsic value)
Overall Buffett Score (0-5 scale)
Table 5: Investment Summary Dashboard
This synthesizes all analysis into actionable insights:
Investment Grade: Letter grade (A-F) based on weighted scoring of liquidity, cash flow, valuation, and Buffett criteria
Decision Output: Clear BUY, HOLD, or AVOID recommendation
Risk Assessment: Categorizes overall risk as minimal, low, moderate, or high
Key Summary Metrics:
Valuation status with margin of safety percentage
Buffett score and verdict
Liquidity quality and float percentage
Cash flow quality and FCF yield
Risk alerts for critical issues
Investment Strategy Framework
Entry Criteria
For a BUY signal, the indicator requires:
Investment score ≥7 out of 10
Margin of safety >25% (stock trading below fair value)
Float percentage >20% (configurable)
FCF margin >5% or cash runway >2 years
Buffett score ≥3 out of 5
Position Sizing Strategy
Set your account size and risk percentage (1-2% recommended)
The indicator calculates optimal share count based on stop loss distance
Verify the position doesn't exceed liquidity constraints
Check position impact - should be <0.1% of float for minimal market impact
Risk Management Rules
Use the calculated stop loss level (ATR or LoD based)
Ensure position size doesn't exceed 30% of account (or the calculated maximum)
Verify average daily volume is at least 200x your position size
Monitor the liquidity ratio - should be >2x for safe entry/exit
Fundamental Quality Checks
Before investing, ensure:
Positive or improving margins (gross, operating, net)
Debt-to-equity ratio <2 (preferably <1)
Positive free cash flow or adequate cash runway
ROE >15% for established companies
Revenue growth and earnings consistency
Exit Considerations
Consider selling when:
Stock reaches fair value (margin of safety approaches 0%)
Fundamental metrics deteriorate significantly
Debt levels become concerning (D/E >2)
Free cash flow turns negative without clear path to profitability
Technical indicators (moving averages) show breakdown
Moving Averages Component
The indicator includes six customizable moving averages (SMA or EMA) with individual:
Period lengths (default: 10, 20, 50, 100, 150, 200)
Timeframes (can use higher timeframes on lower charts)
Colors for visual distinction
Use these for trend identification and support/resistance levels.
Practical Usage Tips
For Growth Investors: Focus on revenue growth, improving margins, and moderate valuation with emphasis on long-term outlook
For Value Investors: Prioritize margin of safety >25%, Buffett score ≥4, and fundamental strength
For Traders: Use volume analysis, technical levels, and strict position sizing with stop losses
For Risk-Averse Investors: Only consider stocks with investment grade A or B, minimal risk assessment, and strong cash positions
Warning Indicators
The system highlights critical risks:
Low float (<20%) - high volatility risk
Cash burn with <2 years runway
Overvaluation >150% of fair value
High debt (D/E >2)
Insufficient liquidity for position size

Grand Master's Candlestick Dominance (ATR Enhanced)### Grand Master's Candlestick Dominance (ATR Enhanced)
**Overview**
Unleash the ancient wisdom of Japanese candlestick charting with a modern twist! This comprehensive Pine Script v5 strategy and indicator scans for over 75 classic and advanced candlestick patterns (bullish, bearish, and neutral), assigning dynamic strength scores (1-10) to each for precise signal filtering. Enhanced with Average True Range (ATR) for volatility-aware body size validation, it dominates the markets by combining timeless pattern recognition with robust confirmation layers. Whether used as a backtestable strategy or visual indicator, it empowers traders to spot high-probability reversals, continuations, and indecision setups with surgical accuracy.
Inspired by Steve Nison's *Japanese Candlestick Charting Techniques*, this tool elevates pattern analysis beyond basics—think Hammers, Engulfing patterns, Morning Stars, and rare gems like Abandoned Baby or Concealing Baby Swallow—all consolidated into intelligent arrays for real-time averaging and prioritization.
**Key Features**
- **Extensive Pattern Library**:
- **Bullish (25+ patterns)**: Hammer (8.0), Bullish Engulfing (10.0), Morning Star (7.0), Three White Soldiers (9.0), Dragonfly Doji (8.0), and more (e.g., Rising Three, Unique Three River Bottom).
- **Bearish (25+ patterns)**: Hanging Man (8.0), Bearish Engulfing (10.0), Evening Star (7.0), Three Black Crows (9.0), Gravestone Doji (8.0), and exotics like Upside Gap Two Crows or Stalled Pattern.
- **Neutral/Indecision (34+ patterns)**: Doji variants (Long-Legged, Four Price), Spinning Tops, Harami Crosses, and multi-bar setups like Upside Tasuki Gap or Advancing Block.
Each pattern includes duration tracking (1-5 bars) and ATR-adjusted body/shadow criteria for relevance in volatile conditions.
- **Smart Confirmation Filters** (All Toggleable):
- **Trend Alignment**: 20-period SMA (customizable) ensures entries align with the prevailing trend; optional higher timeframe (e.g., Daily) MA crossover for multi-timeframe confluence.
- **Support/Resistance (S/R)**: Pivot-based levels with 0.01% tolerance to confirm bounces or breaks.
- **Volume Surge**: 20-period volume MA with 1.5x spike multiplier to validate momentum.
- **ATR Body Sizing**: Filters small bodies (<0.3x ATR) and long bodies (>0.8x ATR) for context-aware pattern reliability.
- **Follow-Through**: Ensures post-pattern confirmation via bullish/bearish closes or closes beyond prior bars.
Minimum average strength (default 7.0) and individual pattern thresholds (5.0) prevent weak signals.
- **Entry & Exit Logic**:
- **Long Entry**: Bullish average strength ≥7.0 (outweighing bearish), uptrend, volume spike, near support, follow-through, and HTF alignment.
- **Short Entry**: Mirror for bearish dominance in downtrends near resistance.
- **Exits**: Bearish/neutral shift, or fixed TP (5%) / SL (2%)—pyramiding disabled, 10% equity sizing.
- Backtest range: Jan 1, 2020 – Dec 31, 2025 (editable). Initial capital: $10,000.
- **Interactive Dashboard** (Top-Right Panel):
Real-time insights including:
- Market phase (e.g., "Bullish Phase (Avg Str: 8.2)"), active pattern (e.g., "BULLISH: Bullish Engulfing (Str: 10.0, Bars: 2)"), and trend status.
- Strength breakdowns (Bull/Bear/Neutral counts & averages).
- Filter status (e.g., "Volume: ✔ Spike", "ATR: Enabled (L:0.8, S:0.3)").
- Backtest stats: Total trades, win rate, streak, and last entry/exit details (price & timestamp).
Toggle mode: Strategy (live trades) or Indicator (signals only).
- **Advanced Alerts** (15+ Toggleable Types):
Set up via TradingView's "Any alert() function call" for bar-close triggers:
- Entry/Exit signals with strength & pattern details.
- Strong patterns (≥2 bullish/bearish), neutral indecision, volume spikes.
- S/R breakouts, HTF reversals, high-confidence singles (≥8.0 strength).
- Conflicting signals, MA crossovers, ATR volatility bursts, multi-bar completions.
Example: "STRONG BULLISH PATTERN detected! Strength: 9.5 | Top Pattern: Three White Soldiers | Trend: Up".
**Customization & Usage Tips**
- **Inputs Groups**: Strategy toggles, confirmations, exits, backtest dates, and 15+ alert switches—all intuitively grouped.
- **Optimization**: Tune min strengths for aggressive (lower) or conservative (higher) trading; enable/disable filters to suit your style (e.g., disable S/R for scalping).
- **Best For**: Forex, stocks, crypto on 1H–Daily charts. Test on historical data to refine TP/SL.
- **Limitations**: No external data installs; relies on built-in TA functions. Patterns are probabilistic—combine with your risk management.
Master the candles like a grandmaster. Deploy on TradingView, backtest relentlessly, and let dominance begin! Questions? Drop a comment.
*Version: 1.0 | Updated: September 2025 | Credits: Built on Pine Script v5 with nods to Nison's timeless techniques.*

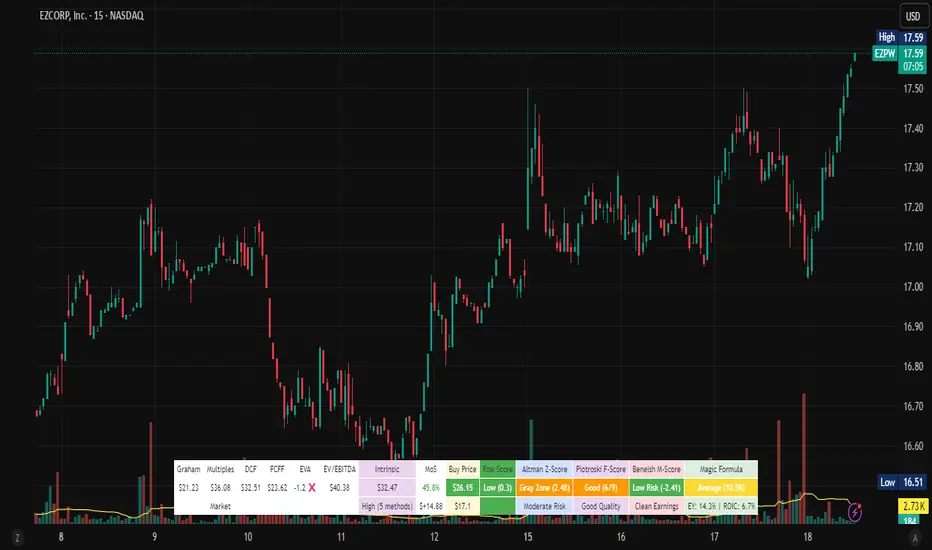
Stock Valuation Models - Professional Investment Analysis Tool📊 Overview
Stock Valuation Models is a comprehensive financial analysis indicator that combines multiple valuation methodologies to calculate intrinsic stock value. This professional-grade tool implements 7 different valuation methods , risk assessment framework, and financial health metrics to provide data-driven investment decisions.
🎯 Key Features
📈 Multiple Valuation Methods
Graham's Valuation - Conservative asset-based approach by Benjamin Graham
Multiples Valuation - Market-based P/E and P/B ratios from sector peers
Discounted Cash Flow (DCF) - Future cash flow projections with present value calculation
Dividend Discount Model - Gordon Growth Model for dividend-paying stocks
FCFF Model - Enterprise-level Free Cash Flow to Firm analysis
EVA Model - Economic Value Added measurement above cost of capital
Advanced Multiples - Enterprise Value ratios (EV/EBITDA, EV/Sales)
🏥 Financial Health Metrics
Altman Z-Score - Bankruptcy prediction and financial distress assessment
Piotroski F-Score - 9-point fundamental strength evaluation
Beneish M-Score - Earnings manipulation detection system
Magic Formula - Joel Greenblatt's combined quality and value scoring
⚖️ Risk Assessment Framework
Multi-Factor Risk Scoring - Fundamental, market, quality, and data quality risks
Risk-Adjusted Margin of Safety - Dynamic safety thresholds based on risk level
Position Sizing Guidance - Risk-appropriate investment allocation recommendations
🔍 Data Quality System
Real-Time Quality Tracking - Visual warnings for insufficient data
Fallback Methodology - Alternative calculations when primary data unavailable
Confidence Scoring - Method agreement and data quality assessment
⚙️ Settings & Parameters
Main Settings
Margin of Safety (%) - Minimum discount required before buying (Default: 15%)
Table Font Size - Choose between "Small" and "Normal" text size
Valuation Methods
Graham's Valuation - Best for mature, stable companies with strong fundamentals
Multiples Valuation - Compares to industry peers using dynamic sector ratios
Discounted Cash Flow - Ideal for growth companies with predictable cash flows
Dividend Discount Model - For consistent dividend-paying stocks (disabled by default)
FCFF Model - Enterprise approach for leveraged companies and M&A analysis
EVA Model - Measures value creation above cost of capital
Advanced Multiples - Wall Street standard EV ratios for professional analysis
Additional Metrics
Magic Formula - Combined quality and value scoring system
Altman Z-Score - Bankruptcy risk assessment (Safe >2.99, Distress <1.81)
Piotroski F-Score - Fundamental quality score (Excellent ≥8, Poor <4)
Beneish M-Score - Manipulation detector (High Risk >-2.22, Low Risk ≤-2.22)
🔧 How It Works
Dynamic Calculations
Sector-Based Ratios - Automatically detects company sector and applies appropriate valuation multiples
Economic Integration - Uses real-time risk-free rates, VIX volatility, and GDP growth data
Quality Weighting - Adjusts method weights based on company type (growth/mature/distressed) and market conditions
Negative Value Handling - Shows actual calculated values but excludes negative results from weighted average
Risk-Adjusted Analysis
VIX Integration - Higher market volatility increases required margin of safety
Sector Risk Premiums - Energy and Financial sectors get higher risk multipliers
Quality Adjustments - High Piotroski F-Score companies get lower risk ratings
Data Quality Impact - Insufficient data increases risk score and safety requirements
Visual Display
Horizontal Table Layout - Organized by method groups (Valuation → Results → Risk → Health)
Color-Coded Results - Green/Yellow/Red indicators for risk levels and recommendations
Warning Symbols - ⚠️ for data quality issues, ❌ for excluded negative values
Dollar Amounts - Both percentage and dollar-based margin of safety calculations
📈 Interpretation Guide
💎 Intrinsic Value Results
Weighted Average - Combines all enabled methods based on intelligent weighting
Confidence Level - High/Medium/Low based on method agreement and data quality
Method Count - Number of successful valuation calculations
🎯 Margin of Safety
Percentage - Current discount/premium to calculated intrinsic value
Dollar Amount - Absolute dollar difference per share
Buy Price - Risk-adjusted target purchase price
⚖️ Risk Assessment
Low Risk (Green) - Normal position sizing (3-5%)
Medium Risk (Yellow) - Reduced position sizing (1-3%)
High Risk (Red) - Minimal position sizing (<1%)
📊 Recommendations
STRONG BUY - Low risk + adequate margin + high confidence
BUY - Meets risk-adjusted margin requirements
HOLD - Positive margin but higher risk
SELL - Insufficient margin for risk level
🎓 Educational Tooltips
Every parameter includes detailed explanations accessible by hovering over the setting. Learn about:
When to use each valuation method
How different metrics are calculated
Interpretation thresholds and ratings
Risk factors and quality indicators
💡 Best Practices
🚀 For Growth Stocks
Enable DCF and Advanced Multiples
Focus on Piotroski F-Score for quality assessment
Use higher margin of safety due to volatility
💰 For Value Stocks
Enable Graham's and Multiples Valuation
Check Altman Z-Score for financial stability
Consider Magic Formula rating
📈 For Dividend Stocks
Enable Dividend Discount Model
Focus on sustainable dividend coverage
Check for consistent dividend history
⚠️ For Distressed Situations
Prioritize Graham's asset-based approach
Monitor Altman Z-Score closely
Use higher risk-adjusted margins
⚠️ Important Notes & Data Limitations
📅 Data Timing Considerations
Fundamental Data Lag - Company financial data (earnings, cash flows, balance sheet items) may be 1-3 months behind current market conditions
Quarterly Reporting Delays - Most recent available data reflects the company's situation as of the last filed quarterly/annual report
Market vs. Fundamentals Gap - Stock prices react instantly to news, while fundamental data updates occur periodically
Accuracy Impact - Recent business changes, market events, or company developments may not be reflected in current calculations
🔧 Technical Limitations
Data Dependencies - Requires fundamental data availability from TradingView
Quality Warnings - Pay attention to ⚠️ symbols indicating insufficient data
Risk Context - Always consider risk score in investment decisions
Market Conditions - Tool automatically adjusts for market volatility (VIX)
Sector Specificity - Ratios automatically adjust based on company's sector
💡 Best Practice Recommendations
Supplement with Current Analysis - Always combine with recent news, earnings calls, and management guidance
Monitor Data Quality - Check when the underlying financial data was last updated
Consider Market Context - Factor in recent market events that may affect company performance
Use as Starting Point - Treat calculations as baseline analysis requiring additional research
🔗 Methodology
Based on established academic research and professional practices:
Benjamin Graham - Security Analysis principles
Joel Greenblatt - Magic Formula methodology
Edward Altman - Z-Score bankruptcy prediction
Joseph Piotroski - Fundamental analysis scoring
Messod Beneish - Earnings manipulation detection
Modern Portfolio Theory - Risk-adjusted decision making
This indicator is designed for educational and analytical purposes. Always conduct additional research and consider consulting with financial professionals before making investment decisions.
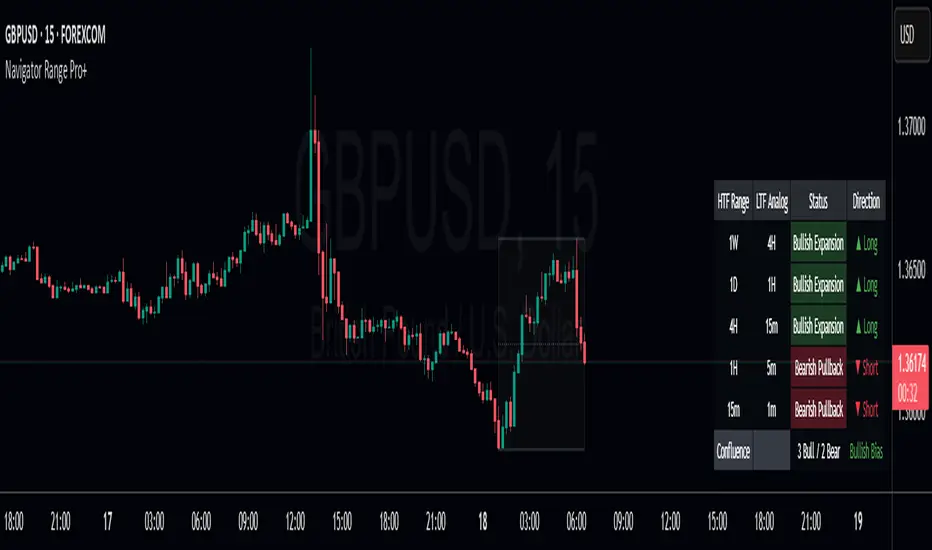
Navigator Range Pro+Title Navigator Range Pro+
What it is Navigator Range Pro+ is a confluence-first indicator that blends multi-timeframe (MTF) trend bias with a Dealing Range (DR) framework. It helps you quickly see when higher timeframes align and pairs that bias with clean breakout triggers from a current range. Designed to reduce noise and keep charts readable.
What you’ll see
Dealing Range: Auto-detected range top/bottom with a midline. Choose Stuck (pivot-based, fixed) or Dynamic (rolling highest/lowest) modes.
MTF Bias: Higher timeframe trend bias derived from a selectable moving average (SMA/EMA).
Compact Info Panel (table): A configurable on-chart panel that summarizes each higher timeframe’s bias, optional lower-timeframe analog labels, and a confluence tally. You can position it, resize text, and set columns/rows to fit your layout.
Clean Charting: Flip labels are optional and default to off, so alerts can fire without covering price action.
How it works
Bias engine: Computes bullish/bearish bias for each selected higher timeframe using your chosen MA length/type, then aggregates them into a confluence count.
DR engine: Finds or follows the current trading range and calculates a midline reference for signals or context.
Signals: You can use pure confluence, pure DR breakouts, or a combined “Bias + DR” confirmation for higher-quality entries.
Inputs to know
HTF Ranges (comma separated): Higher timeframes to assess (e.g., W,D,240,60,15).
MA Length/Type: Controls the bias engine’s sensitivity.
DR Mode: Stuck (pivot-based, fixed until a new pivot confirms) or Dynamic (rolling high/low by lookback).
Swing Length / Dynamic Lookback / Extend Right: Shape how the range is found and displayed.
Panel Position / Text Size / Panel Columns / Panel Rows: Customize the on-chart table.
Alerts: Min HTFs to align and Strict alignment (no opposite) to refine confluence.
Show Flip Labels on Chart: Optional visual flip labels; alerts are unaffected if kept off.
Alert conditions
Multi-TF Confluence Bullish: Minimum number of HTFs are bullish (optionally strict).
Multi-TF Confluence Bearish: Minimum number of HTFs are bearish (optionally strict).
DR Breakout Up: Close crosses above DR top.
DR Breakout Down: Close crosses below DR bottom.
Bias + DR Combo Bullish: Bullish confluence and price above your DR threshold (Midline or Top/Bottom).
Bias + DR Combo Bearish: Bearish confluence and price below your DR threshold (Midline or Top/Bottom).
Tips
For live trading, “Once per bar close” alerts are the safest and most consistent.
Increase the Min HTFs to align to reduce noise; switch Combo Threshold to Top/Bottom for fewer, stronger momentum entries.
Keep flip labels off to maintain a clean chart (alerts still fire).
Disclaimer This script is for educational and informational purposes only and does not constitute financial, investment, or trading advice. Trading involves risk, including the risk of loss. You are solely responsible for your own trading decisions. Past performance does not guarantee future results. Always test on a demo and consult a licensed professional where appropriate.
Mark Every Fair Value Gap (FVG) [Short Boxes + Dashed-on-Fill]marks out every fair valuer gap on everytime fraame

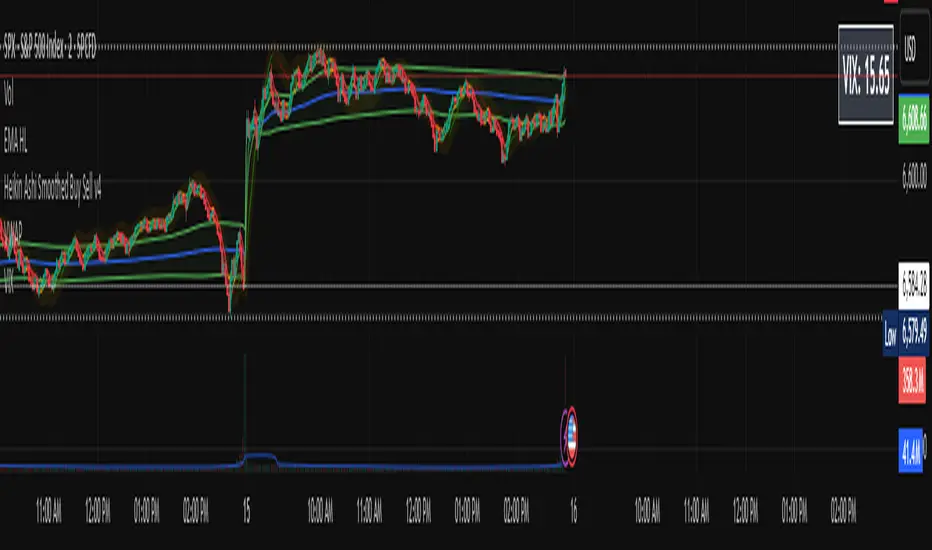
VIX Price BoxVIX Price Box (Customizable Colors)
This indicator displays the current VIX (CBOE Volatility Index) value in a fixed box on the top-right corner of the chart. It’s designed to give traders a quick, at-a-glance view of market volatility without needing to switch tickers.
Features
Pulls the live VIX price and updates automatically on every bar.
Displays the value inside a table box that stays fixed in the top-right corner.
Threshold-based coloring: the text color changes depending on whether the VIX is below, between, or above your chosen threshold levels.
5 built-in color modes:
Custom mode – choose your own colors for low, medium, and high volatility zones.
Adjustable threshold levels, background color, and frame color.
Use Cases
Monitor overall market risk sentiment while trading other instruments.
Identify periods of low vs. high volatility at a glance.
Pair with strategies that rely on volatility (options trading, hedging, breakout setups, etc.).
Support & ResistanceEnglish:
This indicator identifies support and resistance zones based on pivot points and high-volume areas.
It dynamically draws boxes to highlight key price levels where buying or selling pressure is concentrated.
Green zones = support (positive volume)
Red zones = resistance (negative volume)
Dashed boxes = breakout/failed support or resistance
Solid boxes = holding support or resistance
It also marks:
Resistance turning into support (R→S)
Support turning into resistance (S→R)
Breakout labels for quick recognition
This tool helps traders visually track volume-backed supply and demand zones to anticipate future price reactions.
中文 (Chinese):
本指标基于枢轴点与高成交量区域识别支撑与阻力。
它会动态绘制矩形框,标记价格在买卖力量集中的关键水平。
绿色区域 = 支撑(正成交量)
红色区域 = 阻力(负成交量)
虚线框 = 突破或失效的支撑/阻力
实线框 = 有效保持的支撑/阻力
同时标注:
阻力转为支撑 (R→S)
支撑转为阻力 (S→R)
突破标签,便于快速识别
该工具帮助交易者直观追踪成交量验证的供需区域,以便预判未来价格反应。

OG OHLC MarkerDraws, OHLC for Previous day and Today with options to add alerts when any PD Array is swept
Higher High Lower Low Higher High Lower Low 🦉{Phanchai} — TradingView Description
Structure detector with dynamic Support/Resistance, customizable labels, and ready-made alerts (Pine v6).
This script marks market structure turning points — HH (Higher High), HL (Higher Low), LH (Lower High), LL (Lower Low) — and builds segmented Support/Resistance lines from those turns. Labels and colors are fully customizable and the script ships with multiple alert conditions.
What it does
Detects swing pivots using left/right bar windows, then classifies each confirmed swing as HH/HL/LH/LL.
Plots compact labels at the confirmed pivot bars with tooltips (English).
Derives dynamic Support / Resistance : every time structure flips, the previous level is closed and a new segment starts, extending to the right .
Provides alert conditions for any label and for specific first-occurrence shifts (e.g., first HH after a bearish label).
How it works (in short)
A pivot high/low confirms only after Right Bars candles have closed; labels and S/R appear at that confirmation bar.
An internal backbone (zigzag-like) is built from confirmed pivots, with light consistency checks to avoid contradictory sequences.
Structure rules compare the recent five pivots (A…E) to decide HH/HL/LH/LL.
S/R is updated from structure: e.g., in an up leg, new HLs refresh Support; in a down leg, new LHs refresh Resistance.
Alerts included
Any structure label (HH/HL/LH/LL) — Fires on any new label.
First LL after HL/HH — First bearish break after a bullish label.
First HH after LL/LH — First bullish break after a bearish label.
LL or HL formed — Any low-side label.
LH or HH formed — Any high-side label.
HL formed
HH formed
LL formed
LH formed
How to use (quick start)
Add the indicator to your chart.
Choose Left/Right Bars for your timeframe (e.g., 5–10 for intraday; larger for higher timeframes).
Pick your label colors/sizes and S/R style.
Right-click the chart → Add alert… → Condition: this indicator → select the desired alert.
Notes & tips
Because pivots require Right Bars to confirm, labels and S/R appear with a natural delay of that many bars. This avoids repainting.
Raising Left/Right Bars reduces noise and increases the average distance between pivots; lowering them increases sensitivity.
Structure is strict: sometimes you may see two HL (or two LH) in a row if the intermediate opposite swing didn’t qualify as HH/LH (or LL/HL).
S/R segments are drawn with line objects ; they are controlled via Inputs (style/width/color), not the Style tab.
This tool highlights structure; it’s not a standalone entry/exit system. Combine with volume, trend, or risk management rules.
Built with Pine v6. Clean, compact labels; segmented S/R that updates only on confirmed changes; comprehensive alerts ready for automation.

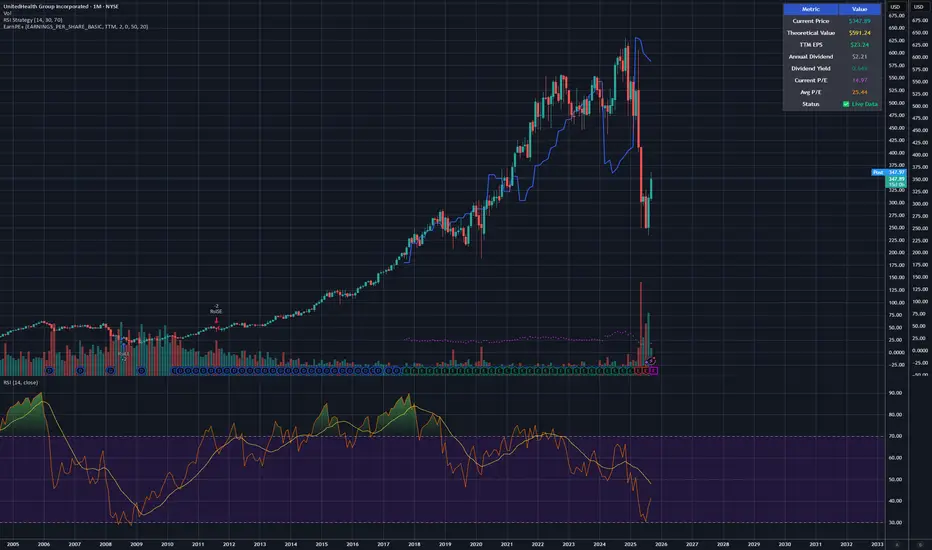
Earnings line & P/E Tracker# Earnings line & P/E Tracker
**A comprehensive fundamental analysis indicator that overlays earnings data and P/E ratios directly on your price charts.**
## 📊 Key Features
### Automatic Data Retrieval
- **Real-time financial data** pulled directly from TradingView's financial database
- **Multiple data sources**: Earnings Per Share (Basic/Diluted), Total Revenue, Net Income
- **Flexible periods**: TTM (Trailing Twelve Months), FQ (Quarterly), FY (Annual)
- **Live P/E ratio calculation** based on current price and TTM earnings
### Visual Display Options
- **Earnings progression line** overlaid on price chart for easy comparison
- **P/E ratio plot** with distinctive circle markers
- **Comprehensive data table** showing all key metrics in real-time
- **Dark mode optimized** with high-contrast colors for excellent readability
### Optional Event Tracking
- **Custom earnings dates** input for upcoming releases
- **Visual markers** on earnings announcement dates
- **Background highlighting** during earnings weeks
- **Smart alerts** for significant P/E changes and data updates
## 🎯 Perfect For
- **Fundamental analysts** comparing earnings growth vs stock price movement
- **Value investors** tracking P/E ratios and earnings trends
- **Earnings season trading** with visual release date markers
- **Long-term investors** monitoring fundamental health alongside technical analysis
## ⚙️ Customization Options
### Data Selection
- Choose between EPS Basic, EPS Diluted, Total Revenue, or Net Income
- Select TTM, quarterly, or annual reporting periods
- Toggle individual display elements on/off
### Visual Styling
- Customizable colors for earnings line, P/E ratio, and event markers
- Adjustable line width and styling options
- Moveable data table with size and position controls
### Event Management
- Input custom earnings release dates
- Enable/disable earnings event markers
- Background highlighting for earnings periods
- Configurable alert thresholds
## 📈 How It Works
1. **Automatic Detection**: The indicator automatically detects available fundamental data for your selected symbol
2. **Real-time Updates**: Financial metrics update as new data becomes available
3. **Visual Integration**: Earnings data is scaled and overlaid directly on your price chart
4. **Status Monitoring**: Clear indicators show data availability and freshness
## 🔧 Setup Instructions
1. Add the indicator to your chart
2. Select your preferred data source (EPS recommended for P/E tracking)
3. Choose time period (TTM recommended for most analyses)
4. Customize colors and display options to your preference
5. Optionally add upcoming earnings dates for event tracking
## 💡 Pro Tips
- **Use TTM EPS** for the most accurate P/E ratio calculations
- **Compare earnings line slope** with price movement to spot divergences
- **Enable earnings events** to prepare for volatility around announcements
- **Works best on daily/weekly timeframes** for fundamental analysis
## ⚠️ Data Availability
- Requires stocks with available fundamental data in TradingView's database
- Most major US stocks, ETFs, and international equities supported
- Limited data may be available for small-cap or recently listed companies
- Clear "No Data" indicator when fundamental data is unavailable
## 🎨 Display Features
- **High contrast colors** optimized for both light and dark chart themes
- **Clean, professional table** displaying all key metrics
- **Intuitive visual markers** for earnings events and data points
- **Responsive design** that adapts to different chart sizes
---
**Perfect for traders and investors who want to combine fundamental analysis with technical charting in a single, comprehensive view.**
## ⚠️ Important Disclaimer
**This indicator is provided for educational and informational purposes only. The author (raptor2030) is not responsible for:**
- **Data accuracy or completeness** - Financial data is sourced from TradingView's database and may contain errors, delays, or omissions
- **Trading decisions** - This tool should not be used as the sole basis for investment decisions
- **Financial losses** - Past performance does not guarantee future results
- **Data reliability** - Third-party data sources may experience outages or provide incorrect information
- **Market timing** - Earnings dates and projections may be inaccurate or outdated
**Always verify critical information from official company sources and consult with qualified financial professionals before making investment decisions.**
**Use this indicator at your own risk. The author disclaims all liability for any direct, indirect, or consequential damages arising from the use of this script.**
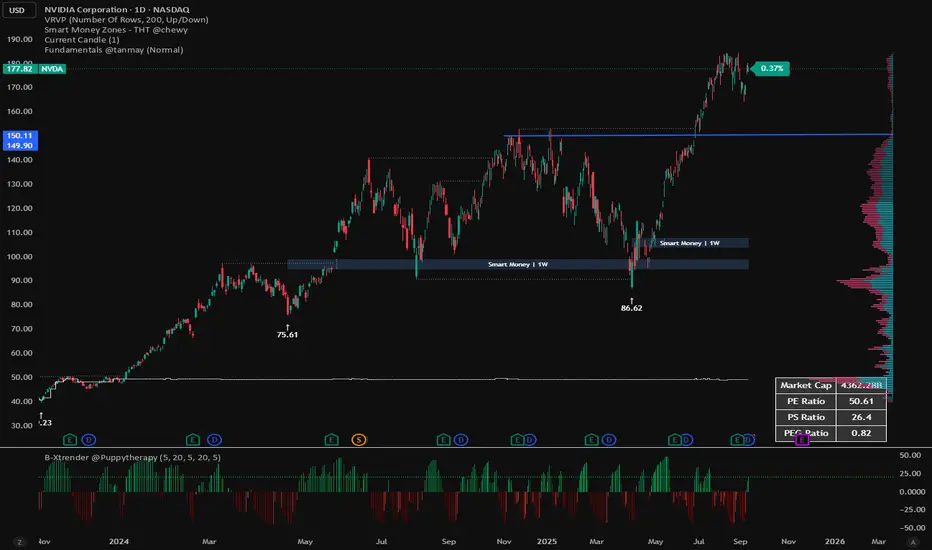
Fundamentals PanelFundamentals Panel Description
The Fundamentals Panel is a versatile Pine Script indicator that displays key financial metrics—Market Cap, P/E Ratio, P/S Ratio, and PEG Ratio—in a clean, customizable table on your TradingView chart. Designed for investors and traders, this tool brings essential company fundamentals directly to your chart, saving time and enhancing decision-making.
Quick Insights: View critical valuation metrics (Market Cap, P/E, P/S, PEG) at a glance without leaving your chart, ideal for fundamental analysis or screening stocks.
Customizable Display: Toggle each metric on or off via input settings to focus on what matters most to your strategy.
Adjustable Font Size: Choose from Small, Normal, or Large text sizes to ensure readability suits your chart setup and screen preferences.
Reliable Data: Pulls data directly from TradingView’s financial database, using diluted shares and trailing metrics for accuracy across most stocks.
Debugging Support: Includes hidden plots (visible in the Data Window) to verify raw data like shares outstanding, revenue, and PEG, helping you trust the numbers.
How It Works
The indicator fetches:
Market Cap: Calculated using diluted shares outstanding and current price.
P/E Ratio: Price divided by trailing twelve-month (TTM) diluted EPS.
P/S Ratio: Market cap divided by TTM total revenue.
PEG Ratio: Trailing PEG from TradingView’s data, with an additional calculated PEG for cross-checking.
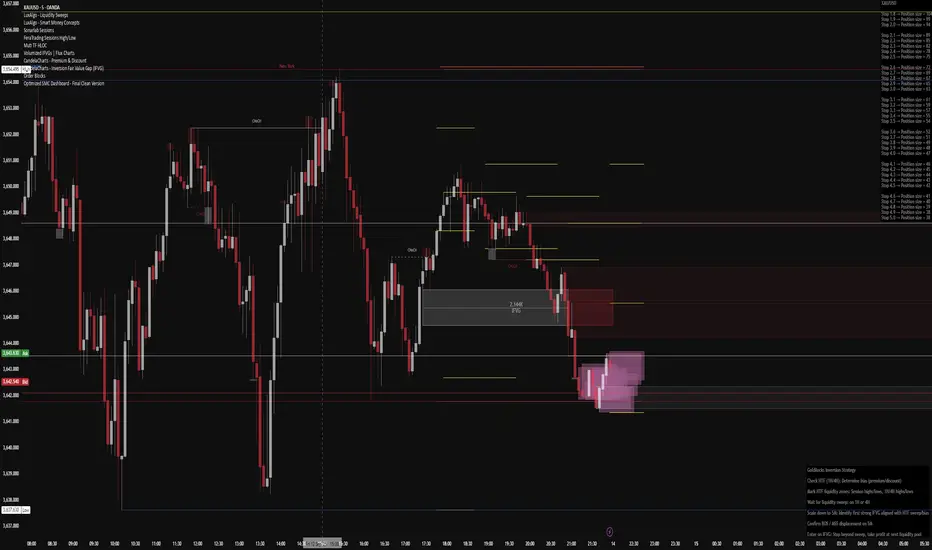
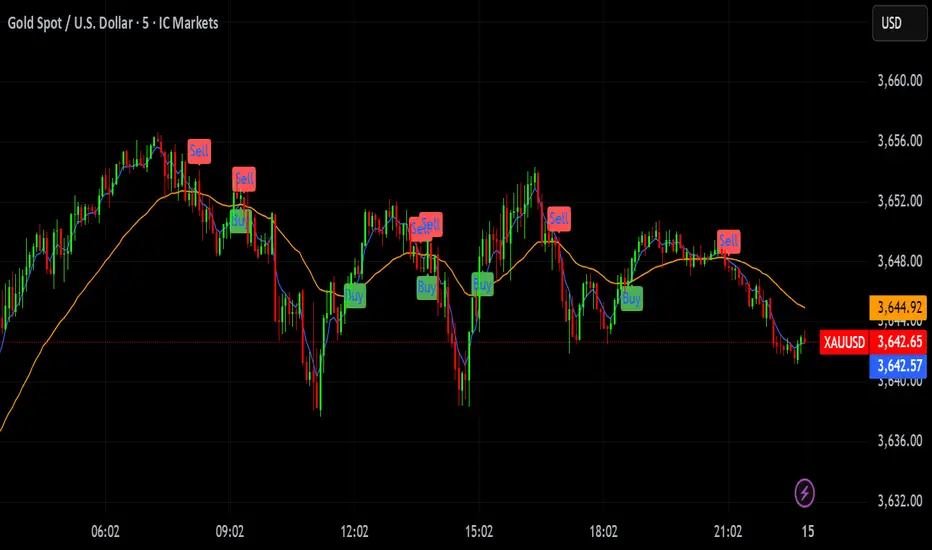
Optimized SMC Dashboard - by MinkyJuiceSMC - all in one
all SMC confluences are included, fully automated and customisable
enjoy, made by MinkyJuice
No Turd Burglars, please
FOMC Fund Rate 2022–2025(0.1)This indicator visualizes the Federal Open Market Committee (FOMC) meetings from 2022 through 2025.
It plots vertical lines on the announcement dates and attaches labels showing:
The decision (rate hike ⭡, cut ⭣, or hold ⭤).
The size of the rate change in percentage points.
The cumulative Federal Funds Rate path in parentheses.
Features:
Accurate timestamps for each FOMC meeting (UTC+1).
Customizable line style, width, and color.
Label color and text color options.
Placeholder labels for future meetings to maintain the timeline.
Use this script to keep track of historical Fed policy decisions and visualize the rate path over time directly on your chart.

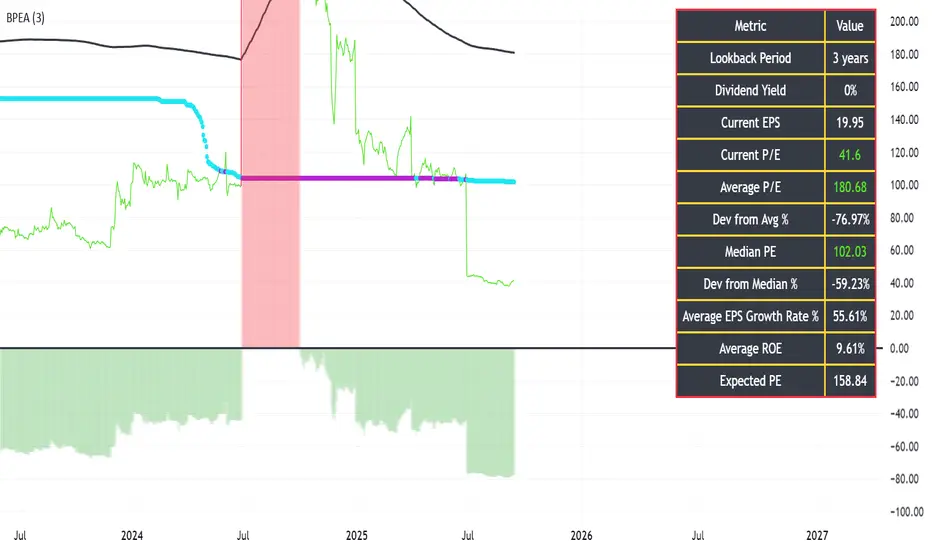
BLITZ PE ANAYLYZERFollowing script is designed specifically to meet the requirement of accessing the PE ratio, comparing it to it's historical averages, median and expected values that are possible.
Following is the method to use the indicator:
1) User must select the look back years which is by default set to 3 years as per the text book reference from the book "The Intelligent Investor" by Sir Benjamin Graham
2) The red or green histogram represents the deviation of the current PE to the average PE. If the histograms are green in color, it represent buy opportunity because the current PE is lower than that of the average PE values, the % deviation of the current PE from the average value is mentioned in the black color table and a negative value represents under evaluations as compared to the historical PE ratio
3) The black color line is the SMA of the PE ratio.
4) Another plots exists for plotting the current PE which is red or green depending upon its deviation from the average PE values & another plot exists for median PE ratio which is light blue when healthy and purple when not healthy.
5) Using the inflation data and the EPS growth of the company the black table also displays the expected value of the PE ratio for the stock.
Value Investing IndicatorThis is based on PeterNagy Indicator. I just update it from v.4 to v.6 and modify. Open for tweak

[DEM] Other Asset Predicting Indicator Other Asset Predicting Indicator is a cross-asset signal generator that uses technical signals from one market to predict price movements in the current chart's asset, based on the correlation between the two instruments. The indicator allows users to select from a comprehensive list of assets including major indices, sector ETFs, cryptocurrencies, forex pairs, country ETFs, and commodities, then applies one of four technical signal methods (Supertrend, Parabolic SAR, EMA Cross, or MACD Crossover) to generate buy and sell signals from the selected reference asset. A key feature is the built-in correlation analysis that calculates a rolling correlation coefficient between the current asset and the reference asset, displayed in a color-coded table where green indicates positive correlation (above 0.5) and red shows negative correlation (below 0.5). The indicator includes an option to invert signals for negatively correlated assets, making it particularly useful for identifying intermarket relationships and leveraging leading indicators from related markets to anticipate price movements in the current instrument.