RT-Bitcoin Funding CandlesIntroduction
The RT-Bitcoin Funding Candles indicator and the RT-Bitcoin Spot vs Perp Funding indicator are designed to visualize Bitcoin funding conditions using estimated spot versus perpetual futures pricing. Together, they help traders see how funding has been behaving and where leveraged traders may be leaning over time. These two indicators are meant to be used together, and this write-up will cover how to utilize both tools.
The RT-Bitcoin Funding Candles indicator converts estimated funding information into custom candle colors on the chart. The RT-Bitcoin Spot vs Perp Funding indicator shows the same concept in a separate panel, similar to how many traders use RSI or other oscillators.
Both tools are intended as context layers around funding behavior, not standalone signal generators. RT-Bitcoin Funding Candles Indicator
The RT-Bitcoin Funding Candles indicator uses estimated differences between Bitcoin spot prices and perpetual futures prices to color each candle based on whether conditions are more aligned with bullish leveraged positioning or bearish spot-driven pressure.
In general terms: When perpetual futures trade at a premium to spot for extended periods, conditions are often associated with more aggressive leveraged long positioning.
When perpetual futures trade at a discount to spot, conditions can indicate stress on leveraged longs or periods where spot demand is stronger relative to perp. The indicator converts this estimated spot versus perp relationship into a color scale on the candles:
Bullish / Leveraged Funding Scale
Dark Blue → Blue → Light Blue → White
Bearish / Spot Funding Scale
Dark Red → Red → Orange → Yellow This allows traders to look at a BTC chart and quickly see whether estimated funding has been skewed toward leveraged longs or more spot-driven pressure during each candle.
Displaying Funding Candles On Top Of Price
By default, some chart layouts may draw the RT-Bitcoin Funding Candles indicator behind the main price candles. To make the funding candles fully visible: Right click on the RT-Bitcoin Funding Candles indicator on your chart.
Select Visual Order .
Choose Bring to Front . Once this is done, the funding candles will sit on top of or replace the normal bar colors, making the funding bias easier to see at a glance.
RT-Bitcoin Funding Candles Settings
The RT-Bitcoin Funding Candles indicator includes a small set of tuning options so traders can control which exchange data is used and how sensitive the color transitions are.
Key settings include:
Exchange Selection
Allows the trader to select which funding source is used for the calculation. Common options include: Binance, Deribit and Bybit. This lets traders align the indicator with the exchange they track most closely.
Smoothness Adjuster
Controls how sensitive the candle colors are to short-term changes in the spot versus perp relationship. Lower smoothing values will make colors react more quickly, but can be noisier. Higher smoothing values will make colors change less often, focusing on more persistent funding conditions. Customizing Funding Candle Colors
Traders who prefer different color palettes can customize the funding candle colors in the Style tab of the indicator settings. Open the RT-Bitcoin Funding Candles indicator settings.
Go to the Style tab.
Adjust the colors and opacities for each bullish and bearish funding color step.
This allows traders to keep the same logic while matching the visuals to their own chart themes.
RT-Bitcoin Spot vs Perp Funding Indicator
The RT-Bitcoin Spot vs Perp Funding indicator presents the same core concept in a separate, oscillator-style panel, similar to how traders might use RSI or other momentum tools.
Instead of recoloring the main candles, it plots lines that reflect how strong the estimated spot versus perp funding relationship has been over time. This can make it easier to compare current conditions to previous periods and to see when funding has moved into more extreme zones. RT-Bitcoin Spot vs Perp Funding Settings
The RT-Bitcoin Spot vs Perp Funding indicator provides a set of inputs so traders can tune how the estimated funding lines behave visually:
Premium Sensitivity
Controls how sensitive the plotted lines are to changes in the underlying estimated spot versus perp relationship. Higher sensitivity will cause the lines to move more aggressively. Lower sensitivity will smooth smaller fluctuations and focus on larger swings.
Premium Smoother
Applies additional smoothing to the raw estimated funding data. Because the underlying data can be noisy in its raw form, this setting helps reduce erratic spikes so that major shifts in funding are easier to read.
Exchange Toggles
Allows the trader to choose which exchanges are displayed in the panel. For example: Show or hide Binance funding lines.
Show or hide Deribit funding lines.
Show or hide Bybit funding lines. If multiple exchanges are enabled, multiple lines can be displayed for comparison.
Line Colors
Line colors and thickness can be adjusted in the Style tab. This makes it possible to:
Assign different colors to each exchange.
Emphasize key lines while de-emphasizing others. How Traders Commonly Use These Tools
The RT-Bitcoin Funding Candles and the RT-Bitcoin Spot vs Perp Funding indicators are typically used as part of a broader BTC workflow rather than on their own. Common usage patterns include: Context Around Extremes
Comparing current estimated funding conditions to past extremes to see when funding has become unusually one-sided relative to history.
Trend And Funding Alignment
Studying whether strong trends are being supported by consistent estimated leveraged funding, or whether price is moving against the prevailing estimated funding bias.
Multi Tool Confluence
Combining estimated funding candles or the spot versus perp panel with other tools such as RT-Main Indicator, Machine Learning Reversion Bands, or pivots to build a more complete picture of market conditions.
Exchange Comparison
Using the Spot vs Perp Funding panel to compare how different exchanges are pricing estimated funding at the same time and to see when one venue becomes an outlier. In all cases, these indicators are intended to provide an additional layer of information about how spot and perp markets have been behaving. They are not designed to be automatic entry or exit systems.
Important Note
The RT-Bitcoin Funding Candles and the RT-Bitcoin Spot vs Perp Funding indicators use chart-based calculations and publicly available pricing to approximate funding behavior. They do not access private exchange order books or actual liquidation feeds, do not reveal real trader positions, and cannot guarantee that any specific funding condition will lead to a particular price move.
These tools are intended to provide additional context around funding, positioning, and potential areas of interest. They are not standalone signal generators and should always be used together with your own analysis, testing, and risk management. Historical funding patterns or past interactions with these indicators do not guarantee future results.
🐋 Tight lines and happy trading!
Funding

RT-Bitcoin Spot vs Perp FundingIntroduction
The RT-Bitcoin Funding Candles indicator and the RT-Bitcoin Spot vs Perp Funding indicator are designed to visualize Bitcoin funding conditions using estimated spot versus perpetual futures pricing. Together, they help traders see how funding has been behaving and where leveraged traders may be leaning over time. These two indicators are meant to be used together, and this write-up will cover how to utilize both tools.
The RT-Bitcoin Funding Candles indicator converts estimated funding information into custom candle colors on the chart. The RT-Bitcoin Spot vs Perp Funding indicator shows the same concept in a separate panel, similar to how many traders use RSI or other oscillators.
Both tools are intended as context layers around funding behavior, not standalone signal generators. RT-Bitcoin Funding Candles Indicator
The RT-Bitcoin Funding Candles indicator uses estimated differences between Bitcoin spot prices and perpetual futures prices to color each candle based on whether conditions are more aligned with bullish leveraged positioning or bearish spot-driven pressure.
In general terms: When perpetual futures trade at a premium to spot for extended periods, conditions are often associated with more aggressive leveraged long positioning.
When perpetual futures trade at a discount to spot, conditions can indicate stress on leveraged longs or periods where spot demand is stronger relative to perp. The indicator converts this estimated spot versus perp relationship into a color scale on the candles:
Bullish / Leveraged Funding Scale
Dark Blue → Blue → Light Blue → White
Bearish / Spot Funding Scale
Dark Red → Red → Orange → Yellow This allows traders to look at a BTC chart and quickly see whether estimated funding has been skewed toward leveraged longs or more spot-driven pressure during each candle.
Displaying Funding Candles On Top Of Price
By default, some chart layouts may draw the RT-Bitcoin Funding Candles indicator behind the main price candles. To make the funding candles fully visible: Right click on the RT-Bitcoin Funding Candles indicator on your chart.
Select Visual Order .
Choose Bring to Front . Once this is done, the funding candles will sit on top of or replace the normal bar colors, making the funding bias easier to see at a glance.
RT-Bitcoin Funding Candles Settings
The RT-Bitcoin Funding Candles indicator includes a small set of tuning options so traders can control which exchange data is used and how sensitive the color transitions are.
Key settings include:
Exchange Selection
Allows the trader to select which funding source is used for the calculation. Common options include: Binance, Deribit and Bybit. This lets traders align the indicator with the exchange they track most closely.
Smoothness Adjuster
Controls how sensitive the candle colors are to short-term changes in the spot versus perp relationship. Lower smoothing values will make colors react more quickly, but can be noisier. Higher smoothing values will make colors change less often, focusing on more persistent funding conditions. Customizing Funding Candle Colors
Traders who prefer different color palettes can customize the funding candle colors in the Style tab of the indicator settings. Open the RT-Bitcoin Funding Candles indicator settings.
Go to the Style tab.
Adjust the colors and opacities for each bullish and bearish funding color step.
This allows traders to keep the same logic while matching the visuals to their own chart themes.
RT-Bitcoin Spot vs Perp Funding Indicator
The RT-Bitcoin Spot vs Perp Funding indicator presents the same core concept in a separate, oscillator-style panel, similar to how traders might use RSI or other momentum tools.
Instead of recoloring the main candles, it plots lines that reflect how strong the estimated spot versus perp funding relationship has been over time. This can make it easier to compare current conditions to previous periods and to see when funding has moved into more extreme zones. RT-Bitcoin Spot vs Perp Funding Settings
The RT-Bitcoin Spot vs Perp Funding indicator provides a set of inputs so traders can tune how the estimated funding lines behave visually:
Premium Sensitivity
Controls how sensitive the plotted lines are to changes in the underlying estimated spot versus perp relationship. Higher sensitivity will cause the lines to move more aggressively. Lower sensitivity will smooth smaller fluctuations and focus on larger swings.
Premium Smoother
Applies additional smoothing to the raw estimated funding data. Because the underlying data can be noisy in its raw form, this setting helps reduce erratic spikes so that major shifts in funding are easier to read.
Exchange Toggles
Allows the trader to choose which exchanges are displayed in the panel. For example: Show or hide Binance funding lines.
Show or hide Deribit funding lines.
Show or hide Bybit funding lines. If multiple exchanges are enabled, multiple lines can be displayed for comparison.
Line Colors
Line colors and thickness can be adjusted in the Style tab. This makes it possible to:
Assign different colors to each exchange.
Emphasize key lines while de-emphasizing others. How Traders Commonly Use These Tools
The RT-Bitcoin Funding Candles and the RT-Bitcoin Spot vs Perp Funding indicators are typically used as part of a broader BTC workflow rather than on their own. Common usage patterns include: Context Around Extremes
Comparing current estimated funding conditions to past extremes to see when funding has become unusually one-sided relative to history.
Trend And Funding Alignment
Studying whether strong trends are being supported by consistent estimated leveraged funding, or whether price is moving against the prevailing estimated funding bias.
Multi Tool Confluence
Combining estimated funding candles or the spot versus perp panel with other tools such as RT-Main Indicator, Machine Learning Reversion Bands, or pivots to build a more complete picture of market conditions.
Exchange Comparison
Using the Spot vs Perp Funding panel to compare how different exchanges are pricing estimated funding at the same time and to see when one venue becomes an outlier. In all cases, these indicators are intended to provide an additional layer of information about how spot and perp markets have been behaving. They are not designed to be automatic entry or exit systems.
Important Note
The RT-Bitcoin Funding Candles and the RT-Bitcoin Spot vs Perp Funding indicators use chart-based calculations and publicly available pricing to approximate funding behavior. They do not access private exchange order books or actual liquidation feeds, do not reveal real trader positions, and cannot guarantee that any specific funding condition will lead to a particular price move.
These tools are intended to provide additional context around funding, positioning, and potential areas of interest. They are not standalone signal generators and should always be used together with your own analysis, testing, and risk management. Historical funding patterns or past interactions with these indicators do not guarantee future results.
🐋 Tight lines and happy trading!

Spot-Futures SpreadSpot-Futures Spread Indicator
A comprehensive indicator that automatically calculates and visualizes the percentage spread between spot and perpetual futures prices across multiple exchanges.
Key Features:
Automatic Exchange Detection - Automatically detects your current exchange and finds the corresponding spot/futures pair
Smart Fallback System - If the counterpart isn't available on your exchange, it automatically searches across 7+ major exchanges (Binance, Bybit, OKX, Gate.io, MEXC, KuCoin, HTX) and uses the first valid match
Multi-Exchange Support - Works with 14 exchanges including Binance, Bybit, OKX, MEXC, BitGet, Gate.io, KuCoin, and more
Clear Exchange Attribution - Shows exactly which exchanges are providing spot and futures data in the statistics table
Configurable Moving Average - Track the average spread with customizable period
Standard Deviation Bands - Identify unusual spread conditions with Bollinger-style bands
Built-in Alerts - Get notified when spread crosses bands or zero (parity)
Statistics Table - Real-time stats showing current spread, MA, std dev, and bands
Manual Override Options - Advanced users can manually specify exchanges and symbols
How It Works:
The indicator calculates the spread as: (Futures Price - Spot Price) / Spot Price × 100
Positive spread = Futures trading at a premium (contango)
Negative spread = Futures trading at a discount (backwardation)
Zero = Parity between spot and futures
Use Cases:
Funding Rate Analysis - Correlates with perpetual funding rates
Arbitrage Opportunities - Identify significant spot-futures divergences
Market Sentiment - Premium/discount indicates bullish/bearish positioning
Cross-Exchange Analysis - Compare spreads when spot and futures are on different exchanges
Smart Features:
Works whether you're viewing a spot or futures chart
Automatically handles exchange-specific perpetual contract naming (.P, PERP, SWAP, etc.)
Color-coded visualization (green for premium, red for discount)
Customizable colors and display options
Background shading based on spread direction
Perfect For:
Crypto traders monitoring funding rates, arbitrage traders, market makers, and anyone interested in spot-futures dynamics across multiple exchanges.
Getting Started:
Simply add the indicator to any spot or perpetual futures chart. It will automatically detect the exchange and find the corresponding pair. The statistics table shows which exchanges are being used for maximum transparency.
Note: The indicator automatically ignores invalid symbols, so you'll never see errors even if a specific pair doesn't exist on a particular exchange.
Kudos to @AlekMel that made the "Spot - Fut Spread v2" indicator that I enhance the Automatic detection feature which was not working in some case.

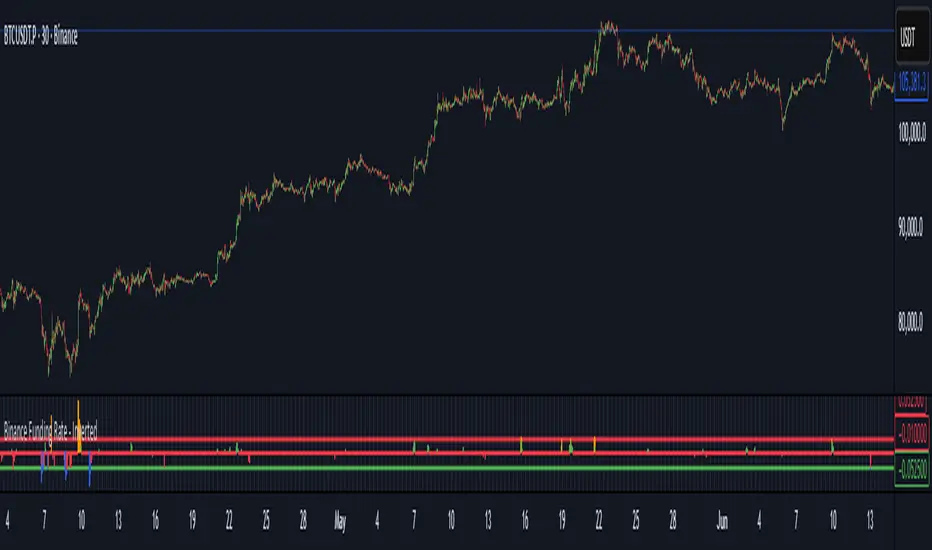
Binance Funding Rate - InvertedThe Funding Rate Formula
-Binance uses this formula every 8 hours:
-Funding Rate = Premium Index + clamp(Interest Rate - Premium Index, -0.05%, +0.05%)
-Breaking this down:
Premium Index:
-Measures the difference between futures price and spot price
-Interest Rate: Fixed at 0.01% per 8 hours (0.03% daily)
-Clamp Function: Limits the adjustment to ±0.05%, preventing extreme swings
When futures trade above spot (bullish sentiment), the funding rate becomes positive and longs pay shorts. When futures trade below spot (bearish sentiment), it becomes negative and shorts pay longs. This mechanism keeps perpetual futures prices aligned with spot prices.
How to Read This Indicator
The Inverted Display:
-This indicator flips the traditional display to make it more intuitive:
-Green bars pointing up = Negative funding (shorts paying) = Bullish pressure
-Red bars pointing down = Positive funding (longs paying) = Bearish pressure
The Clamp Lines:
-Green line at bottom: Maximum positive funding (-0.06% inverted)
-Red line at top: Maximum negative funding (+0.04% inverted)
-When bars hit these lines and turn blue/orange, it signals extreme market positioning
Practical Trading Applications
1. Identifying Market Extremes
-Small bars (near zero): Balanced market
-Growing bars: Building directional bias
-Bars at clamp lines: Maximum pain for one side, potential reversal
2. Timing Entries/Exits
-Blue bars at bottom: Longs are capitulating, consider buying
-Orange bars at top: Shorts are capitulating, consider selling
-But remember: extremes can persist longer than expected
3. Managing Costs
Check the Data Window (hover over chart) for:
-Actual Funding %: What you'll pay/receive
-Cumulative Fund %: Total impact over your selected period
-If holding positions against the funding direction, you're paying fees 3 times daily
Optimal Usage
-Timeframe: Use 30-minute to 8-hour charts only
-30m: Most responsive to changes
-4h: Cleaner trends
-8h: Aligns with funding periods
Auto-Clamp Setting: Keep enabled - it automatically adjusts the clamp ranges for different timeframes
Risk Considerations
-Funding ≠ Price Direction: High funding doesn't guarantee immediate reversal
-Costs Accumulate: 0.01% three times daily = 10.95% annually
-Whipsaw Risk: Funding can reverse quickly during volatile periods
-Not Standalone: Always confirm with price action and volume
Simple Decision Framework
-Persistent red bars + holding longs = You're bleeding fees
-Persistent green bars + holding shorts = You're bleeding fees
-Bars hitting clamps = Extreme positioning, watch for reversal
-Bars crossing zero = Sentiment shifting
Data Window Values
To see detailed metrics:
-Move cursor over any candle
-Or press Alt+D (Windows) / Option+D (Mac) to open Data Window panel
Key values to monitor:
-Actual Funding %: Real rate (not inverted)
-Cumulative Fund %: Your P&L impact from funding
-Momentum: Rate of change in funding
Remember: This indicator shows market positioning extremes, not guaranteed reversal points. Extreme funding can persist during strong trends. Use it as one input among several for decision-making, not as a sole trading signal.
Binance Pseudo Funding FeeThe indicator calculates the Funding Fee for Binance based on the Premium Index provided by TradingView. The calculation formula can be found here: Binance Funding Rate Introduction . This is NOT the official rate visible on binance.com and used for settlements, but rather an estimated rate, which is inherently INACCURATE . The accuracy of the calculation heavily depends on the timeframe, with almost perfect results on minute-based timeframes.
For the most accurate calculations, you need to visit Binance Funding History and fill in the corresponding Interval , Interest Rate , and Funding Cap/Floor settings for the specific symbol in the indicator's settings. I understand this is not convenient, but for now, this is how it works.
The blue bars indicate the settlement time. Funding can be smoothed using moving averages. Both the funding rate and the moving averages are displayed using plot and are labeled, so you can set alerts on them.

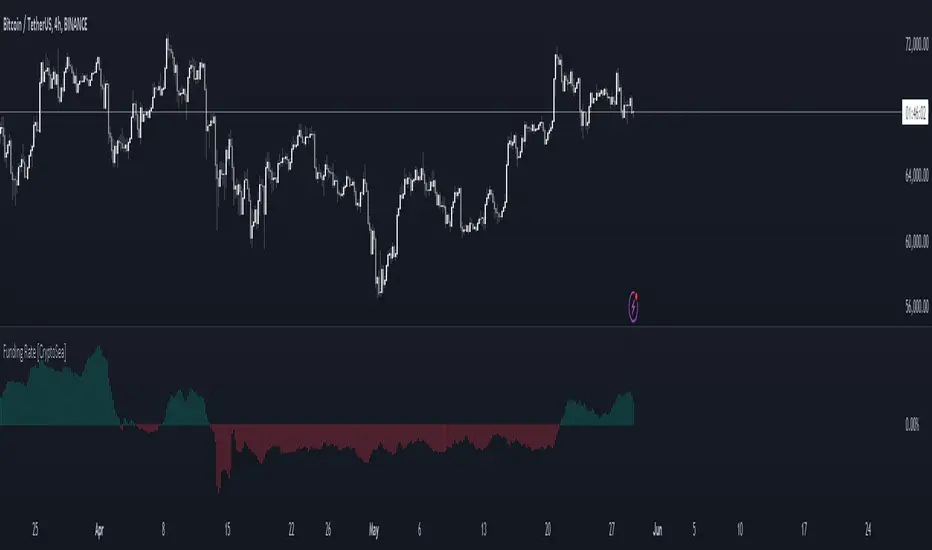
Funding Rate [CryptoSea]The Funding Rate Indicator by is a comprehensive tool designed to analyze funding rates across multiple cryptocurrency exchanges. This indicator is essential for traders who want to monitor funding rates and their impact on market trends.
Key Features
Exchange Coverage: Includes data from major exchanges such as Binance, Bitmex, Bybit, HTX, Kraken, OKX, Bitstamp, and Coinbase.
Perpetual Futures and Spot Markets: Fetches and analyzes pricing data from both perpetual futures and spot markets to provide a holistic view.
Smoothing and Customization: Allows users to smooth funding rates using a moving average, with customizable MA lengths for tailored analysis.
Dynamic Candle Coloring: Option to color candles based on trading conditions, enhancing visual analysis.
In the example below, the indicator shows how the funding rate shifts with market conditions, providing clear visual cues for bullish and bearish trends.
How it Works
Data Integration: Uses a secure security fetching function to retrieve pricing data while preventing look-ahead bias, ensuring accurate and reliable information.
TWAP Calculation: Computes Time-Weighted Average Prices (TWAP) for both perpetual futures and spot prices, forming the basis for funding rate calculations.
Funding Rate Calculation: Determines the raw funding rate by comparing TWAPs of perpetual futures and spot prices, then applies smoothing to highlight significant trends.
Color Coding: Highlights the funding rate with distinct colors (bullish and bearish), making it easier to interpret market conditions at a glance.
In the example below, the indicator effectively differentiates between bullish and bearish funding rates, aiding traders in making informed decisions based on current market dynamics.
Application
Market Analysis: Enables traders to analyze the impact of funding rates on market trends, facilitating more strategic decision-making.
Trend Identification: Assists in identifying potential market reversals by monitoring shifts in funding rates.
Customizable Settings: Provides extensive input settings for exchange selection, MA length, and candle coloring, allowing for personalized analysis.
The Funding Rate Indicator by is a powerful addition to any trader's toolkit, offering detailed insights into funding rates across multiple exchanges to navigate the cryptocurrency market effectively.
Aggregated Funding RateAFR - A tool designed for traders who demand real-time, comprehensive insights into funding rates across various exchanges. This script stands out in its ability to aggregate and analyze funding rates from 9 different exchanges , offering unparalleled depth and breadth in market analysis.
Key Features:
Real-Time Monitoring Across Multiple Exchanges: Seamlessly tracks funding rates from top exchanges including Binance, Bybit, Bitmex, Bitget, OKX, and more, ensuring a broad market view.
Sophisticated Algorithms for Accurate Calculations: Each exchange has unique algorithms for funding rate calculation. This script accounts for these variations, providing precise, reliable data. It is important to note that exact calculations are not possible on TradingView due to data limitations; there is no direct access to order books, so for some parts, generalizations have been made.
Dual Modes for Enhanced Understanding:
Standard Mode: Displays the current funding rate as is, for immediate insight.
Annualized Mode: Projects the funding rate on an annual basis, offering a perspective on long-term trends and impacts.
Weighted Analysis Options:
Average Mode: Treats each exchange equally, providing a balanced overview.
Weighted Mode: Adjusts the influence of each exchange based on their perpetual trading volume, offering a nuanced, market-relevant view.
Customizable Exchange Selection: Users have the flexibility to include or exclude specific exchanges from the calculation, allowing for tailored analysis based on personal trading strategies.
User-Friendly Visualization: The script features clear, intuitive plots and color-coded visuals to make data interpretation straightforward and effective.
Versatility in Timeframes: Designed to be adaptable across any timeframe, this tool is equally effective whether you are looking at a 1-minute interval or longer durations. This makes it an indispensable tool for both high-frequency traders and those analyzing broader market trends.
As always, use this indicator in tandem with other tools. This is a very useful indicator, but one should always rely on self-made, backtested and forward tested strategies

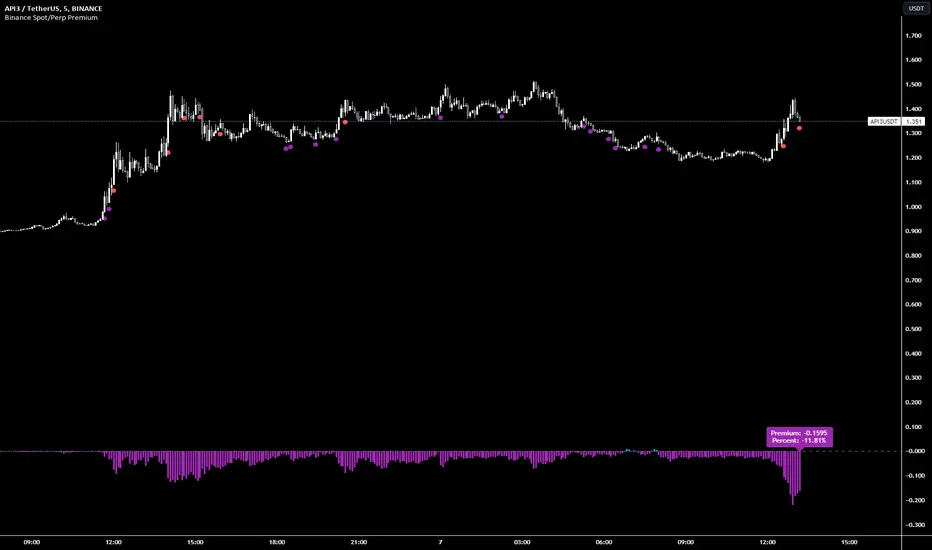
Binance Spot/Perp Premium | PCPR1NCIPALBinance Spot/Perp Premium Indicator
This indicator visually shows the price difference (called "Premium") between the perpetual contract and the spot market of a particular cryptocurrency on Binance.
Histogram: Displays the premium amount. Positive values are shown in blue and negative values in purple.
Blue Circle: Appears below the bar when the premium goes over 1% and there hasn't been a purple circle in the past 90 minutes.
Purple Circle: Appears below the bar when the premium drops below -1% and there hasn't been a blue circle in the past 90 minutes.
Green Circle: Shows up below the bar when the premium exceeds 5%. A new circle can appear every 15 minutes if the condition is met.
Red Circle: Appears below the bar when the premium drops more than -5%. After a red circle, there's a 30-minute cooldown before another can appear.
A label at the bottom displays the current premium amount and its percentage, helping users quickly gauge the market situation.
Multi-Exchange Funding RatesThis indicator estimates funding rates by comparing a spot-index price vs a futures index price.
It currently allows you to select your own spot-index combination and compare it to a particular exchange future price.
This script is under development, any feedback is welcome!
Limitations
Supported tickers
The supported tickers are: BTC , ETH
More will be available soon
Supported exchanges
The supported tickers are: Binance, OKX and Kucoin
More will be available soon

Trendmaster - Collated Funding RatesCollated Funding Rates is a Crypto Specific Indicator that pulls Exchange Funding Rate Data from several exchanges for both Bitcoin and Ethereum.
By combining both the Funding Data for Bitcoin and Ethereum across several exchanges, a Trader can see the Collated Funding Rates from several Crypto Exchanges.
What are Funding Rates?
Funding rates are periodic payments either to traders that are long or short based on the difference between perpetual contract markets and spot prices.
Therefore, depending on open positions, traders will either pay or receive funding. Crypto funding rates prevent lasting divergence in the price of both markets
These Funding Rates also incentivize Liquidity Providers to take certain positions whether Long or Short based on the Funding Rate.
What are Liquidity Providers?
A Liquidity Provider, also known as a Market Maker, is someone who provides their crypto assets to a platform to help with the decentralization of trading.
In return, they are rewarded with fees generated by trades on that platform, which can be thought of as a form of passive income.
H ow to use Collated Funding Rates:
When the Funding Rate is positive, the price of the perpetual contract is usually higher than the market price.
Thus, traders who are long pay for short positions. Conversely, a negative Funding Rate means that short positions pay for longs.
As the funding rate increases from negative to positive Traders and Liquidity Providers are incentivized to take short positions.
This can be seen on the indicator as it moves from down to up and changes from red to green.
As the funding rate decreases from positive to negative Traders and Liquidity Providers are incentivized to take long positions.
This can be seen on the indicator as it moves from up to down and changes from green to red.
Funding Rates are used by Exchanges to manipulate the price.
Because of this fact, Collated Funding Rates can show trend changes based on when a specific up or down move in Price is incentivized by Exchange Funding Rates.

[FTX Funding Colored Candles] [third eye]This Indicator plots FTX: BTCPERP predicted funding rates and colours the candlesticks based on it.
!!!
Since Tradingview always plots new indicators at the back you might have to click:
Name of the Indicator ( ) -> More -> Visual Order -> Bring to Front
(unfortunately, there is no way for me to do this in pinescript)
There is also the possibility to change colors in the Settings:
It is grouped by where Basis is (FTX:BTCPERP - FTX Spot index)
Changing that might be good for getting a more close up view of LTF price action.
Also to get rid of the Values in the Status line click on Settings and scroll to the bottom to disable "Value in Status Line"
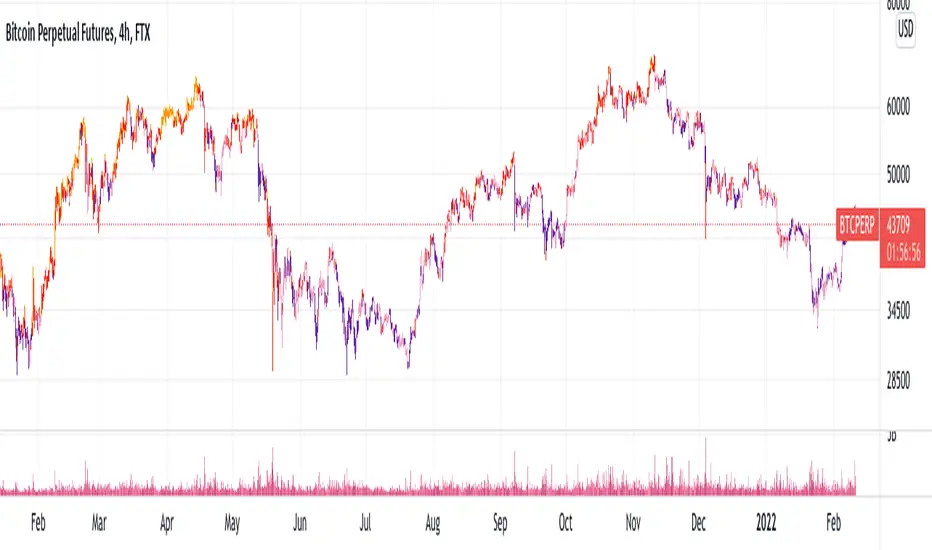
Bitmex BTC Perpetual Premium and FundingThis script tracks the premium (default red line) and the funding rate (default yellow area) of the Bitmex XBTUSD pair perpetual contract.
The calculations are based on the 8H TWAP of interest rates and premium index from Bitmex.
[VIP] Composite BTC Funding Rate APR
Calculates and displays a BTC funding rate (positive or negative) in terms of APR. Positive APR = Positive funding. Negative APR = Negative funding
This calculation is sourced from a variety of spot and perpetual markets on a couple of top-volume exchanges, Binance, FTX, etc.
This logic is utilized in Dip Hunter and Take Profit Hunter
Code is open source! All feedback and improvements encouraged

FTX Funding RatesIndexes updated: 2021-07-27
This study tries to estimate the FTX funding rate using historical data and index definitions provided by FTX. The funding rate calculated is not exactly the same as FTX reports due to underlying limitations in TV.
Limitations
1. TWAP
FTX calculates the index price by TWAP which is average every 5s over the the whole hour. As far as I know, it's not possible to do this in Tradingview.
2. Change in INDEX definition
If a definition of an index changes in FTX, then this script is of course not up-to-date. Also, if a security is added to an index, then the historical funding rate will also change, even though said security wasn't apart of the past funding rate.
3. Supported tickers
The supported tickers are: BTC, ETH, SOL, ALGO, SAND, CLV and AXS

Funding Rate for FTX:BTCPERP (estimated) v0.1 Original credits goes to @Hayemaker, and @NeoButane for the TWAP portions of this script
By @davewhiiite, 2021-03-27
Version 0.1
Summary: The funding rate is the interest charged / credited to a perpetual futures trader for taking a long or short position. The direction of the funding rate is used as an indicator of trader sentiment (+ve = bullish; -ve = bearish), and therefore useful to plot in real time.
The FTX exchange has published the calculation of their funding rate as follows:
TWAP((future - index) / index) / 24
The formula here is the same, but expresses it in the more common % per 8hr duration:
funding = TWAP((future / index) - 1) * (8 / 24) * 100
For reference: future refers to the FTX bitcoin futures contract price (FTX:BTCPERP) and index is the spot price of bitcoin on the exchange (FTX:BTCUSD)
Additional notes:
Probably best to add to the indicator to a new pane, or as secondary axis
Plot this in combination with FTX:BTCPERP or FTX:BTCUSD, or chart of your choice to complement your bitcoin dashboard
Compare to funding rates published on ViewBase
questions? Ask me!
Binance Funding IndicatorThis sciprt tried to emulate the Binance Futures Funding rate based on it's official document www.binance.com .
The indicator shows three serises:
Raw Premium
Realtime Funding
History Funding
On Binance Futures, Funding occurs every 8 hours at 00:00 UTC; 08:00 UTC and 16:00 UTC.
The results were calculated by the fomula provided by Binance Support document.
But due to the time inaccuracy, the indicator may not always show the exact funding rate as same as the website shows.
If you have any suggestions please leave your comments below.

Black Flamingo FundingThe Black Flamingo Funding is an indicator that aims to guide the price prediction, by informing on the historical and current value of the predicted funding rate of the future markets of many coins.
It displays an approximation of FTX and Bitmex funding rates for all coins where there is a perpetual future market.
The displayed funding is more accurate on the 1min timeframe, but it have a reasonable approximation on any timeframe.
The Black Flamingo Funding displays on the chart the following components :
- The FTX funding rate on the perpetual market of the displayed coin
- The Bitmex funding rate on the perpetual market of the displayed coin
- In two labels at the right, the current value of these fundings
- Vertical grey bars showing the Bitmex funding times, and the next one
The funding rate is a measure of the greediness of speculators in long or short direction. Analyzing the variation of this funding over the time provides great value to predict the market.
The first use of this indicator is :
- when the market is trending up, to search for buy zone when the funding is negative, and search for sell zone when the funding is greatly positive.
- when the market is trending down, to search for sell zone when the funding is positive, and search for buy zone when the funding is greatly negative.
This indicators is only accessible on invitation. Please contact me in PM or thisma (fr.tradingview.com) in order to request us an access.
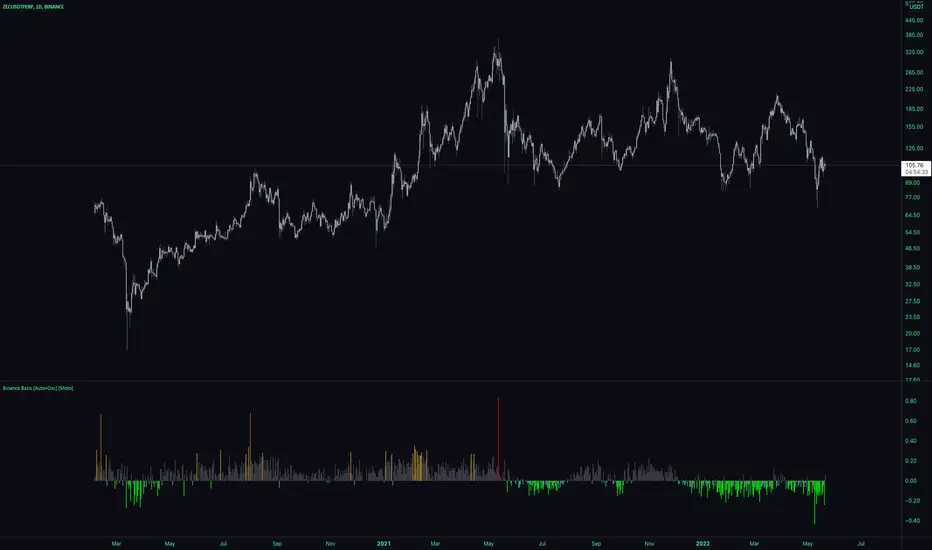
Premium [Auto+Osc] [Intromoto]
This indicator shows the premium between spot and index price, specifically on Binance USDT pairs against Binance USDT Perpetual contracts.
There are both a true and false overlay version of this indicator, this is the oscillator version.
IMPORTANT: This indicator will automatically change to the appropriate asset, but ONLY if the observed chart is a Binance PERP. For example: If my chart is on BINANCE:ETHUSDTPERP the indicator knows that you want to compare it to the BINANCE:ETHUSDT spot value. No need to manually change anything. Other pairs will be added as they are listed on Binance. I'll also be updating this indicator as I see fit.
The histogram simply plots the percent difference, either positive, "Contango", or negative, "Backwardation" between the futures price and the spot price. The colors are traditionally self explanatory, green is bullish/buy, red is bearish/sell . These values can be used real time to help in determining the predicted funding rate of the perpetual, which in turn may affect sentiment.
I've included user input capabilities so that the user can change the bracketing of which values the colors appear for the barcolors and plotshapes. These are broken up into uber backwardation, backwardation, low premium, regular premium, medium premium, high premium, and uber high premium.
Tweaks or changes may need to be made if trading altcoins for more actionable settings, as the default are designed for mainly BTC premium, but others will work well enough as is for the most part.
If the perpetual is above the spot price, funding will be positive, i.e. "normal", if spot is above the perpetual, it's usually bullish , but as always, market structure and confluence should be found for better outcomes.
An important feature I've added is the ability to change the resolution of the candle closes in the premium calculations. For example, if you want to take trades based on 5, 15, 60, etc closes, you can set the indicator to show those specific time frame premium values.
This oscillator will automatically change the candles whichever color is set to each of the relevant premium bracket values. I've also included the Binance funding periods as background colors, which may aid in confluence.
DM for access.
Thanks
Bitmex BTC Perpetual PremiumThis script tracks the premium of the Bitcoin Perpetual futures at Bimex exchange relative to 3 different reference prices.
The difference between this script and already published scripts is that it tracks the premium relative to 3 different reference prices. This tends to produce slightly different results.
This script is also open source, so you can verify the calculations, or use it as a basis for your own script.
The 3 plots uses the following reference prices:
Blue Area:
Bitmex Index price, ticker: BITMEX:XBT
Red line:
Bitmex Perpetual Premium, ticker XBTUSDPI
(This one is not used as reference, but simply plots the ticker*100)
Orange line:
The reference here is a price calculated by the tickers in trading view based on the Bitmex indices with weighing as follows:
Bitstamp:28,81%
Bittrex:5,5%
Coinbase: 38,07%
Gemini: 7,34%
Kraken: 20,28
Please note that Bitmex changes the bases of its indices regularly. Bitmex might also "rule out" on of these exchanges if there is a short term problem.

Weighted derivatives premium BTCCan be extended with more derivative or spot pairs, see the comments in the code for instructions. Most importantly, the pairs need to be added to the respective arrays in the same order, so that the weights are applied to the correct pairs.

Funding rateI thought for a long time about creating a paid complex indicator, but in the end I settled on a simple one :) Indicators are needed for two things - to simplify the chart in order to see the current trend more clearly, or add information that is difficult to analyze separately from the chart.
This indicator is of just the second type - it is a guide indicator that visualizes the change in the predicted funding rate for a pair of BTCUSD on bitmex exchange. There is still a huge trading volume, so it reflects well the balance of sentiment between spot and derivatives traders. It is supposed to use on BTCUSD pair, but I noticed, that it works on every crypto pair, even on Alt1/Alt2 pairs.
So, how to use this indicator? I am using it as a trigger. A trend change at extreme values in this indicator is a good entry point. Which way? It's up to you, but personally, I only trade with the trend :)
I provide access to this indicator only by subscription. PM me for more information.

Premium Index TheHuntThe indicator is used to see the difference in price between spot and futures prices. If future price is higher than spot in a rally, the rally isn't backed by real buys (spot) but by dumb perp longs which CAN be bearish . If spot price is higher than futures in a rally, the upside is backed by real money (spot) which is bullish.
The indicator allows you to pick a spot pair to compare it with the future exchanges you want. You can select which future exchange pairs to compare with by ticking them in the settings.
As you can see here on the chart during this last rally the index is high in the green which means the rally is backed by futures and spot ain't really following. This could be a sign of exhaustion.
