Gyspy Bot Trade Engine - V1.2B - Strategy 12-7-25 - SignalLynxGypsy Bot Trade Engine (MK6 V1.2B) - Ultimate Strategy & Backtest
Brought to you by Signal Lynx | Automation for the Night-Shift Nation 🌙
1. Executive Summary & Architecture
Gypsy Bot (MK6 V1.2B) is not merely a strategy; it is a massive, modular Trade Engine built specifically for the TradingView Pine Script environment. While most strategies rely on a single dominant indicator (like an RSI cross or a MACD flip) to generate signals, Gypsy Bot functions as a sophisticated Consensus Algorithm.
The engine calculates data from up to 12 distinct Technical Analysis Modules simultaneously on every bar closing. It aggregates these signals into a "Vote Count" and only executes a trade entry when a user-defined threshold of concurring signals is met. This "Voting System" acts as a noise filter, requiring multiple independent mathematical models—ranging from volume flow and momentum to cyclical harmonics and trend strength—to agree on market direction before capital is committed.
Beyond entries, Gypsy Bot features a proprietary Risk Management suite called the Dump Protection Team (DPT). This logic layer operates independently of the entry modules, specifically scanning for "Moon" (Parabolic) or "Nuke" (Crash) volatility events to force-exit positions, overriding standard stops to preserve capital during Black Swan events.
2. ⚠️ The Philosophy of "Curve Fitting" (Must Read)
One must be careful when applying Gypsy Bot to new pairs or charts.
To be fully transparent: Gypsy Bot is, by definition, a very advanced curve-fitting engine. Because it grants the user granular control over 12 modules, dozens of thresholds, and specific voting requirements, it is extremely easy to "over-fit" the data. You can easily toggle switches until the backtest shows a 100% win rate, only to have the strategy fail immediately in live markets because it was tuned to historical noise rather than market structure.
To use this engine successfully, you must adopt a specific optimization mindset:
Ignore Raw Net Profit: Do not tune for the highest dollar amount. A strategy that makes $1M in the backtest but has a 40% drawdown is useless.
Prioritize Stability: Look for a high Profit Factor (1.5+), a high Percent Profitable, and a smooth equity curve.
Regular Maintenance is Mandatory: Markets shift regimes (e.g., from Bull Trend to Crab Range). Parameters that worked perfectly in 2021 may fail in 2024. Gypsy Bot settings should be reviewed and adjusted at regular intervals (e.g., quarterly) to ensure the voting logic remains aligned with current market volatility.
Timeframe Recommendations:
Gypsy Bot is optimized for High Time Frame (HTF) trend following. It generally produces the most reliable results on charts ranging from 1-Hour to 12-Hours, with the 4-Hour timeframe historically serving as the "sweet spot" for most major cryptocurrency assets.
3. The Voting Mechanism: How Entries Are Generated
The heart of the Gypsy Bot engine is the ActivateOrders input (found in the "Order Signal Modifier" settings).
The engine constantly monitors the output of all enabled Modules.
Long Votes: GoLongCount
Short Votes: GoShortCount
If you have 10 Modules enabled, and you set ActivateOrders to 7:
The engine will ONLY trigger a Buy Entry if 7 or more modules return a valid "Buy" signal on the same closed candle.
If only 6 modules agree, the trade is rejected.
This allows you to mix "Leading" indicators (Oscillators) with "Lagging" indicators (Moving Averages) to create a high-probability entry signal that requires momentum, volume, and trend to all be in alignment.
4. Technical Deep Dive: The 12 Modules
Gypsy Bot allows you to toggle the following modules On/Off individually to suit the asset you are trading.
Module 1: Modified Slope Angle (MSA)
Logic: Calculates the geometric angle of a moving average relative to the timeline.
Function: It filters out "lazy" trends. A trend is only considered valid if the slope exceeds a specific steepness threshold. This helps avoid entering trades during weak drifts that often precede a reversal.
Module 2: Correlation Trend Indicator (CTI)
Logic: Based on John Ehlers' work, this measures how closely the current price action correlates to a straight line (a perfect trend).
Function: It outputs a confidence score (-1 to 1). Gypsy Bot uses this to ensure that we are not just moving up, but moving up with high statistical correlation, reducing fake-outs.
Module 3: Ehlers Roofing Filter
Logic: A sophisticated spectral filter that combines a High-Pass filter (to remove long-term drift) with a Super Smoother (to remove high-frequency noise).
Function: It attempts to isolate the "Roof" of the price action. It is excellent at catching cyclical turning points before standard moving averages react.
Module 4: Forecast Oscillator
Logic: Uses Linear Regression forecasting to predict where price "should" be relative to where it is.
Function: When the Forecast Oscillator crosses its zero line, it indicates that the regression trend has flipped. We offer both "Aggressive" and "Conservative" calculation modes for this module.
Module 5: Chandelier ATR Stop
Logic: A volatility-based trend follower that hangs a "leash" (ATR multiple) from the highest high (for longs) or lowest low (for shorts).
Function: Used here as an entry filter. If price is above the Chandelier line, the trend is Bullish. It also includes a "Bull/Bear Qualifier" check to ensure structural support.
Module 6: Crypto Market Breadth (CMB)
Logic: This is a macro-filter. It pulls data from multiple major tickers (BTC, ETH, and Perpetual Contracts) across different exchanges.
Function: It calculates a "Market Health" percentage. If Bitcoin is rising but the rest of the market is dumping, this module can veto a trade, ensuring you don't buy into a "fake" rally driven by a single asset.
Module 7: Directional Index Convergence (DIC)
Logic: Analyzes the convergence/divergence between Fast and Slow Directional Movement indices.
Function: Identifies when trend strength is expanding. A buy signal is generated only when the positive directional movement overpowers the negative movement with expanding momentum.
Module 8: Market Thrust Indicator (MTI)
Logic: A volume-weighted breadth indicator. It uses Advance/Decline data and Up/Down Volume data.
Function: This is one of the most powerful modules. It confirms that price movement is supported by actual volume flow. We recommend using the "SSMA" (Super Smoother) MA Type for the cleanest signals on the 4H chart.
Module 9: Simple Ichimoku Cloud
Logic: Traditional Japanese trend analysis using the Tenkan-sen and Kijun-sen.
Function: Checks for a "Kumo Breakout." Price must be fully above the Cloud (for longs) or below it (for shorts). This is a classic "trend confirmation" module.
Module 10: Simple Harmonic Oscillator
Logic: Analyzes the harmonic wave properties of price action to detect cyclical tops and bottoms.
Function: Serves as a counter-trend or early-reversal detector. It tries to identify when a cycle has bottomed out (for buys) or topped out (for sells) before the main trend indicators catch up.
Module 11: HSRS Compression / Super AO
Logic: Two options in one.
HSRS: Hirashima Sugita Resistance Support. Detects volatility compression (squeezes) relative to dynamic support/resistance bands.
Super AO: A combination of the Awesome Oscillator and SuperTrend logic.
Function: Great for catching explosive moves that result from periods of low volatility (consolidation).
Module 12: Fisher Transform (MTF)
Logic: Converts price data into a Gaussian normal distribution.
Function: Identifies extreme price deviations. This module uses Multi-Timeframe (MTF) logic to look at higher-timeframe trends (e.g., looking at the Daily Fisher while trading the 4H chart) to ensure you aren't trading against the major trend.
5. Global Inhibitors (The Veto Power)
Even if 12 out of 12 modules vote "Buy," Gypsy Bot performs a final safety check using Global Inhibitors. If any of these are triggered, the trade is blocked.
Bitcoin Halving Logic:
Hardcoded dates for past and projected future Bitcoin halvings (up to 2040).
Trading is inhibited or restricted during the chaotic weeks immediately surrounding a Halving event to avoid volatility crushes.
Miner Capitulation:
Uses Hash Rate Ribbons (Moving averages of Hash Rate).
If miners are capitulating (Shutting down rigs due to unprofitability), the engine flags a "Bearish" regime and can flip logic to Short-only or flat.
ADX Filter (Flat Market Protocol):
If the Average Directional Index (ADX) is below a specific threshold (e.g., 20), the market is deemed "Flat/Choppy." The bot will refuse to open trend-following trades in a flat market.
CryptoCap Trend:
Checks the total Crypto Market Cap chart. If the broad market is in a downtrend, it can inhibit Long entries on individual altcoins.
6. Risk Management & The Dump Protection Team (DPT)
Gypsy Bot separates "Entry Logic" from "Risk Management Logic."
Dump Protection Team (DPT)
This is a specialized logic branch designed to save the account during Black Swan events.
Nuke Protection: If the DPT detects a volatility signature consistent with a flash crash, it overrides all other logic and forces an immediate exit.
Moon Protection: If a parabolic pump is detected that violates statistical probability (Bollinger deviations), DPT can force a profit take before the inevitable correction.
Advanced Adaptive Trailing Stop (AATS)
Unlike a static trailing stop (e.g., "trail by 5%"), AATS is dynamic.
Penthouse Level: If price is at the top of the HSRS channel (High Volatility), the stop loosens to allow for wicks.
Dungeon Level: If price is compressed at the bottom, the stop tightens to protect capital.
Staged Take Profits
TP1: Scalp a portion (e.g., 10%) to cover fees and secure a win.
TP2: Take the bulk of profit.
TP3: Leave a "Runner" position with a loose trailing stop to catch "Moon" moves.
7. Recommended Setup Guide
When applying Gypsy Bot to a new chart, follow this sequence:
Set Timeframe: 4 Hours (4H).
Reset: Turn OFF Trailing Stop, Stop Loss, and Take Profits. (We want to see raw entry performance first).
Tune DPT: Adjust "Dump/Moon Protection" inputs first. These have the highest impact on net performance.
Tune Module 8 (MTI): This module is a heavy filter. Experiment with the MA Type (SSMA is recommended).
Select Modules: Enable/Disable modules 1-12 based on the asset's personality (Trending vs. Ranging).
Voting Threshold: Adjust ActivateOrders. A lower number = More Trades (Aggressive). A higher number = Fewer, higher conviction trades (Conservative).
Final Polish: Re-enable Stop Losses, Trailing Stops, and Staged Take Profits to smooth the equity curve and define your max risk per trade.
8. Technical Specs
Engine Version: Pine Script V6
Repainting: This strategy uses Closed Candle data for all Risk Management and Entry decisions. This ensures that Backtest results align closely with real-time behavior (no repainting of historical signals).
Alerts: This script generates Strategy alerts. If you require visual-only alerts, see the source code header for instructions on switching to "Study" (Indicator) mode.
Disclaimer:
This script is a complex algorithmic tool for market analysis. Past performance is not indicative of future results. Use this tool to assist your own decision-making, not to replace it.
9. About Signal Lynx
Automation for the Night-Shift Nation 🌙
Signal Lynx focuses on helping traders and developers bridge the gap between indicator logic and real-world automation. The same RM engine you see here powers multiple internal systems and templates, including other public scripts like the Super-AO Strategy with Advanced Risk Management.
We provide this code open source under the Mozilla Public License 2.0 (MPL-2.0) to:
Demonstrate how Adaptive Logic and structured Risk Management can outperform static, one-layer indicators
Give Pine Script users a battle-tested RM backbone they can reuse, remix, and extend
If you are looking to automate your TradingView strategies, route signals to exchanges, or simply want safer, smarter strategy structures, please keep Signal Lynx in your search.
License: Mozilla Public License 2.0 (Open Source).
If you make beneficial modifications, please consider releasing them back to the community so everyone can benefit.
谐波形态

5-0 Pattern ULTRA V6 [NXT2017]+Volume Profile +POC +SignalCounts5-0 Pattern ULTRA V6
This script is an advanced harmonic scanner designed specifically to detect the 5-0 Pattern. Unlike standard harmonic indicators, the "ULTRA" version scans across 9 different pivot lengths simultaneously (from 5 up to 233) to ensure no valid structure is missed, regardless of the timeframe.
It includes an integrated Volume Profile feature that automatically analyzes the volume distribution within the pattern to help validate the Point of Control (POC) near the reversal zone.
What is the 5-0 Pattern? The 5-0 is a unique 5-point harmonic structure (X, A, B, C, D) discovered by Scott Carney. It is distinct from other patterns like the Gartley or Bat because it relies heavily on specific reciprocal extensions. The completion point (D) is defined by a 50% retracement of the BC leg.
Pattern Rules used in this indicator:
The AB leg is a 1.13 to 1.618 extension of the XA leg.
The BC leg is a 1.618 to 2.618 extension of the AB leg.
The CD leg (Entry Zone) is a distinct 50% retracement of the BC leg.
Key Features of V6
Multi-Pivot Scanning: The indicator runs 9 separate scanners in the background (Pivot lengths: 5, 8, 13, 21, 34, 55, 89, 144, 233). You can toggle specific lengths on/off in the settings.
Auto Volume Profile: When a pattern is found, the script draws a Volume Profile over the structure and highlights the Point of Control (POC) line. This helps determine if there is volume support/resistance at the trade location.
Statistics Dashboard: A dashboard table displays historical data, showing how many Bullish and Bearish patterns have been detected for each pivot size on the current chart.
Smart History Filtering: Includes a mechanism to prevent duplicate patterns from cluttering the chart.
Interactive Guide: A built-in "Guide Mode" can be activated in the settings to hide signals and display a text tutorial on how to trade the pattern.
Settings & Customization
Tolerance: Adjust the inaccuracy percentage to make the scanner stricter or looser regarding Fibonacci ratios.
Visuals: Fully customizable colors for Bullish/Bearish patterns, Target lines, and Volume Profiles.
Labels: Choose between showing "XABCD" lettering or a simple "5-0" tag with the pattern size.
Alerts: Native alert conditions are set up. You can create alerts to be notified instantly when a new pattern is formed.
Risk Disclaimer: Trading harmonic patterns involves risk. The 5-0 pattern is a reversal setup; always use proper risk management and confirmation before entering a trade.
Made by NXT2017
This is a new creation of v1:

TraderDemircan - Ultimate Fibonacci Suite (Bearish) v2.0-Overview
This indicator is a comprehensive Fibonacci-based trading tool specifically designed for identifying and trading bearish XABCD harmonic patterns. It combines classical Fibonacci retracement/extension levels with advanced harmonic pattern recognition, risk management calculations, and confluence zone detection to provide traders with a complete analytical framework for short positions.
-What Makes This Script Original
Unlike standard Fibonacci tools that simply draw static levels, this script:
Dynamically identifies swing highs and lows using lookback period analysis
Automatically detects and labels XABCD formation points (X, A, B, C, D) in real-time
Recognizes multiple harmonic patterns (Gartley, Butterfly, Bat, Crab, Shark) with customizable tolerance
Calculates and displays Potential Reversal Zones (PRZ) at point D
Provides integrated risk management with position sizing, stop loss, and multiple take profit levels
Identifies confluence zones where multiple Fibonacci levels intersect
Includes trend filter to validate pattern direction
Offers trading mode presets for scalpers, day traders, and swing traders
-How It Works
XABCD Pattern Detection (Bearish Version)
The script uses a bearish structure where:
Point X: The highest point (swing high) identified within the lookback period
Point A: The lowest point (swing low) that occurs after X
Point B: The retracement level from A back toward X (typically 0.382, 0.5, 0.618, or 0.786)
Point C: The projected target below B (calculated as B minus the X-A range)
Point D: The Potential Reversal Zone (PRZ) where the short position is recommended
The algorithm:
Scans the last N bars (user-defined) to find the highest point (X)
Identifies the lowest point after X (point A)
Monitors price retracement to determine point B
Projects point C and D targets based on Fibonacci extensions
Validates the formation against minimum swing size requirements
Optionally applies trend filter to confirm bearish bias
Fibonacci Levels
The script plots 14 customizable Fibonacci levels:
Retracement levels: 0.0 (X), 0.236, 0.382, 0.5, 0.618, 0.786, 1.0 (A)
Extension levels: 1.272, 1.414, 1.618, 2.0, 2.618, 3.618, 4.236
Each level is color-coded and can be individually toggled on/off. In the bearish version, these levels are calculated from the swing high (X) downward to the swing low (A) and beyond.
Harmonic Pattern Recognition
The indicator automatically detects five classic harmonic patterns when enabled:
Bearish Gartley (75% probability): B retracement at 0.618, D target at 0.786
Bearish Butterfly (70% probability): B retracement at 0.786, D target at 1.272
Bearish Bat (80% probability): B retracement at 0.382-0.5, D target at 0.886
Bearish Crab (85% probability): B retracement at 0.382-0.618, D target at 1.618
Bearish Shark (72% probability): B retracement at 0.382-0.618, D target at 1.13
Pattern detection uses a tolerance parameter (default 5%) to account for market imperfections. When a pattern is identified, it displays the pattern name and estimated success probability.
Risk Management System
The script includes a complete risk management framework:
Position Sizing: Calculates the appropriate position size based on:
Account size (user input)
Risk percentage per trade (user input)
Distance from entry to stop loss
Stop Loss: Automatically placed 0.5% above point X to protect against invalidation
Take Profit Levels:
TP1: 1.272 extension (customizable)
TP2: 1.618 extension (customizable)
TP3: 2.0 extension (customizable)
Risk/Reward Ratio: Displayed in the info panel, calculated as (Entry - TP3) / (Stop Loss - Entry)
Confluence Detection
When multiple Fibonacci levels converge within 0.5% of each other, the script highlights these zones with translucent boxes. These confluence zones often act as strong support/resistance areas and increase the probability of reversal.
Minimum confluence threshold is customizable (default: 2 levels).
Trend Filter
Optional moving average filter (default: 50-period SMA) helps validate that patterns are forming in the direction of the prevailing trend. When enabled with "Only Show Patterns in Trend Direction," the indicator will only display formations that align with a bearish trend (price below MA).
-How to Use
For Scalpers:
Select "Scalper" trading mode
Use lower timeframes (1m, 5m, 15m)
Focus on TP1 and TP2 levels
Tight stop loss above point X
For Day Traders:
Select "Day Trader" trading mode
Use medium timeframes (15m, 30m, 1H)
Target TP2 and TP3 levels
Monitor confluence zones for entry refinement
For Swing Traders:
Select "Swing Trader" trading mode
Use higher timeframes (4H, D)
Hold for TP3 or beyond
Use trend filter to confirm macro direction
Entry Strategy:
Wait for point D (PRZ) to be reached
Look for bearish confirmation (candlestick patterns, volume, momentum)
Enter short position at or near point D
Place stop loss above point X as indicated
Scale out at TP1, TP2, and TP3 levels
-Key Settings
General Settings:
Trading Mode: Presets optimized for different trading styles
Lookback Bars: Historical period for swing detection (10-200)
Min Swing Size: Minimum percentage move to validate formation (0.1-10%)
Fibonacci Levels:
Individual toggle and color customization for all 14 levels
Line thickness and style options (Solid/Dashed/Dotted)
Optional price and percentage labels
Left and right line extension
Harmonic Patterns:
Enable/disable specific pattern types
Pattern tolerance adjustment (1-15%)
Risk Management:
Account size input
Risk percentage per trade (0.5-10%)
Customizable TP level multipliers
Toggle stop loss and take profit displays
Display Options:
Show/hide XABCD lines
C target and D target (PRZ) visualization
Confluence zone highlights
Trend MA overlay
Information panel with trade statistics
Alert Settings:
Pattern completion alerts
C target hit notifications
Key Fibonacci level alerts
-Visual Features
Color-coded Fibonacci levels: Each level has a distinct color for easy identification
Dynamic XABCD lines: Yellow lines connect pattern formation points
Target projections: Magenta for C target, blue for D target (PRZ)
Risk management lines: Red for stop loss, green for take profits
Confluence boxes: Golden translucent boxes highlight key zones
Information panel: Top-right panel displays pattern type, entry, stop loss, TP3, R:R ratio, position size, and direction
Point labels: Clear X, A, B, C, D markers with hover tooltips showing exact prices
-Important Disclaimers
Risk Warning: Trading financial instruments involves substantial risk and may not be suitable for all investors. Past performance of any trading system or pattern is not necessarily indicative of future results.
No Repainting: This indicator does NOT repaint. All pattern detection and level calculations are based on confirmed price data at the close of each bar.
Backtesting Note: If used as a strategy with backtesting, ensure realistic parameters:
Use appropriate commission (0.1% or higher for most markets)
Include slippage (10+ ticks for liquid markets)
Risk no more than 2-5% of account per trade
Test on sufficient sample size (100+ trades minimum)
Manual Confirmation: This indicator is a tool to assist analysis, not a complete trading system. Always use additional confirmation from:
Price action analysis
Volume confirmation
Market context and news
Risk tolerance assessment
Harmonic Pattern Probabilities: The success rates shown (70-85%) are theoretical estimates based on historical studies and should not be interpreted as guarantees. Actual results will vary based on market conditions, execution timing, and individual risk management.
-Technical Details
Pine Script Version: v6 (latest)
Overlay: True (displays on price chart)
Maximum Objects: 500 lines, 500 labels, 500 boxes
Calculation Method: Swing high/low detection with percentage-based Fibonacci calculations
No Lookahead Bias: All calculations use confirmed historical data
Compatible Timeframes: All timeframes (1m to 1M), recommended 15m and above
-Differences from Bullish Version
This is the bearish version specifically designed for short positions:
X point is the swing HIGH (not low)
A point is the swing LOW (not high)
B retracement moves UP from A toward X
C target projects DOWN from B
D target (PRZ) is calculated ABOVE X for short entries
All Fibonacci levels are inverted for downward price movement
Pattern recognition logic adjusted for bearish structures
A companion bullish version is available separately for long position analysis.

TraderDemircan - Ultimate Fibonacci Suite v2.0Ultimate Fibonacci Suite v2.0 - Advanced Harmonic Pattern Detection & XABCD Analysis
-Overview
The Ultimate Fibonacci Suite v2.0 is a comprehensive technical analysis tool that combines advanced Fibonacci retracement/extension levels with automatic harmonic pattern detection and XABCD formation analysis. This indicator is designed for traders who want to identify high-probability reversal zones using multiple confluence techniques.
-What Makes This Script Original?
This indicator goes beyond simple Fibonacci retracements by:
Automatic XABCD Formation Detection: Identifies complete X-A-B-C-D patterns in real-time, marking each critical point with precise Fibonacci relationships
Multi-Pattern Harmonic Recognition: Detects 5 major harmonic patterns (Gartley, Butterfly, Bat, Crab, Shark) with customizable tolerance levels
Confluence Zone Analysis: Automatically identifies areas where multiple Fibonacci levels converge, highlighting the strongest support/resistance zones
Integrated Risk Management: Calculates position sizing, stop-loss placement, and multiple take-profit targets based on pattern completion
Adaptive Mode Selection: Offers preset configurations for different trading styles (Scalper, Day Trader, Swing Trader)
-Key Features
Fibonacci Levels (15 levels available)
Standard retracement levels: 0.236, 0.382, 0.5, 0.618, 0.786
Extension levels: 1.272, 1.414, 1.618, 2.0, 2.618, 3.618, 4.236
All levels individually customizable with color and visibility options
Harmonic Pattern Detection
The indicator automatically identifies these harmonic patterns with their specific Fibonacci ratios:
Gartley Pattern (B: 0.618, D: 0.786) - 75% historical success rate
Butterfly Pattern (B: 0.786, D: 1.272-1.618) - 70% success rate
Bat Pattern (B: 0.382-0.5, D: 0.886) - 80% success rate
Crab Pattern (B: 0.382-0.618, D: 1.618) - 85% success rate
Shark Pattern (B: 0.382-0.618, D: 1.13-1.618) - 72% success rate
Each pattern displays its probability percentage and clearly marks the Potential Reversal Zone (PRZ).
XABCD Formation System
X Point: Initial swing low (0.0 level)
A Point: Peak of the move (1.0 level)
B Point: Retracement level (typically 0.382, 0.5, or 0.618)
C Point: Projected target for the corrective move
D Point (PRZ): The optimal entry zone for reversal trades
The system validates formations to ensure B point hasn't been violated and minimum swing size requirements are met.
Risk Management Tools
Automatic Stop-Loss Calculation: Placed below X point with buffer
Three Take-Profit Levels: TP1 (1.272), TP2 (1.618), TP3 (2.0) - all customizable
Position Size Calculator: Based on account size and risk percentage
Risk/Reward Ratio Display: Real-time R:R calculation for each setup
Confluence Zone Detection
Identifies areas where 2+ Fibonacci levels intersect within 0.5% price range
Highlights these zones with colored boxes
Customizable threshold for confluence detection (2-5 levels)
Trend Filter
Optional moving average filter (customizable period)
Can restrict pattern display to trend-aligned setups only
Visual trend indication on chart
-How It Works?
The indicator uses a sophisticated algorithm that:
Scans for Swing Points: Analyzes the last N bars (customizable 10-200) to identify significant swing lows and highs
Validates Swing Size: Filters out minor movements using a minimum swing size percentage threshold
Calculates Fibonacci Levels: Projects all retracement and extension levels from the identified X and A points
Monitors Price Action: Tracks current price to determine B point formation
Projects Targets: Calculates C and D targets based on the pattern's Fibonacci relationships
Pattern Recognition: Compares B retracement ratio against known harmonic pattern specifications
Risk Parameters: Automatically sets stop-loss and take-profit levels with position sizing
-Customization Options
Four Trading Modes:
Complete: All features enabled
Scalper: Optimized for short-term trades with tighter parameters
Day Trader: Balanced settings for intraday trading
Swing Trader: Longer-term focus with extended lookback periods
Display Settings:
Individual level visibility toggles
Custom colors for each Fibonacci level
Line style options (Solid, Dashed, Dotted)
Line thickness adjustment
Label display options (price/percentage/both)
Line extension controls (left/right/both)
Alert System:
Pattern completion alerts
C target achievement notifications
Key Fibonacci level breakout alerts
All alerts customizable on/off
-How to Use?
Apply the Indicator: Add to your chart and select your trading mode
Wait for Formation: The indicator will automatically detect valid XABCD formations
Identify Pattern Type: Check the pattern label to see which harmonic pattern is forming
Monitor Price Action: Watch for price to reach the D point (PRZ) - your potential entry zone
Execute Trade: Enter when price reaches D with:
Stop loss at the displayed SL level
Take profits at TP1, TP2, and TP3 levels
Use Confluence: Pay extra attention to setups where D point aligns with confluence zones
-Recommended Settings
For Scalping: Lookback 20-30 bars, Min Swing 0.5%, Tight TP levels
For Day Trading: Lookback 50 bars (default), Min Swing 1%, Standard TP levels
For Swing Trading: Lookback 100-150 bars, Min Swing 2%, Extended TP levels
Pattern Tolerance: 5% (default) - increase for more patterns, decrease for stricter detection
-Statistics Panel
Optional real-time statistics display showing:
Current pattern type and probability
Risk/reward ratio
Recommended position size
Distance to key levels
-Important Notes
This indicator does not repaint: All calculations are based on closed bars
Past performance is not indicative of future results: Use proper risk management
Best used with additional confirmation: Consider volume, trend context, and other indicators
Pattern completion does not guarantee reversal: Always use stop-losses
Optimized for trending markets: Works best when clear swings are present
-Technical Details
Pine Script Version: v6 (latest)
Overlay: Yes - plots directly on price chart
Max Lines/Labels/Boxes: 500 each
Calculation Method: Based on classical Fibonacci ratios and harmonic trading principles
No Repainting: All signals generated on bar close
-Educational Value
This indicator helps traders understand:
Fibonacci retracement/extension relationships
Harmonic pattern geometry and ratios
XABCD pattern structure
Confluence trading concepts
Risk management principles
-Who Is This For?
Traders familiar with Fibonacci analysis
Harmonic pattern traders
Price action traders looking for objective entry zones
Risk-conscious traders who want built-in money management
Anyone seeking to identify high-probability reversal zones


Vdubus Divergence Wave Pattern Generator V1The Vdubus Divergence Wave Theory
10 years in the making & now finally thanks to AI I have attempted to put my Trading strategy & logic into a visual representation of how I analyse and project market using Core price action & MacD. Enjoy :)
A Proprietary Structural & Momentum Confluence SystemPart 1: The Strategic Concept1. The Core Philosophy: "Geometry + Physics"Traditional technical analysis often fails because traders confuse location with timing.Geometry (Price Patterns): Tells us WHERE the market is likely to reverse (e.g., at a resistance level or harmonic D-point).Physics (Momentum): Tells us WHEN the energy driving the trend has actually shifted. The Vdubus Theory posits that a trade should never be taken based on Geometry alone. A valid signal requires a specific, fractal decay in momentum—a "Handshake" between price structure and energy exhaustion.2. The 3-Wave Momentum Filter (The Engine)Most traders look for simple divergence (2 points). The Vdubus Theory demands a 3-Wave Structure to confirm the true state of the market.A. The Standard Reversal (Exhaustion)This is the "Safe" entry, catching the slow death of a trend.Wave 1 $\rightarrow$ 2 (The Warning): Price pushes higher, but momentum is lower (Standard Divergence). This signals that the trend is tapping the brakes.Wave 2 $\rightarrow$ 3 (The Confirmation): Price pushes to a final extreme (often a stop-hunt), but momentum is flat or lower than Wave 2 ("No Divergence").The Logic: This confirms that the buyers have expended all remaining energy. The engine is dead.
B. The Climax Reversal (The Trap)This is the "Aggressive" entry, catching V-shape reversals.Wave 1 $\rightarrow$ 2 (The Bait): Price pushes higher, and momentum is Stronger/Higher (No Divergence). This sucks in retail traders who believe the trend is accelerating.Wave 2 $\rightarrow$ 3 (The Snap): Price pushes again, but momentum suddenly collapses (Divergence).The Logic: A "Strong to Weak" shift. The market traps traders with a show of strength before hitting a "concrete wall" of limit orders.C. The Predator (The Trend Continuation)The Logic: Trends rarely move in straight lines. The "Predator" looks for Hidden Divergence during a pullback.The Signal: Price makes a Higher Low (Trend Structure Intact), but Momentum makes a Lower Low (Oversold Trap). This signals the end of the correction and the resumption of the main trend.3. The "Clean Path" PrincipleA trade is only valid if there is no opposing force. If you are looking to Sell (Bearish Reversal), the opposing Bullish momentum must be weak or neutral. If the "Enemy" is strong, the trade is skipped.
Part 2: The Indicator Breakdown
Tool Name: Vdubus Divergence Wave Pattern Generator V1
This script automates your analysis by combining ZigZag Pattern Recognition (Geometry) with your Custom MACD Logic (Physics).
1. The "Golden" Settings
The physics engine is tuned to your specific discovery:
Fast Length: 8
Slow Length: 21
Signal Length: 5
Lookback: 3 (Sensitive enough to catch the exact pivot points).
2. Signal Generation Logic
The indicator scans for four distinct setups. Here is the exact logic code translated into English:
Signal 1: Standard Reversal (Green/Red Pattern)
Geometry: The ZigZag algorithm identifies a 5-point structure (X-A-B-C-D), such as a Gartley, Bat, or Butterfly.
Physics Check:
Finds the last 3 momentum peaks matching the price highs.
Rule: Momentum Peak 2 must be < Peak 1 (Divergence).
Rule: Momentum Peak 3 must be <= Peak 2 (Confirmation/No Div).
Output: Draws the colored pattern and labels it (e.g., "Bearish Gartley (Exhaustion)").
Signal 2: Climax Reversal (Orange Pattern)
Geometry: Identifies the same 5-point structures.
Physics Check:
Rule: Momentum Peak 2 is >= Peak 1 (Strength/No Div).
Rule: Momentum Peak 3 is < Peak 2 (Sudden Failure/Div).
Output: Draws the pattern in Orange labeled "⚠️ CLIMAX REVERSAL". This is your "Trap" detector.
Signal 3: Rounded Top/Bottom (Navy/Maroon Label)
Geometry: Price is compressing or rounding over.
Physics Check:
Scans for 4 consecutive waves of momentum decay.
Rule: Peak 1 > Peak 2 > Peak 3 > Peak 4.
Output: Places a label indicating a "Multi-Wave Decay," identifying turns that don't have sharp pivots.
Signal 4: The Predator (Purple Pattern)
Geometry: Identifies a trend pullback (Higher Low for Buys).
Physics Check:
Rule: Momentum makes a Lower Low while Price makes a Higher Low (Hidden Divergence).
Output: Draws a Purple pattern labeled "🦖 PREDATOR" to signal trend continuation.
3. The Confluence Dashboard
Located in the corner of the screen, this provides a final "Safety Check."
Logic: It compares the absolute value (strength) of the most recent Bearish Momentum Peak vs. the most recent Bullish Momentum Low.
Output:
Green (Bulls Strong): Buying pressure is dominant. Safe to Buy, Dangerous to Sell.
Red (Bears Strong): Selling pressure is dominant. Safe to Sell, Dangerous to Buy.
Grey (Neutral): Forces are balanced.
Summary of Potential
This system solves the "Trader's Dilemma" of entering too early or too late. By waiting for the 3rd Wave, you effectively filter out the market noise and only commit capital when the opposing side has structurally and physically collapsed. It transforms trading from a guessing game into a disciplined execution of identifying Geometric Exhaustion.
Logic 1 / PREVIOUS DIVERGENCE PROJECTS future TREND BREAKS / Reversals *Not in script*
Logic 2 / Wave 1 to 2 = Divergence / Wave 2 to 3 = NO divergence = Signal
Reverse logic: Wave 1 to 2 = NO Divergence / Wave 2 to 3 = Divergence = Signal

Steamroom Levels V3 - Dynamic IVOptions flow visualization tool displaying Gamma Exposure (GEX) levels and IV-derived pivot levels with intelligent auto-timeframe selection.
Overview
Steamroom Levels V3 visualizes two components of options market structure on your chart: Gamma Exposure (GEX) levels and Steamroom Pivots. These levels are derived from derivatives market data and help traders identify potential support, resistance, and expected price ranges based on options positioning and implied volatility.
Core Components
Gamma Exposure (GEX) Levels
Gamma Exposure represents aggregate options positioning at various strike prices. When market makers sell options, they hedge their exposure by buying or selling the underlying asset. This hedging activity can create predictable price behavior around key strike levels.
Four GEX level types are displayed:
Put Wall (Major) : The strike with the highest concentration of put gamma. As price approaches, dealer hedging may create buying pressure, often acting as support.
Put Wall Minor : Secondary put gamma concentrations providing interim support zones.
Call Wall (Major) : The strike with the highest concentration of call gamma. Dealer hedging may create selling pressure as price rises toward this level, often acting as resistance.
Call Wall Minor : Secondary call gamma concentrations providing interim resistance zones.
Steamroom Pivots
Steamroom Pivots are support and resistance levels calculated using implied volatility data from the options market. The calculation method works as follows:
Methodology:
The indicator takes the selected IV timeframe value (1-day, 5-day, 30-day, or 90-day implied volatility expressed as a decimal)
Three proprietary multipliers are applied to this IV value to create bands above and below the anchor price
The previous daily close serves as the anchor point
This produces three resistance levels (R1, R2, R3) above the anchor and three support levels (S1, S2, S3) below
The Six Pivot Levels:
R1 / S1 – Nearest pivot levels; represent the first reaction zones
R2 / S2 – Extended pivot levels; secondary targets
R3 / S3 – Outer pivot levels; represent significant price extensions
The specific multipliers used are calibrated based on observed market behavior and are not disclosed, but the general approach uses implied volatility as a measure of expected price movement scaled to create meaningful intraday and swing trading levels.
Auto IV Timeframe Selection
The indicator automatically selects the appropriate implied volatility timeframe based on your chart's timeframe. This ensures pivot levels remain relevant to your trading horizon.
Default Auto Behavior:
Chart Timeframe IV Selected
Up to 30 minutes 1-day IV
31 minutes to 4 hours 5-day IV
4 hours to 1 week 30-day IV
Above 1 week 90-day IV
Customizable Thresholds:
You can adjust these cutoffs in the settings:
"Auto: 1-day IV up to (min)" – Default: 30
"Auto: 5-day IV up to (min)" – Default: 240 (4 hours)
"Auto: 30-day IV up to (min)" – Default: 10080 (1 week)
Manual Override:
Select 1-day, 5-day, 30-day, or 90-day directly to lock in a specific IV timeframe regardless of chart timeframe.
Info Table
An on-chart table displays the currently active IV timeframe. When using Auto mode, it shows which IV was selected (e.g., "IV: 1-day IV (Auto)").
Table Settings:
Show/Hide toggle
Position: Top Left (default), Top Right, Bottom Left, Bottom Right, Top Center, or Bottom Center
Text size: Tiny, Small, Normal, Large, Huge
Text and background color customization
Data Input
This indicator requires external data input. Paste your formatted data string into the "Paste V3 Data" field in settings. The indicator automatically matches data to the current chart symbol.
The data format supports multiple symbols simultaneously. Only levels matching the active chart are displayed.
How To Use
GEX Levels
Put Wall levels may act as support; Call Wall levels may act as resistance
Minor walls provide interim reaction zones
Breaks through major walls may indicate momentum shifts
Steamroom Pivots
R1/S1 are the nearest pivot levels – common intraday reaction points
R2/S2 serve as extended targets
R3/S3 mark outer boundaries for significant moves
Confluence between GEX levels and pivots strengthens a price zone's significance
Customization Options
GEX Settings
Toggle visibility for levels and labels
Show/hide prices in labels
Line extension direction
Label size and offset
Pivot Settings
Toggle visibility for levels and labels
Show/hide prices in labels
IV timeframe selection (Auto or manual)
Auto threshold customization
Line extension direction
Label size and offset
Styling
Independent colors for Put Wall, Put Minor, Call Wall, Call Minor
Line styles: Solid, Dotted, Dashed
Line width: 1-4 pixels
Pivot color with independent styles per level pair (R1/S1, R2/S2, R3/S3)
Technical Notes
Multi-symbol data supported; only matching symbol levels are displayed
Pivots anchor to the confirmed daily close
Auto IV selection uses native TradingView timeframe detection
Visual elements are efficiently managed and cleaned up on each update
Disclaimer
This indicator is for informational and educational purposes only. Displayed levels are based on options market data and do not guarantee future price behavior. Past performance is not indicative of future results. Always conduct your own analysis and manage risk appropriately. Trading involves substantial risk of loss.

ABCD Harmonic Patterns (DEMO)DEMO FEATURES:
✅ 2 ZigZag timeframes
✅ AB=CD and Classic ABCD patterns
✅ Pattern visualization
PREMIUM VERSION INCLUDES/( ABCD Harmonic Patterns Detection-Professional)
⭐ 5 ZigZag timeframes
⭐ All 3 pattern types (including Extending ABCD)
⭐ Automated Entry, Target, and Stop levels
⭐ Smart label positioning
⭐ Detailed alerts
⭐ Priority support
Get to know video: www.youtube.com
Contact us for premium indicator.

ABCD Harmonic Patterns Detection-Professional"It is based on standard ZigZag algorithms, but stands out with its ABCD harmonic detection, Entry, Stop, Target levels and alarm feature."
Title: Advanced ABCD Harmonic Patterns (AB=CD, Classic, Extending)
Description: This indicator is a specialized tool designed to detect and visualize three specific types of ABCD harmonic patterns: AB=CD, Classic ABCD, and Extending ABCD. Unlike generic harmonic scanners, this tool focuses strictly on ABCD structures with custom-tuned logic for higher precision and actionable trade setups.
Key Features:
Specialized Detection Logic:
Accurately identifies AB=CD, Classic ABCD, and Extending ABCD patterns.
Uses advanced custom formulas and strict ratio checks to ensure high-quality pattern detection, filtering out invalid setups.
Automated Trade Levels:
Automatically plots Entry, Target 1, Target 2, and Stop Loss levels for every detected pattern.
Calculates levels dynamically based on the specific pattern type and harmonic ratios to provide precise trade guidance.
Smart Visualization:
Clean Charts: Trade levels (Entry, T1, T2, Stop) are displayed only for the latest pattern to prevent chart clutter. You can see the transaction levels when you hover the cursor over the label in past formations.
Visual Clarity: Uses solid, thick lines with clear labels positioned to the right of the price action.
Overlap Prevention: Smartly offsets labels if multiple patterns complete on the same bar, ensuring all text is readable.
Alerts:
Includes built-in alerts that notify you instantly when a new pattern is formed, allowing you to catch opportunities in real-time.
How to Use:
Add the indicator to your chart.
Adjust ZigZag settings if needed to capture different market cycles.
Use the automated Entry, Target, and Stop levels to guide your trading decisions.
Set up alerts to be notified of new opportunities instantly.
"Standart ZigZag algoritmalarına dayalıdır ancak ABCD harmonik tespiti, Entry, Stop, Target seviyelerini belirtmesi ve alarm özelliği ön plana çıkmaktadır."

TRharmonic Ultimate
TRharmonic Ultimate - Professional Harmonic Pattern Detection System
Technical Overview
TRharmonic Ultimate is a real-time harmonic pattern recognition system built on Pine Script v5. The system analyzes 25+ harmonic formations across multiple ZigZag depths simultaneously, providing traders with instant pattern detection and pre-calculated trading levels.
Core Features
The indicator uses a zero-lag ZigZag algorithm with right offset set to 0, eliminating the typical 1-5 bar delay found in standard pivot-based systems.
Pattern detection operates across 10 simultaneous ZigZag depth calculations ranging from 15 to 150 bars, ensuring coverage of both short-term and long-term formations.
Each detected pattern includes automatically calculated entry price, stop loss, and three take-profit levels based on standard Fibonacci retracement principles.
The system validates patterns using adjustable tolerance bands between 7% and 10%, allowing traders to balance between detection sensitivity and accuracy.
MACD confirmation can be optionally enabled to filter signals, reducing false positives by requiring momentum alignment with pattern direction.
Dragon pattern detection uses proprietary ratio validation specifically designed for this rare formation's unique Fibonacci relationships.
Wolfe Wave recognition includes full 6-point structure analysis with automatic EPA (Estimated Price Arrival) line projection.
The algorithm performs geometric validation beyond simple ratio checking, including trendline mathematics and positional requirements.
Pattern drawings automatically adapt to chart theme (dark/light mode) with customizable color schemes for all 25+ formations.
A built-in deduplication system prevents multiple alerts for the same pattern within a specified bar range.
Technical Advantages
The ZigZag calculation method processes pivot points in real-time without requiring bar closure confirmation.
Memory management is optimized to handle 500+ bars of historical data while maintaining calculation speed.
Pattern-specific algorithms account for individual formation characteristics rather than using generic detection logic.
The system can detect rare patterns like Dragon and Wolfe Wave that most commercial indicators cannot identify reliably.
All Fibonacci calculations are performed automatically, eliminating manual measurement errors common in discretionary trading.
The indicator maintains clean chart visualization by automatically removing outdated pattern drawings after a configurable time period.
Multi-layer validation processes include ratio checks, geometric positioning, and optional momentum confirmation.
Pattern labels display Fibonacci ratios directly on formations, providing transparency in detection criteria.


Mean-Reversion with CooldownThis strategy requires no indicators or fundamental analysis. It is designed for longer-term positions and works especially well on unleveraged instruments with strong long-term upward trends, such as precious metals. Feel free to experiment with different timeframes — I’ve found that 1-hour charts work particularly well for cryptocurrencies.
The idea is to filter out ongoing bear phases as effectively as possible and capitalize on long-term bull runs.
The script implements an idea that came to me in a state of complete sleep deprivation: open a random long position with a fixed take-profit (TP) and a tight stop-loss (SL).
If the TP is hit — great, we simply try again.
If the SL is triggered — too bad, we pause for a while and then try again.
## Cooldown (Waiting) Mechanism
The waiting mechanism is simple: the more consecutive SL hits we get, the longer we wait before opening the next trade. The waiting time is measured in closed candles, and thus depends on the timeframe you are using.
## Two cooldown calculation modes are currently supported:
### 1. FIBONACCI
The cooldown follows the Fibonacci sequence, based on the number of consecutive losses:
1st loss → wait 1 bar
2nd loss → wait 1 bar
3rd loss → wait 2 or 3 bars (depending on definition)
4th loss → wait 3 or 5 bars
etc.
### 2. POWER OF TWO
The cooldown increases exponentially:
1st loss → wait 2 bars
2nd loss → wait 4 bars
3rd loss → wait 8 bars
4th loss → wait 16 bars
and so on, using the formula 2ⁿ.
## Configurable Parameters
### Cooldown Pause Calculation
The settings allow you to define the SL and TP as percentages of the position value.
The "Cooldown Pause Calculation" option determines how the next cooldown duration is computed after a losing trade.
The system keeps track of how many consecutive losses have occurred since the last profitable trade. That counter is then used to compute how many bars we must wait before opening the next position.
### Maximum Cooldown
The "Max Cooldown Candles" setting defines the maximum number of bars we are allowed to wait before placing a new trade. This prevents the strategy from “locking itself out” for too long and mitigates the fear of missing out (FOMO).
Once the cooldown duration reaches this maximum, the system essentially wraps around and starts the progression again. In the script, this is handled using a simple modulo operation based on the chosen maximum.

艺轩自制谐波指标This is an indicator based on harmonic trading.It includes the identification of various harmonic forms, such as butterfly form, Gartley form, bat form, crab form, etc. You can use it as a good reference and check the forms you want to pay attention to in the settings.

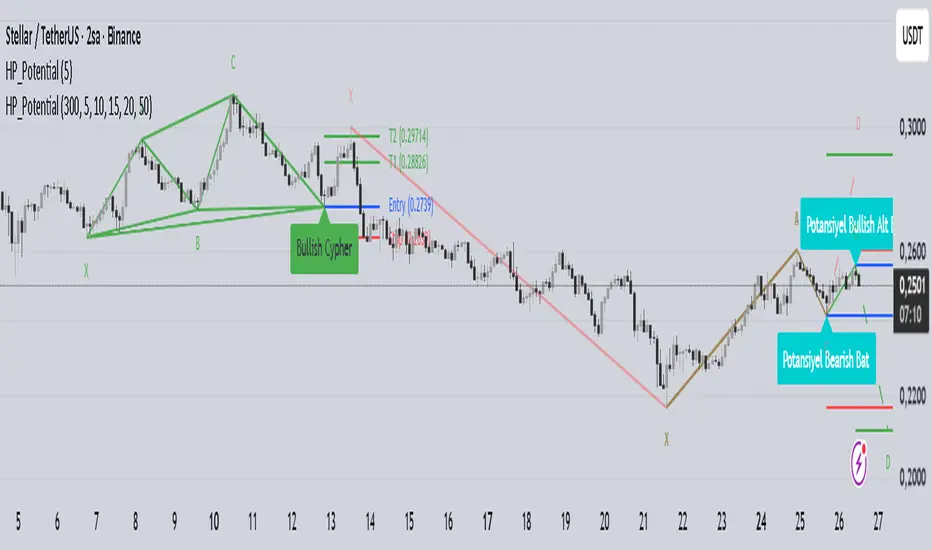
Harmonic Patterns with Potential DetectionThis indicator is designed to automatically detect commonly used Harmonic Patterns in financial markets and provide early warnings for "Potential" patterns that have not yet completed. It utilizes a Multi-ZigZag structure to analyze price movements across different timeframes simultaneously.
Key Features:
Advanced Pattern Detection:
Detects the following 8 harmonic patterns in both Bullish and Bearish directions:
Gartley
Bat
Alt Bat
Butterfly
Crab
Deep Crab
Shark
Cypher
Potential Pattern Detection (Early Warning System):
Calculates the probable D point (Entry Level) after the C point is formed, even before the pattern is fully completed, and visualizes it with dashed lines.
This feature allows traders to prepare and plan their trading strategies before the pattern completes.
Automatically plots Entry, Stop, and Target levels for potential patterns.
Multi-ZigZag Analysis:
Scans the market using 5 different ZigZag lengths (5, 10, 15, 20, 50). This allows you to see both short-term and long-term patterns on the same chart.
Each ZigZag period uses distinct color coding, making it easy to distinguish which timeframe a pattern belongs to.
User-Friendly Visuals:
Completed patterns are shown with clear lines and labels (X, A, B, C, D).
Hovering over pattern labels (Tooltip) displays detailed information including the pattern name, entry, target, and stop levels.
Only valid and active patterns are highlighted to prevent visual clutter.
Alert System:
You can set alerts for both completed patterns (when point D is formed) and potential patterns (when point C is formed).
Fully compatible with the TradingView alert system.
How to Use:
Add the indicator to your chart.
Select which patterns to scan for in the settings menu (all are selected by default).
Customize ZigZag sensitivities according to your strategy.
Dashed lines indicate "Potential" (uncompleted) opportunities, while solid lines indicate "Completed" patterns.
Disclaimer: This indicator is for educational and analytical purposes only. It does not constitute investment advice. Harmonic patterns are probability-based analysis methods and may not always yield successful results.
Smart Money Concepts [XoRonX]# Smart Money Concepts (SMC) - Advanced Trading Indicator
## 📊 Deskripsi
**Smart Money Concepts ** adalah indicator trading komprehensif yang menggabungkan konsep Smart Money Trading dengan berbagai alat teknikal analisis modern. Indicator ini dirancang untuk membantu trader mengidentifikasi pergerakan institusional (smart money), struktur pasar, zona supply/demand, dan berbagai sinyal trading penting.
Indicator ini mengintegrasikan multiple timeframe analysis, order blocks detection, fair value gaps, fibonacci retracement, volume profile, RSI multi-timeframe, dan moving averages dalam satu platform yang powerful dan mudah digunakan.
---
## 🎯 Fitur Utama
### 1. **Smart Money Structure**
- **Internal Structure** - Struktur pasar jangka pendek untuk entry presisi
- **Swing Structure** - Struktur pasar jangka panjang untuk trend analysis
- **BOS (Break of Structure)** - Konfirmasi kelanjutan trend
- **CHoCH (Change of Character)** - Deteksi potensi reversal
### 2. **Order Blocks**
- **Internal Order Blocks** - Zona demand/supply jangka pendek
- **Swing Order Blocks** - Zona demand/supply jangka panjang
- Filter otomatis berdasarkan volatilitas (ATR/Range)
- Mitigation tracking (High/Low atau Close)
- Customizable display (jumlah order blocks yang ditampilkan)
### 3. **Equal Highs & Equal Lows (EQH/EQL)**
- Deteksi otomatis equal highs/lows
- Indikasi liquidity zones
- Threshold adjustment untuk sensitivitas
- Visual lines dan labels
### 4. **Fair Value Gaps (FVG)**
- Multi-timeframe FVG detection
- Auto threshold filtering
- Bullish & Bearish FVG boxes
- Extension control
- Color customization
### 5. **Premium & Discount Zones**
- Premium Zone (75-100% dari range)
- Equilibrium Zone (47.5-52.5% dari range)
- Discount Zone (0-25% dari range)
- Auto-update berdasarkan swing high/low
### 6. **Fibonacci Retracement**
- **Equilibrium to Discount** - Fib dari EQ ke discount zone
- **Equilibrium to Premium** - Fib dari EQ ke premium zone
- **Discount to Premium** - Fib full range
- Reverse option
- Show/hide lines
- Custom colors
### 7. **Volume Profile (VRVP)**
- Visible Range Volume Profile
- Point of Control (POC)
- Value Area (70% volume)
- Auto-adjust rows
- Placement options (Left/Right)
- Width customization
### 8. **RSI Multi-Timeframe**
- Monitor 3 timeframes sekaligus
- Overbought/Oversold signals
- Visual table display
- Color-coded signals (Red OB, Green OS)
- Customizable position & size
### 9. **Moving Averages**
- 3 Moving Average lines
- Pilihan tipe: EMA, SMA, WMA
- Automatic/Manual period mode
- Individual color & width settings
- Cross alerts (MA vs MA, Price vs MA)
### 10. **Multi-Timeframe Levels**
- Support up to 5 different timeframes
- Previous high/low levels
- Custom line styles
- Color customization
### 11. **Candle Color**
- Color candles berdasarkan trend
- Bullish = Green, Bearish = Red
- Optional toggle
---
## 🛠️ Cara Penggunaan
### **A. Setup Awal**
1. **Tambahkan Indicator ke Chart**
- Buka TradingView
- Klik "Indicators" → "My Scripts" atau paste code
- Pilih "Smart Money Concepts "
2. **Pilih Mode Display**
- **Historical**: Tampilkan semua struktur (untuk backtesting)
- **Present**: Hanya tampilkan struktur terbaru (clean chart)
3. **Pilih Style**
- **Colored**: Warna berbeda untuk bullish/bearish
- **Monochrome**: Tema warna abu-abu
---
### **B. Penggunaan Fitur**
#### **1. Smart Money Structure**
**Internal Structure (Real-time):**
- ✅ Aktifkan "Show Internal Structure"
- Pilih tampilan: All, BOS only, atau CHoCH only
- Gunakan untuk entry timing presisi
- Filter confluence untuk mengurangi noise
**Swing Structure:**
- ✅ Aktifkan "Show Swing Structure"
- Pilih tampilan struktur bullish/bearish
- Adjust "Swings Length" (default: 50)
- Gunakan untuk konfirmasi trend utama
**Tips:**
- BOS = Konfirmasi trend continuation
- CHoCH = Warning untuk possible reversal
- Tunggu price retest ke order block setelah BOS
---
#### **2. Order Blocks**
**Setup:**
- ✅ Aktifkan Internal/Swing Order Blocks
- Set jumlah blocks yang ditampil (1-20)
- Pilih filter: ATR atau Cumulative Mean Range
- Pilih mitigation: Close atau High/Low
**Cara Trading:**
1. Tunggu BOS/CHoCH terbentuk
2. Identifikasi order block terdekat
3. Wait for price pullback ke order block
4. Entry saat price respek order block (rejection)
5. Stop loss di bawah/atas order block
6. Target: swing high/low berikutnya
**Color Code:**
- 🔵 Light Blue = Internal Bullish OB
- 🔴 Light Red = Internal Bearish OB
- 🔵 Dark Blue = Swing Bullish OB
- 🔴 Dark Red = Swing Bearish OB
---
#### **3. Equal Highs/Lows (EQH/EQL)**
**Setup:**
- ✅ Aktifkan "Equal High/Low"
- Set "Bars Confirmation" (default: 3)
- Adjust threshold (0-0.5, default: 0.1)
**Interpretasi:**
- EQH = Liquidity di atas, kemungkinan sweep lalu dump
- EQL = Liquidity di bawah, kemungkinan sweep lalu pump
- Biasanya smart money akan grab liquidity sebelum move besar
**Trading Strategy:**
- Wait for EQH/EQL formation
- Anticipate liquidity grab
- Entry setelah sweep dengan konfirmasi (order block, FVG, CHoCH)
---
#### **4. Fair Value Gaps (FVG)**
**Setup:**
- ✅ Aktifkan "Fair Value Gaps"
- Pilih timeframe (default: chart timeframe)
- Enable/disable auto threshold
- Set extension bars
**Cara Trading:**
1. Bullish FVG = Support zone untuk buy
2. Bearish FVG = Resistance zone untuk sell
3. Price tends to fill FVG (retest)
4. Entry saat price kembali ke FVG
5. Partial fill = valid, full fill = invalidated
**Tips:**
- FVG + Order Block = High probability setup
- Multi-timeframe FVG lebih kuat
- Unfilled FVG = strong momentum
---
#### **5. Premium & Discount Zones**
**Setup:**
- ✅ Aktifkan "Premium/Discount Zones"
- Zones akan auto-update berdasarkan swing high/low
**Interpretasi:**
- 🟢 **Discount Zone** = Area BUY (price murah)
- ⚪ **Equilibrium** = Neutral (50%)
- 🔴 **Premium Zone** = Area SELL (price mahal)
**Trading Strategy:**
- BUY dari discount zone
- SELL dari premium zone
- Avoid trading di equilibrium
- Combine dengan structure confirmation
---
#### **6. Fibonacci Retracement**
**Setup:**
- Pilih Fib yang ingin ditampilkan:
- Equilibrium to Discount
- Equilibrium to Premium
- Discount to Premium
- Toggle show lines
- Enable reverse jika perlu
- Custom colors
**Key Levels:**
- 0.236 = Shallow retracement
- 0.382 = Common retracement
- 0.5 = 50% golden level
- 0.618 = Golden ratio (penting!)
- 0.786 = Deep retracement
**Cara Pakai:**
- 0.618-0.786 = Ideal entry zone dalam trend
- Combine dengan order blocks
- Wait for confirmation candle
---
#### **7. Volume Profile (VRVP)**
**Setup:**
- ✅ Aktifkan "Show Volume Profile"
- Set jumlah rows (10-100)
- Adjust width (5-50%)
- Pilih placement (Left/Right)
- Enable POC dan Value Area
**Interpretasi:**
- **POC (Point of Control)** = Harga dengan volume tertinggi = magnet
- **Value Area** = 70% volume = fair price range
- **Low Volume Nodes** = Weak support/resistance
- **High Volume Nodes** = Strong support/resistance
**Trading:**
- POC acts as support/resistance
- Price tends to return to POC
- Breakout dari Value Area = momentum
---
#### **8. RSI Multi-Timeframe**
**Setup:**
- ✅ Aktifkan "Show RSI Table"
- Set 3 timeframes (default: chart, 5m, 15m)
- Set RSI period (default: 14)
- Set Overbought level (default: 70)
- Set Oversold level (default: 30)
- Pilih posisi & ukuran table
**Interpretasi:**
- 🟢 **OS (Oversold)** = RSI ≤ 30 = Kondisi jenuh jual
- 🔴 **OB (Overbought)** = RSI ≥ 70 = Kondisi jenuh beli
- **-** = Neutral zone
**Trading Strategy:**
1. Multi-timeframe alignment = strong signal
2. OS + Bullish structure = BUY signal
3. OB + Bearish structure = SELL signal
4. Divergence RSI vs Price = reversal warning
**Contoh:**
- TF1: OS, TF2: OS, TF3: OS + Price di discount zone = STRONG BUY
---
#### **9. Moving Averages**
**Setup:**
- Pilih MA Type: EMA, SMA, atau WMA (berlaku untuk ketiga MA)
- Pilih Period Mode: Automatic atau Manual
- Set period untuk MA 1, 2, 3 (default: 20, 50, 100)
- Custom color & width per MA
- ✅ Enable Cross Alerts
**Interpretasi:**
- **Golden Cross** = MA fast cross above MA slow = Bullish
- **Death Cross** = MA fast cross below MA slow = Bearish
- Price above all MAs = Strong uptrend
- Price below all MAs = Strong downtrend
**Trading Strategy:**
1. MA1 (20) = Short-term trend
2. MA2 (50) = Medium-term trend
3. MA3 (100) = Long-term trend
**Entry Signals:**
- Price bounce dari MA dalam trend = continuation
- MA cross dengan konfirmasi structure = entry
- Multiple MA confluence = strong support/resistance
**Alerts Available:**
- MA1 cross MA2/MA3
- MA2 cross MA3
- Price cross any MA
---
#### **10. Multi-Timeframe Levels**
**Setup:**
- Enable HTF Level 1-5
- Set timeframes (contoh: 5m, 1H, 4H, D, W)
- Pilih line style (solid/dashed/dotted)
- Custom colors
**Cara Pakai:**
- Previous high/low dari HTF = strong S/R
- Breakout HTF level = significant move
- Multiple HTF levels confluence = major zone
---
### **C. Trading Setup Combination**
#### **Setup 1: High Probability Buy (Bullish)**
1. ✅ Swing structure: Bullish BOS
2. ✅ Price di Discount Zone
3. ✅ Pullback ke Bullish Order Block
4. ✅ Bullish FVG di bawah
5. ✅ RSI Multi-TF: Oversold
6. ✅ Price bounce dari MA
7. ✅ POC/Value Area support
8. ✅ Fibonacci 0.618-0.786 retracement
**Entry:** Saat price reject dari order block dengan confirmation candle
**Stop Loss:** Below order block
**Target:** Swing high atau premium zone
---
#### **Setup 2: High Probability Sell (Bearish)**
1. ✅ Swing structure: Bearish BOS
2. ✅ Price di Premium Zone
3. ✅ Pullback ke Bearish Order Block
4. ✅ Bearish FVG di atas
5. ✅ RSI Multi-TF: Overbought
6. ✅ Price reject dari MA
7. ✅ POC/Value Area resistance
8. ✅ Fibonacci 0.618-0.786 retracement
**Entry:** Saat price reject dari order block dengan confirmation candle
**Stop Loss:** Above order block
**Target:** Swing low atau discount zone
---
#### **Setup 3: Liquidity Grab (EQH/EQL)**
1. ✅ Identifikasi EQH atau EQL
2. ✅ Wait for liquidity sweep
3. ✅ Konfirmasi dengan CHoCH
4. ✅ Order block terbentuk setelah sweep
5. ✅ Entry saat retest order block
---
### **D. Tips & Best Practices**
**Risk Management:**
- Selalu gunakan stop loss
- Risk 1-2% per trade
- Risk:Reward minimum 1:2
- Jangan over-leverage
**Confluence adalah Kunci:**
- Minimal 3-4 konfirmasi sebelum entry
- Lebih banyak konfirmasi = higher probability
- Quality over quantity
**Timeframe Analysis:**
- HTF (Higher Timeframe) = Trend direction
- LTF (Lower Timeframe) = Entry timing
- Align dengan HTF trend
**Backtesting:**
- Gunakan mode "Historical"
- Test strategy di berbagai market condition
- Record dan analyze hasil
**Market Condition:**
- Trending market = Follow BOS, use order blocks
- Ranging market = Use premium/discount zones, EQH/EQL
- High volatility = Wider stops, wait for clear structure
**Avoid:**
- Trading di equilibrium zone
- Entry tanpa konfirmasi
- Fighting the trend
- Overleveraging
- Emotional trading
---
## 📈 Recommended Settings
### **For Scalping (1m - 5m):**
- Internal Structure: ON
- Swing Structure: OFF
- Order Blocks: Internal only
- RSI Timeframes: 1m, 5m, 15m
- MA Periods: 9, 21, 50
### **For Day Trading (15m - 1H):**
- Internal Structure: ON
- Swing Structure: ON
- Order Blocks: Both
- RSI Timeframes: 15m, 1H, 4H
- MA Periods: 20, 50, 100
### **For Swing Trading (4H - D):**
- Internal Structure: OFF
- Swing Structure: ON
- Order Blocks: Swing only
- RSI Timeframes: 4H, D, W
- MA Periods: 20, 50, 200
---
## ⚠️ Disclaimer
Indicator ini adalah alat bantu analisis teknikal. Tidak ada indicator yang 100% akurat. Selalu:
- Lakukan analisa fundamental
- Gunakan proper risk management
- Praktik di demo account terlebih dahulu
- Trading memiliki resiko, trade at your own risk
---
## 📝 Version Info
**Version:** 5.0
**Platform:** TradingView Pine Script v5
**Author:** XoRonX
**Max Labels:** 500
**Max Lines:** 500
**Max Boxes:** 500
---
## 🔄 Updates & Support
Untuk update, bug reports, atau pertanyaan:
- Check documentation regularly
- Test new features in replay mode
- Backup your settings before updates
---
## 🎓 Learning Resources
**Recommended Study:**
1. Smart Money Concepts (SMC) basics
2. Order blocks theory
3. Liquidity concepts
4. ICT (Inner Circle Trader) concepts
5. Volume profile analysis
6. Multi-timeframe analysis
**Practice:**
- Start with higher timeframes
- Master one concept at a time
- Keep a trading journal
- Review your trades weekly
---
**Happy Trading! 🚀📊**
_Remember: The best indicator is your own analysis and discipline._

Auto Trend & Scalping Pro Atilla SPECIALAUTO TREND & SCALPING PRO — ATILLA SPECIAL EDITION
Auto Trend & Scalping Pro is an advanced, multi-confirmation algorithm designed for fast scalping (1m–5m) and reliable trend-following (15m–4h).
This special edition is custom-optimized for Atilla, combining EMA structure, momentum indicators, and volatility filters to generate clean, high-accuracy trading conditions.
---
🔥 Core Features
• Multi-EMA Trend Engine (13/50/200)
Analyzes the structure of the trend and generates a 0–200 Trend Power Score:
0–50 → Weak
50–100 → Medium
100–170 → Strong
170–200 → Very Strong
• 4-Indicator Confirmation Voting
The system uses:
MACD (momentum shift)
RSI (zone pressure)
STC (smooth trend phase)
ATR (volatility strength)
Each indicator votes Bull / Bear.
Total votes produce a 0–100% confirmation power.
• Sideways Market Filter
Auto-detects consolidation using:
EMA distance %
ATR volatility %
RSI 45–55 neutral zone
When sideways → All signals are blocked to avoid fake entries.
• Auto “LONG READY / SHORT READY” States
Signals activate ONLY when:
Trend is strong
Indicators confirm the direction
Market is not sideways
This eliminates noise and prevents false entries.
---
🟩 Real-Time Dashboard (Top-Right Panel)
Displays:
Market Mode (LONG READY / SHORT READY / WAIT / SIDEWAYS STOP)
EMA Power
Confirmation Strength (%)
MACD / RSI / STC / VOL status
Trend strength & filter state
All updates in real time on every candle.
---
⚡️ Scalping Optimized
Perfect for:
1 minute
3 minute
5 minute Ultra fast trend reading & correction detection.
Also stable on:
15m
30m
1H–4H (trend-following mode)
Works on all crypto pairs including BTC, ETH, BNB, SOL, AVAX, ADA, and more.
---
📌 Extra Notes
No repaint
Safe entry logic
Filters fake breakouts
Professional-grade clarity

TraderDemircan Trend Based Fibonacci + XABCD FormationDescription
TraderDemircan Trend-Based Fibonacci + XABCD Formation is an original open-source indicator that combines trend-based Fibonacci projections with an automated XABC structure detection engine.
The script focuses on identifying swing high → swing low transitions in a downtrend, generating Fibonacci levels and projecting a potential C-target extension based on harmonic geometry.
This indicator is designed for traders who want a clearer visual structure of how retracement, continuation, and harmonic projections interact inside trending markets.
🧩 What the Script Does
1. Detects the Most Recent X–A Swing (Trend High → Trend Low)
The indicator automatically scans a user-defined lookback range to identify:
X: Most recent significant swing high
A: The lowest low after X within the lookback window
This creates the foundational XA leg used for both Fibonacci levels and harmonic projections.
2. Determines a Dynamic B-Point Retracement
The script measures the market’s current retracement relative to the XA leg:
If price retraces below 0.50, B becomes the 0.50 level
If price retraces above 0.50, B becomes the 0.382 level
The algorithm ensures proper harmonic logic by validating that price stays below the B-level, preventing invalid structures.
3. Projects a Harmonic C-Target
Using harmonic extension logic, the script calculates:
C = B − (X − A)
This projects a symmetrical continuation leg relative to XA, giving traders an estimated “C-completion zone."
The C-target is displayed visually and numerically in an on-chart info table.
4. Plots Full Trend-Based Fibonacci Levels
The indicator draws Fibonacci levels from 0.0 to 2.618
Users can independently enable/disable each level, adjust line styling, choose color themes, add price labels, and display retracement percentages.
🎨 Visualization & Usability
The script includes:
Clean, customizable Fibonacci layout
Optional price labels & percentage labels
Extendable line options
Highlighted XABC structure
Dashed projection lines for the C-target
A compact info table showing X, A, B, C prices
This helps traders visually track structural market progression with clarity.
📘 Conceptual Foundation
This indicator is based on:
Trend-retracement logic using classic Fibonacci ratios
Structural swing identification
Basic harmonic symmetry (XA → BC projection)
Downtrend-based continuation expectations
It does not attempt to identify full harmonic patterns (like Gartley, Bat, or Crab), but instead focuses on the trend-based XABC segment and projected continuation targets.
🔧 Inputs Overview
Key user controls include:
Lookback window for pivot detection
Individual Fibonacci level visibility toggles
Color controls & line styling
Label display options
XABC formation display toggle
C-target on/off
All parameter names in the script are English; if translations appear in inputs, their English equivalents are included here to comply with TradingView publication rules.
⚠️ Limitations & Notes
The indicator does not predict future price direction.
It does not repaint, but pivot detection naturally depends on completed bars.
The C-projection is a geometric estimate, not a trading signal.
No forward-looking or non-causal data is used.
This tool is intended for structural analysis, not automated strategy execution.
📎 How to Use It
Add the indicator to a clean chart.
Observe the most recent X → A swing.
Watch how price interacts with 0.382 / 0.5 retracement to form the B-point.
Use the projected C-target as a reference zone for potential continuation completions.
Combine with your own trend, momentum, or volume methods for confirmation.
✔ Originality
This script is fully original and not derived from any pre-existing public script.
It combines:
Automated dynamic trend-based Fibonacci framework
Custom XABC structure detection
Harmonic-style C projection logic
Fully customizable visualization system
The indicator is intended to add meaningful analytical value to the community beyond standard Fibonacci tools.

Smart Money Flow V6 Pro📊 Smart Money Flow V6 Pro
🎯 Overview
Smart Money Flow V6 Pro is an advanced multi-timeframe indicator designed to detect institutional order flow and smart money accumulation/distribution patterns. It combines delta volume analysis, order block detection, and opening range breakout strategies to identify high-probability trading opportunities.
🔍 What Makes This Indicator Unique?
1. Proprietary Delta Flow Analysis
Unlike standard volume indicators, this script calculates:
Cumulative Delta: Tracks the net difference between buying and selling pressure over time
Delta Momentum Oscillator: Uses RSI calculation on cumulative delta to identify momentum shifts
Volume-Weighted Delta: Multiplies delta by volume-to-average-volume ratio for stronger signals
Why it matters: Standard volume indicators show only total volume. This script separates buying vs selling volume to reveal institutional footprints that retail traders miss.
2. Smart Money Divergence Detection
The indicator identifies hidden smart money activity through:
Bullish Divergence: Price makes lower lows while cumulative delta makes higher lows (institutions accumulating)
Bearish Divergence: Price makes higher highs while cumulative delta makes lower highs (institutions distributing)
Calculation Method: Compares 5-bar price movement against cumulative delta direction to spot divergences
3. Institutional Order Block Identification
Order blocks represent price levels where large institutions placed significant orders:
Bullish OB: Detected after 2+ consecutive down candles followed by a strong bullish candle (>50% of previous range)
Bearish OB: Detected after 2+ consecutive up candles followed by a strong bearish candle
Visual Display: Boxes extend right to show active zones where price may react
4. Opening Range Breakout System
Tracks the first 30 minutes (customizable) of trading:
Identifies OR High, Low, and Midpoint
Monitors breakouts/breakdowns for directional bias
Only activates after OR period completes
Usage: Helps traders align with the day's initial institutional positioning
5. Dynamic Support/Resistance
Uses pivot point detection with tolerance zones:
Stores last 5 resistance and 5 support levels
Creates zones (default 0.5% tolerance) around key levels
Updates dynamically as new pivots form
Calculation: pivothigh()/pivotlow() functions with 10-bar lookback, stored in arrays
6. Three Signal Modes for Different Trading Styles
Aggressive Mode:
Triggers: Trend alignment + positive delta momentum
Best for: Active scalpers, high-frequency trading
Signal frequency: High
Balanced Mode (Recommended):
Triggers: Trend + delta momentum threshold (>30) + confluence (divergence OR S/R OR order block)
Best for: Swing traders, position traders
Signal frequency: Medium
Conservative Mode:
Triggers: All balanced conditions + high volume + divergence confirmation
Best for: Risk-averse traders, larger positions
Signal frequency: Low but highly accurate
📈 How It Works (Technical Methodology)
Step 1: Volume Analysis
buyVolume = close > open ? volume : 0
sellVolume = close < open ? volume : 0
delta = buyVolume - sellVolume
cumDelta += delta (running total)
Step 2: Momentum Calculation
deltaMomentum = RSI(cumDelta, 14) - 50
This normalizes cumulative delta into an oscillator ranging from -50 to +50
Step 3: Trend Filter
EMA(20) determines trend direction
Signals only trigger WITH the trend (no counter-trend trades)
Step 4: Signal Generation Logic
Buy Signal (Balanced Mode):
Price > EMA(20) ✓
Delta > 0 AND cumDelta rising ✓
Volume > 1.2x average ✓
Delta Momentum > 30 ✓
At least ONE: Bullish divergence OR near support OR bullish order block ✓
Sell Signal: Opposite conditions
Step 5: Visual Confirmation
Large triangles for primary signals
Small circles for divergences
Boxes for order blocks
Lines for OR levels and S/R
🎨 Dashboard Metrics Explained
The real-time dashboard shows:
Delta: Current bar's buy/sell pressure
Cum Delta: Running total (positive = bullish bias)
Momentum: RSI-based oscillator (-50 to +50)
Trend: EMA direction
Volume: Compared to average (HIGH/NORMAL/LOW)
OR Status: Price position relative to opening range
S/R Level: Proximity to support/resistance
Order Block: Active institutional zones
Divergence: Smart money divergence status
Mode: Current signal sensitivity
Price: Current close
SIGNAL: Overall market bias (STRONG BUY/SELL/WAIT)
🔧 How to Use This Indicator
For Day Traders:
Wait for opening range to complete (default 9:15-9:45)
Use Aggressive or Balanced mode
Take signals that align with OR breakout direction
Exit at opposite order block or S/R level
For Swing Traders:
Use Conservative or Balanced mode
Enter only on divergence + signal confluence
Hold through minor pullbacks to order blocks
Trail stops below/above order blocks
For Scalpers:
Use Aggressive mode on lower timeframes (1-5 min)
Take quick profits at S/R levels
Monitor delta momentum for exhaustion
Exit if momentum crosses zero line
⚠️ Important Notes
What This Indicator Does NOT Do:
Does NOT repaint (all calculations finalize on bar close)
Does NOT use future data
Does NOT guarantee profits (no indicator does)
Originality Statement:
This indicator is NOT a simple combination of existing indicators. It features:
Custom delta calculations not available in standard volume indicators
Unique momentum oscillator using RSI on cumulative delta (not price)
Proprietary signal logic that requires multiple confluence factors
Dynamic order block detection with automatic zone management
Three-mode signal system allowing strategy customization
Why Closed Source?
The specific thresholds, weighting factors, and signal combination logic represent proprietary research. The methodology is fully disclosed above, but exact parameters are protected.
📊 Best Practices
Always use with proper risk management (2% max per trade)
Combine with price action (don't trade signals blindly)
Backtest on your specific instrument before live trading
Adjust parameters for different markets (forex, stocks, crypto)
Start with Conservative mode until familiar with signals
🔔 Alert Conditions Available
Long Signal
Short Signal
Bullish Divergence
Bearish Divergence
Bullish Order Block
Bearish Order Block
📞 Disclaimer
This indicator is for educational purposes. Past performance does not guarantee future results. Always practice proper risk management and never risk more than you can afford to lose.

ROC + dROC + d2ROC (with z-scores & percentiles)This indicator measures how price momentum is changing — not just whether it’s rising or falling, but how quickly that change itself is accelerating or slowing. It starts with the Rate of Change (ROC), which shows how much price has moved over a set period. The first derivative (ΔROC) tracks how ROC is changing from bar to bar, and the second derivative (Δ²ROC) shows whether that change is speeding up or fading — essentially the “acceleration” of momentum. Positive Δ²ROC means momentum is strengthening; negative means it’s weakening. The script also quantifies how extreme those shifts are using z-scores and percentiles, helping spot Druckenmiller-style turning points where trends often begin or end.

market geometrymarket geometry
draws po3 dealing ranges, can select po3 number and custom range multiplier
can also use volatility based dealing ranges (not tested & verified)

Pattern DetectorPattern Detector
Identifies and summarizes common chart patterns on any symbol/timeframe. Shows a compact table of the most recent confirmed patterns (up to 6), optional candle coloring that matches table row colors, and optional targets for context. Designed for analysis support only.
What it detects
Triangles and wedges, flags and pennants, head & shoulders (and inverse), rectangles, channels, broadening formations, double/triple tops & bottoms, cup & handle (and inverse), rounding tops/bottoms, diamonds, bump & run, island reversals, staircase patterns, V patterns, gaps (up/down), pipe/spike patterns, harmonic ABCD, Elliott (simplified), three drives, Quasimodo, dead cat bounce, tower top/bottom, shakeout, and Wolfe waves.
Inputs
Lookback Mode: Auto or Manual (Manual Lookback bars)
Min Confidence to Confirm: threshold for confirmation
Display: Show Pattern Table, Show Pattern Numbers, Color Pattern Candles
Style: table row colors; bullish/bearish direction colors
Notes:
Candle coloring uses the table’s row colors and requires Show Pattern Table to be enabled.
Targets are approximate and for reference only.
Alerts
Pattern Confirmed
Pattern Target Reached
Important
Educational/information tool only; not a signal generator and not financial advice.
No performance guarantees. Use with other analysis and risk management.
Calculations update in real time; confirmations happen on closed bars. Detected patterns can change intrabar; use closed‑bar alerts for greater reliability.
Results may vary by symbol, timeframe, liquidity, and volatility.

KayeDinero TrendSetter v6 - KultureMetricsScript 4 the Kulture and the Swingers
KayeDinero TrendSetter v6 – KultureMetrics is a professional-grade, multi-confirmation trading framework that combines trend, volatility, and momentum analysis into a unified signal system.
It’s optimized for equities, indices, and crypto on intraday to swing-term timeframes.
⚙️ Core Logic
The indicator merges three high-probability systems:
Simple Moving Average (SMA): defines directional bias and major trend breakouts.
Keltner Channels (KC): captures overbought/oversold volatility extremes and mean-reversion zones.
Stochastic Oscillator (STOCH): refines timing by identifying short-term momentum shifts within broader trends.
These signals are filtered by a higher-timeframe trend alignment filter (HTF), ensuring that long trades align with higher-level bullish momentum and short trades align with bearish structure.
💡 Risk & Money Management
Automatically calculates ATR-based stop loss and reward-to-risk (R:R) targets.
Dynamically computes position size based on your chosen risk % per trade.
Optional visualizations for stop and target levels (color-coded line breaks).

Harmonic Patterns Pro - Exact Ratios [abusuhil]═══════════════════════════════════════════════════════════════════
Harmonic Patterns Pro - Exact Ratios
═══════════════════════════════════════════════════════════════════
ENGLISH DESCRIPTION:
A professional harmonic pattern detector using precise Fibonacci ratios based on standard harmonic analysis reference tables.
KEY FEATURES:
• Exact Ratio System: Uses precise ratios from harmonic pattern reference tables
• Advanced Tolerance Control: Choose between 4 detection modes (All Exact, Exact+1, Exact+2, Exact+3 Flexible)
• Customizable Tolerance: Adjust exact (±3% default) and flexible (±8% default) tolerance levels
• 9 Harmonic Patterns: Gartley, Bat, Alternate Bat, Butterfly, Crab, Deep Crab, Shark, Cypher, AB=CD
• Smart ZigZag: Automatic pivot point detection
• PRZ Zones: Visual potential reversal zones
• Multiple Targets: TP1 (38.2%), TP2 (61.8%), TP3 (Point C)
• Auto Stop Loss: Calculated based on pattern structure
• Simplified Mode: Clean view with only essential signals
• Full Customization: Colors, opacity, sizes, styles
• Built-in Alerts: Notifications for pattern completion
WHAT MAKES IT DIFFERENT:
Unlike traditional harmonic indicators using approximate ratios, this indicator:
- Uses exact ratios from harmonic pattern reference tables
- Provides intelligent ratio tolerance control
- Allows mixing exact and flexible ratios
- Reduces false signals through advanced pattern matching
- Supports both conservative and aggressive trading approaches
HOW TO USE:
1. Select your preferred tolerance mode (Exact + 2 Flexible recommended for balanced detection)
2. Adjust tolerance percentages if needed
3. Enable/disable specific patterns based on your strategy
4. Customize visual settings
5. Set up alerts for automatic notifications
6. Use TP1, TP2, TP3 for profit-taking strategy
7. Place stop loss according to the SL indicator line
DISCLAIMER:
This indicator is provided for educational and informational purposes only. It should not be considered as financial advice or a recommendation to buy or sell any financial instrument. Trading involves substantial risk of loss. Always perform your own analysis, use proper risk management, and consult with a qualified financial advisor before making trading decisions. Past performance is not indicative of future results.
═══════════════════════════════════════════════════════════════════
الوصف بالعربية:
كاشف احترافي للأنماط التوافقية يستخدم نسب فيبوناتشي الدقيقة المبنية على جداول التحليل التوافقي المرجعية القياسية.
المميزات الرئيسية:
• نظام النسب الدقيقة: يستخدم نسباً دقيقة من جداول الأنماط التوافقية المرجعية
• التحكم المتقدم بالتسامح: اختر بين 4 أوضاع كشف (كل النسب دقيقة، دقيق+1، دقيق+2، دقيق+3 مرن)
• تسامح قابل للتخصيص: اضبط مستويات التسامح الدقيق (±3% افتراضي) والمرن (±8% افتراضي)
• 9 أنماط توافقية: جارتلي، خفاش، خفاش بديل، فراشة، سلطعون، سلطعون عميق، قرش، سايفر، AB=CD
• زجزاج ذكي: كشف تلقائي لنقاط الارتكاز
• مناطق PRZ: مناطق مرئية للانعكاسات المحتملة
• أهداف متعددة: TP1 (38.2%)، TP2 (61.8%)، TP3 (النقطة C)
• وقف خسارة تلقائي: يُحسب بناءً على هيكل النمط
• وضع مبسط: عرض نظيف بالإشارات الأساسية فقط
• تخصيص كامل: الألوان، الشفافية، الأحجام، الأنماط
• تنبيهات مدمجة: إشعارات لاكتمال الأنماط
ما الذي يميزه:
على عكس مؤشرات الأنماط التوافقية التقليدية التي تستخدم نسباً تقريبية، هذا المؤشر:
- يستخدم نسباً دقيقة من جداول الأنماط التوافقية المرجعية
- يوفر تحكماً ذكياً بتسامح النسب
- يسمح بمزج النسب الدقيقة والمرنة
- يقلل الإشارات الخاطئة من خلال المطابقة المتقدمة للأنماط
- يدعم أساليب التداول المحافظة والعدوانية
كيفية الاستخدام:
1. اختر وضع التسامح المفضل (دقيق + 2 مرن موصى به للكشف المتوازن)
2. اضبط نسب التسامح إذا لزم الأمر
3. فعّل/عطّل أنماط معينة بناءً على استراتيجيتك
4. خصص إعدادات العرض
5. اضبط التنبيهات للإشعارات التلقائية
6. استخدم TP1 وTP2 وTP3 لاستراتيجية جني الأرباح
7. ضع وقف الخسارة وفقاً لخط مؤشر SL
إخلاء المسؤولية:
يُقدم هذا المؤشر لأغراض تعليمية وإعلامية فقط. لا ينبغي اعتباره نصيحة مالية أو توصية لشراء أو بيع أي أداة مالية. ينطوي التداول على مخاطر كبيرة للخسارة. قم دائماً بإجراء التحليل الخاص بك، واستخدم إدارة مخاطر مناسبة، واستشر مستشاراً مالياً مؤهلاً قبل اتخاذ قرارات التداول. الأداء السابق ليس مؤشراً على النتائج المستقبلية.
═══════════════════════════════════════════════════════════════════
