Assassin OHLCshow yesterday Daily high and low ,close(today's open).
You can save It yourself for change show last value.
Pine script limit change the length from configure.
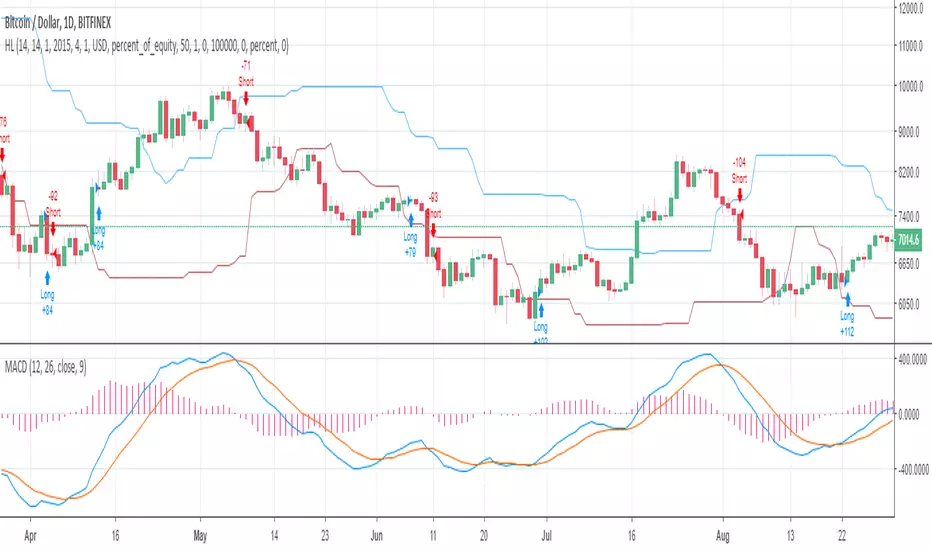
高低差指数(H-L)

New Highs-Lows AMEX-Buschi
English:
This indicator shows the AMEX's up volume (green) and down volume (red).
Extreme trading days with more than 90 % up or down volume are marked via lines (theoretically values) and triangles (breaches).
Deutsch:
Dieser Indikator zeigt das Aufwärts- (grün) und Abwärts-Volumen (rot) der AMEX.
Extreme Handelstage mit mehr als 90 % Aufwärts- oder Abwärts-Volumen ist gekennzeichnet über Linien (theoretische Werte) und Dreiecke (Überschreitungen).
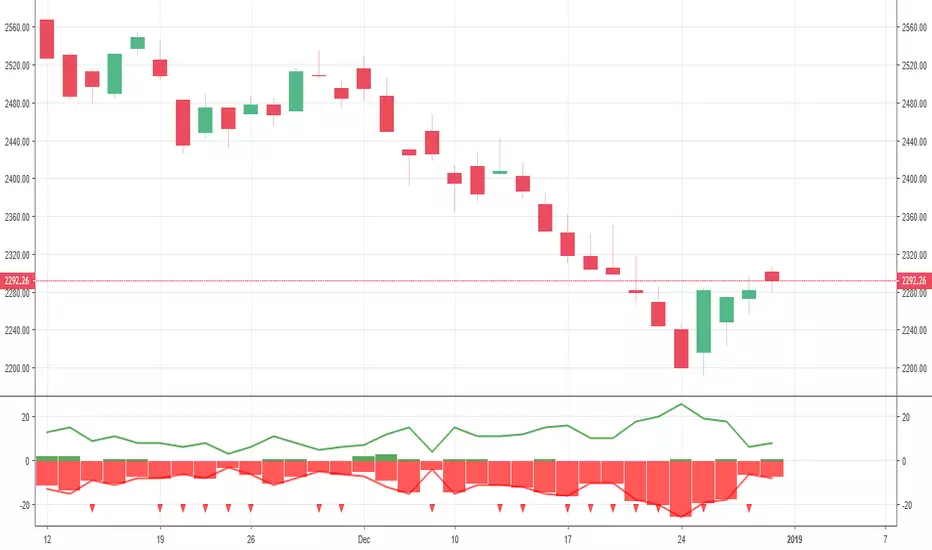
New Highs-Lows NASDAQ-Buschi
English:
This indicator shows the NASDAQ's new highs (green) and new lows (red).
Extreme trading days with more than 99 % new highs relative to new lows vice versa are marked via lines (theoretically values) and triangles (breaches).
Deutsch:
Dieser Indikator zeigt die neuen Hochs (grün) und neuen Tiefs (rot) der NASDAQ.
Extreme Handelstage mit mehr als 99 % neuen Hochs relativ zu den neuen Tiefs und andersherum sind gekennzeichnet über Linien (theoretische Werte) und Dreiecke (Überschreitungen).
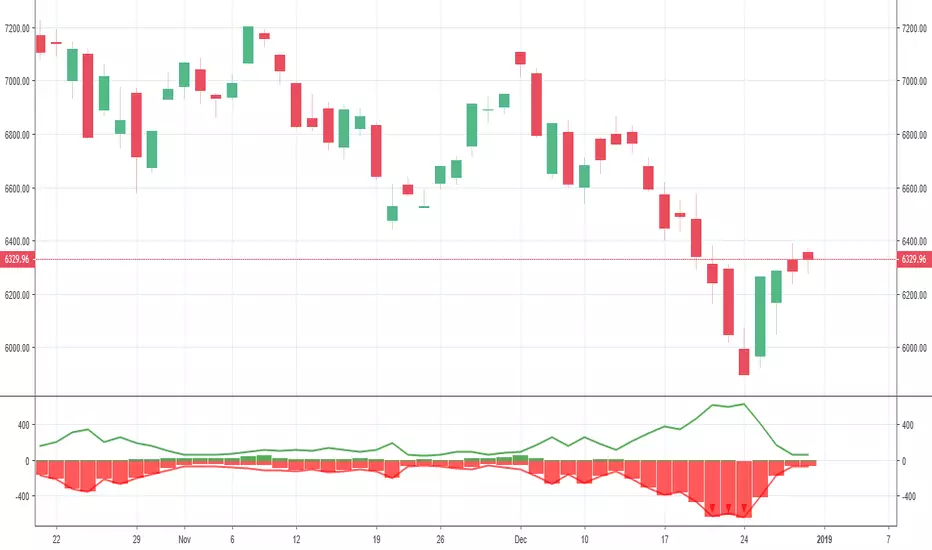
New Highs-Lows NYSE-Buschi
English:
This indicator shows the NYSE's new highs (green) and new lows (red).
Extreme trading days with more than 99 % new highs relative to new lows vice versa are marked via lines (theoretically values) and triangles (breaches).
Deutsch:
Dieser Indikator zeigt die neuen Hochs (grün) und neuen Tiefs (rot) der NYSE.
Extreme Handelstage mit mehr als 99 % neuen Hochs relativ zu den neuen Tiefs und andersherum sind gekennzeichnet über Linien (theoretische Werte) und Dreiecke (Überschreitungen).


Nemesis Swing High Low Support/Resistance Pivot Points by ZekisNemesis Swing High Low Support and Resistance Pivot Points Channel
An indicator that project support and resistance, highs and lows and pivot points
There are a lot of strategies where it can be used, a little google or youtube search for more infos
I colored with black the channel and green when the price breaks the resistance and red when breaks the support for a better view
Values for support and resistance can be adjusted
*Soon i will add alerts for breakeouts
Enjoy!
@ Zekis

Swing IndicatorV 1.0
This indicator shows the previous high and low price for trader who using Swing as trading strategy
Options:
Change counts of left bar and right bar for finding High|Low
Change source of Price for finding High|Low
Select plot or not plot some data on the chart
Guide for colors and shapes:
Green diamond show the previous high swing
Red diamond show the previous low swing
Label up and down with number show the previous High or Low (Green is High and Red is Low)
Note: For use this script, you can favorite it and then apply to any chart.

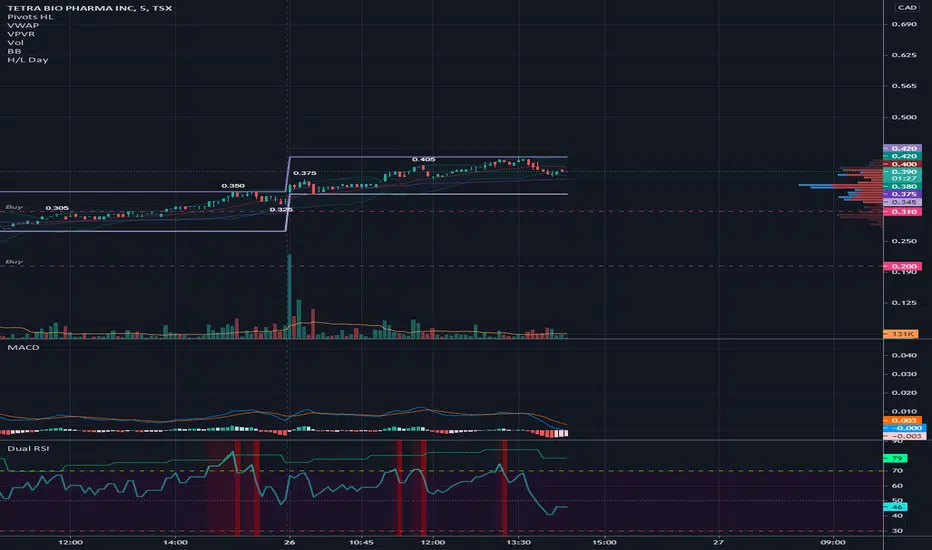
💪 Support / Resistenace 👊 Finder by 🇨🇷🇾🇵🇹🇴🇷🇹🇭🇾🇭🇲🇸💪 Support / Resistenace 👊 Finder (SRF) dynamically finds support and resistance (supply and demand) levels automatically and weights them accordingly. This is a great tool to use when determining entry/exit upon S/R areas.
💰This indicator is given FREE to all our premium indicator subscribers.
📡SRF calculates the levels working from the current price. So even if you are looking old at historical data it will still calculate the S/R levels from the most recent data. (i.e. it really only works for the last few months on most instruments)
📑The indicator works on any timeframe and any market (stocks, forex, crypto, gold, oil).
📊The option "Pre length" can be changed to fit your needs. It will determine how much historical data the indicator will evaluate for each S/R level.
📊You can also choose how many support/resistance lines to plot from the dropdown menu.
📉Lastly you can also show the current/previous week or months OLHC values. These can often act as S/R levels as well. I suggest only using one at a time or it can get confusing.
💬Come chat with us in telegram (link in signature) if you have any questions or would like a trial of a premium indicators (linked below).
Bull Bear Filter
Bottom Top Finder

Real Price for Heikin Ashi ChartsThe indicator is in the top left of the screen! That's all there is, by design.
This is a super simple indicator that allows you to see what the real price of a candle was when using Heikin Ashi charts, while not cluttering up your screen.
HA charts are a great way to help those who can be spooked by the chaos of the markets (I'm one!), but they have a big drawback in that the price you see on a HA candle is often significantly different from the real price that you would trade on. This brings issues of unrealistic expectations of profits/losses, and also makes back testing a strategy very difficult. I still wouldn't recommend ever using TradingView's "strategy" tool when using HA charts, but using this indicator you can do accurate manual back tests.
There's nothing plotted on the screen given that there's no real point in it, but you can make the lines appear if you wish - just go into settings and change the transparency.
The order of the numbers on the indicator match the OHLC (Open, High, Low, Close) format.
There's also settings to turn off one or more of the OHLC values, simply open the settings and go to Inputs. This could be useful for some people, as the High and Low values of HA candles are the same as regular candles. Only the Open and Close are different.
Any queries let me know.
DreamsDefined


Relative Strength CryptoMeasures Relative Strength of a crypto asset to the an index consisting of top 10 alts + btc

Cenobar PPHLthis is an script for support and ressitance zone area
i use fib ret and high low to find best zone for entry and exit.

TTPro High Low Signals 1 v6TTpro High Low Signals 1 v6 indicator is a versatile leading indicator designed to identify optimal entry and exit points, overbought and oversold signals, and its also useful in identifying trends. When the signal line is above the mid level, trend favors the bulls and when the line is below the mid level, the trend favours the bears. Bullish and bearish divergences can be used to detect early momentum shifts and anticipate trend reversals also. Visit www.turbotraderpro.com for more details.


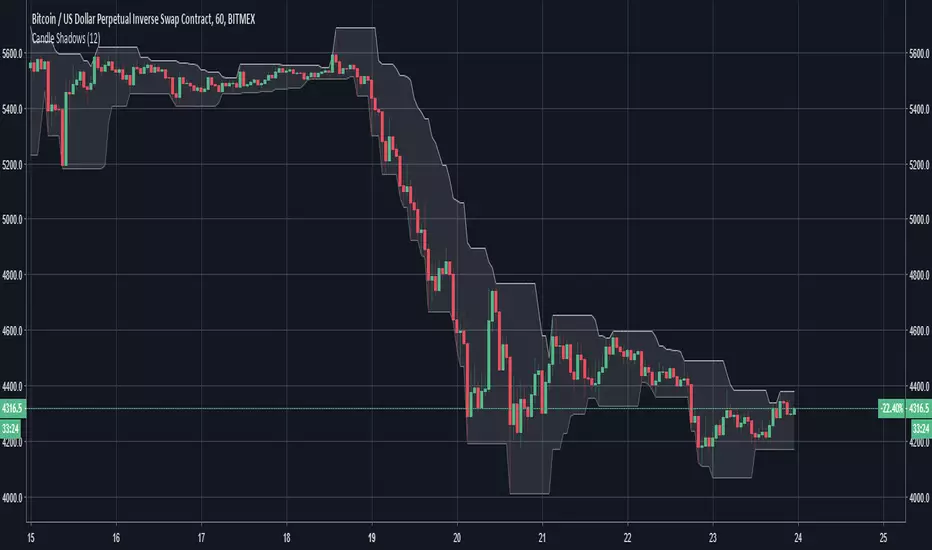
Candle ShadowsQuick and dirty script to show "shadows" off of wicks so they're easier to see, especially when zoomed out.