Backtst CloudHappy Holidays here is a gift!
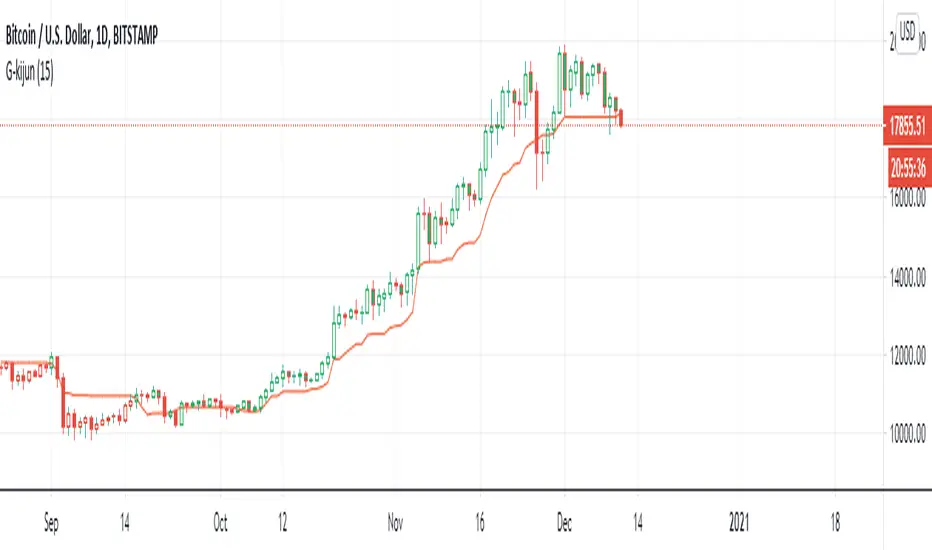
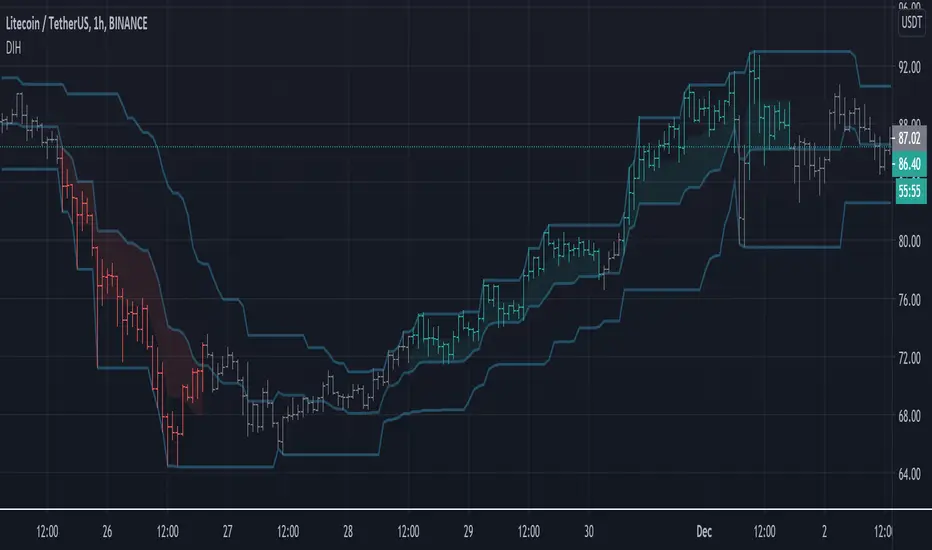
This a cleaned up Ichimoku cloud with RSI coloring.
Can be used to remove some of the the noise.
How to read chart:
Cloud support and resistance zones.
A green line is RSI > 50
A red line is RSI <= 50
Pine Script®指标