NativeLenSA CISD w/1st 5m FVG5m CISD + FVG Indicator which works best on 5m TimeFrame, with the concept of 5m Liquidity sweeps of the previous highs/lows and the next candle closing below/above the opening price of candle that swept the highs/lows.
A line marking +CISD or -CISD will show as soon as the CISD is created, and a first 5m Fair Value Gap will also be displayed. This is advantageous for an extra confluence and re-entry.
The indicator also provides the trader with:
i. The flexibility of allowing to only show Bearish, Bullish or both Bearish and Bullish CISD + FVG,
ii. Showing only London Session, New York Session, or both London and New York Sessions' CISD & FVG,
iii. Option of hiding/showing 5m CISD+FVG on time frames greater than 5m,
iv. Adjustable:
(a) Look back bars (max=300),
(b) CISD line length,
(c) FVG line length,
v. Customizable Bearish and Bullish CISD line colors.
I hope you find value in this indicator, and convenient for time when trading, no CISD markups needed
Ict

Silver BulletSilver Bullet is a trading tool built for finding cleaner, higher-probability setups. It focuses on key windows of market movement and adds helpful tools like daily range levels and candlestick patterns.
Whether you’re trading breakouts or reversals, Silver Bullet gives you a clearer view of the market and more confidence in your setups.
⸻
🔹 Trading Setup #1: Macro Time
The Macro Time setting offers two modes: Macro Bullet and Silver Bullet. Both help traders focus on specific times when the market tends to deliver clean moves.
• Macro Bullet is based on the high and low of a full macro session. It automatically detects the session’s range and bias, then offers optimal entries for either Long or Short setups. Once the session resolves, it provides Fibonacci-based levels for entry, target, and stop loss.
• Silver Bullet is based on ICT concepts and focuses on the hourly range for London, NY AM, and NY PM sessions. It’s designed for quick time blocks and highlights key levels as the session unfolds.
To use this setup, set Macro Time to “ICT Sessions” and select your preferred mode under Bullet Mode.
⸻
🔹 Trading Setup #2: Daily Range
Enable Daily Range to draw Fibonacci levels based on either the previous day’s candle or the current day’s developing range. These levels help you identify potential support, resistance, and midpoint zones throughout the day.
With the current day’s range, levels automatically update in real time as new highs or lows form — keeping your chart aligned with evolving price action.
⸻
🔹 Trading Setup #3: Candlestick Patterns
Turn on Candlestick Patterns to automatically highlight clean reversal signals such as Hammers, Hanging Men, Shooting Stars, and Tweezers. Each pattern is detected using specific criteria and trend filters to reduce noise and improve reliability. They work especially well as confirmation signals around key levels or session zones.
Silver Bullet brings structure, clarity, and precision to your intraday trading. By combining time-based bias, price action levels, and pattern recognition, it helps you trade with purpose — not guesswork. Use one setup or combine all three for a complete view of the market, tailored to your style and session of choice.

NOMANOMA Adaptive Confidence Strategy —
What is NOMA?
NOMA is a next-generation, confidence-weighted trading strategy that fuses modern trend logic, multi-factor market structure, and adaptive risk controls—delivering a systematic edge across futures, stocks, forex, and crypto markets. Designed for precision, adaptability, and hands-off automation, NOMA provides actionable trade signals and real-time alerts so you never miss a high-conviction opportunity.
Key Benefits & Why Use NOMA?
Trade With Confidence, Not Guesswork:
NOMA combines over 11 institutional-grade confirmations (market structure, order flow, volatility, liquidity, SMC/ICT concepts, and more) into a single “confidence score” engine. Every trade entry is filtered through customizable booster weights, so only the strongest opportunities trigger.
Built-In Alerts:
Get instant notifications on all entries, take-profits, trailing stop events, and exits. Connect alerts to your mobile, email, or webhook for seamless automation or just peace of mind.
Advanced Position Management:
Supports up to 5 separate take-profit levels with adjustable quantities, plus dynamic and stepwise trailing stops. Protects your gains and adapts exit logic to market movement, not just static targets.
Anti-Chop/No Trade Zones:
Eliminate low-probability, sideways market conditions using the “No Chop Zone” filter, so you only trade in meaningful, trending environments.
Full Market Session Control:
Restrict trades to custom sessions (e.g., New York hours) for added discipline and to avoid overnight risk.
— Ideal for day traders and prop-firm requirements.
Multi-Asset & Timeframe Support:
Whether you trade micro futures, stocks, forex, or crypto, NOMA adapts its TP/SL logic to ticks, pips, or points and works on any timeframe.
How NOMA Works (Feature Breakdown)
1. Adaptive Trend Engine
Uses a custom NOMA line that blends classic moving averages with dynamic momentum and a proprietary “Confidence Momentum Oscillator” overlay.
Visual trend overlay and color fill for easy chart reading.
2. Multi-Factor Confidence Scoring
Each trade is scored on up to 11 confidence “boosters,” including:
Market Manipulation & Accumulation (detects smart money traps and true range expansions)
Accumulation/Distribution (AD line)
ATR Volatility Rank (prioritizes trades when volatility is “just right”)
COG Cross (center of gravity reversal points)
Change of Character/Break of Structure (CHoCH/BOS logic, SMC/ICT style)
Order Blocks, Breakers, FVGs, Inducements, OTE (Optimal Trade Entry) Zones
You control the minimum score required for a trade to trigger, plus the weight of each factor (customize for your asset or style).
3. Smart Trade Management
Step Take-Profits:
Up to 5 profit targets, each with individual contract/quantity splits.
Step Trailing Stop:
Trail your stop with a ratcheting logic that tightens after each TP is hit, or use a fully dynamic ATR-based trail for volatile markets.
Kill-Switch:
Instant trailing stop logic closes all open contracts if price reverses sharply.
4. Session Filter & Cooldown Logic
Restricts trading to key sessions (e.g., NY open) to avoid low-liquidity or dead zones.
Cooldown bars prevent “overtrading” or rapid re-entries after an exit.
5. Chop Zone Filter
Optionally blocks trades during flat/choppy periods using a custom “NOMA spread” calculation.
When enabled, background color highlights no-trade periods for clarity.
6. Real-Time Alerts
Receive alerts for:
Trade entries (long & short, with confidence score)
Every take-profit target hit
Trailing stop exits or full position closes
Easy setup: Create alerts for all conditions and get notified instantly.
Customization & Inputs
TP/SL Modes: Choose between manual, ATR-multiplied, or hybrid take-profit and trailing logic.
Position Sizing: Fixed contracts/quantity per trade, with customizable splits for scaling out.
Session Settings: Restrict to any time window.
Confidence Engine: User-controlled weights and minimum score—tailor for your asset.
Risk & Volatility Filters: ATR length/multiplier, min/max range, and more.
How To Use
Add NOMA to your chart.
Customize your settings (session, TPs, confidence scores, etc.).
Set up TradingView alerts (“Any Alert() function call”) to receive notifications.
Monitor trade entries, profit targets, and stops directly on your chart or in your inbox.
Adjust confidence weights as you optimize for your favorite asset.
Pro Tips
Start with default settings—they are optimized for NQ micro futures, 15m timeframe.
Increase the minimum confidence score or weights for stricter filtering in volatile or low-liquidity markets.
Adjust your take-profit and trailing stop settings to match your trading style (scalping vs. swing).
Enable “No Chop Zone” during sideways conditions for cleaner signals.
Test in strategy mode before trading live to dial in your risk and settings.
Disclaimer
This script is for educational and research purposes only. No trading system guarantees future results.
Performance will vary by symbol, timeframe, and market regime—always test settings and use at your own risk. Not investment advice.
If alerts or strategy entries are not triggering as expected, try lowering the minimum confidence score or disabling certain boosters.
This will come with a user manual please do not hesitate to message me to gain access. TO THE MOON AND BEYOND

ICT Smart Money Trading Suite [SwissAlgo]ICT/Smart Money Trading Suite - Technical Analysis Indicator
----------------------------------------------------------
OVERVIEW
The ICT/Smart Money Trading Suite is a technical analysis indicator that implements concepts from Inner Circle Trader (ICT) methodology and Smart Money Concepts (SMC).
ICT methodology was developed by Michael J. Huddleston (ICT) and focuses on understanding Institutional market behavior.
Smart Money Concepts builds upon these ideas to analyze how large Financial Institutions and/or Market Makers seem to operate in the markets.
This indicator combines multiple analytical tools into a single package for market structure analysis, imbalance detection, and the observation of institutional order flow.
----------------------------------------------------------
CORE COMPONENTS
Market Structure Analysis:
- External Structure : Major swing highs and lows that define broader price movement (these are the most significant structural points that institutions reference for their positioning and typically require substantial volume and momentum to break)
- Internal Structure : Shorter-term pivots showing micro-trend developments within the External Structure (these internal pivot highs and lows often represent areas where retail traders may be positioned on the wrong side of the market as they frequently form just before major structural breaks or trend continuations, creating liquidity that institutions can utilize)
- Structural Breakout Detection : Identification of structure breaks and potential trend changes ( 'Change of Character' which occurs when the External Structure shifts from bullish to bearish bias or vice-versa indicating a potential major trend reversal, and 'Break of Structure' which happens when price decisively takes out previous significant highs in a bearish trend or previous significant lows in a bullish trend confirming trend continuation or acceleration)
- EMA Cloud : Dynamic support and resistance zones with trend context (additional reference point)
Imbalance Zone Detection:
Fair Value Gaps (FVGs):
Price inefficiencies that occur between candles when sudden price moves create gaps in price delivery
Typically formed when the low of a bullish candle is higher than the high of the candle two periods prior, or when the high of a bearish candle is lower than the low of the candle two periods prior
These gaps represent areas where price moved too quickly without adequate two-way auction process
Institutions may return to fill these inefficiencies at a later time for proper price discovery
The theory suggests that all price ranges should eventually be traded through to complete the auction process
Gaps are automatically removed from the chart when price fully retraces back through the inefficient area
Order Blocks (OBs):
Specific candles that occur immediately before significant market moves and represent institutional decision points
Identified as the last opposing candle before a strong directional move (final bearish candle before major bullish move or final bullish candle before major bearish move)
These candles contain the orders and liquidity that institutions used as a foundation for their market manipulation
Represent areas where large institutional players positioned themselves to move the market significantly
Price may return to these levels to collect additional liquidity or test institutional resolve
The candle's full range (high to low) is considered the active zone where institutional interest may remain
Vector Candle Recovery:
Zones created by high-activity candles that demonstrate unusually large range and volume characteristics
These candles are interpreted as manipulative price pushes designed to hunt liquidity and trigger stop losses
Often used by institutions to induce retail traders into poor positions before reversing direction
Recovery zones represent the full range of these vector candles where price may retrace
The concept assumes that extreme moves often get partially retraced as the market corrects from artificial price displacement
Zones are invalidated when a significant portion of the vector candle range is retraced (typically 50% or more)
Support & Resistance:
Key price zones based on historical price reactions and pivot clustering analysis
Calculated through algorithmic identification of areas where price has repeatedly found buyers (support) or sellers (resistance)
Strength is determined by the number of times price has reacted from these levels and the volume of activity at these zones
Represent psychological and algorithmic reference points where institutional systems are likely to place orders
Create areas of increased probability for price reactions due to concentration of pending orders and decision-making activity
Zones are color-coded based on current price position: green for support (price above), red for resistance (price below), yellow for neutral (price within)
Liquidity Analysis:
- Liquidity Pools : Areas above or below key levels where stop orders may cluster
- Kill Zones : Time-based periods associated with increased market activity
- Daily/Weekly/Monthly Price Levels : Key institutional reference points (price highs/lows)
Vector Candles/Price Manipulation:
Advanced algorithm identifying statistically significant candles using volume delta analysis, range statistics, and persistence scoring.
----------------------------------------------------------
VISUAL INTERPRETATION - DETAILED GUIDE
MARKET STRUCTURE
External Structure (Thick Lines):
- Green thick lines: Major support levels (external lows) that define bullish structure
- Red thick lines: Major resistance levels (external highs) that define bearish structure
- These lines represent significant swing points that institutions may reference
- Lines extend from the swing point and update as the structure evolves
Internal Structure (Thin Lines):
- Green thin lines: Minor support levels showing internal market structure
- Red thin lines: Minor resistance levels showing internal market structure
- More frequent updates than external structure, showing micro-trend changes
Structure Markers:
- Small triangles with "H": External pivot highs (major resistance points)
- Small triangles with "L": External pivot lows (major support points)
- Small dots: Internal pivot points (minor structure without text)
- Markers appear with a 20-bar delay to confirm pivot validity
HIGHS/LOWS LEVELS
Daily Levels (Green Dashed Lines):
- Horizontal dashed lines marking the previous day's high and low
- Updates at the start of each new trading day
- Gradient effect shows historical importance (newer = more opaque)
- Acts as institutional reference points for intraday trading
Weekly Levels (White Dashed Lines):
- Horizontal dashed lines marking the previous week's high and low
- Updates at the start of each new trading week
- Typically more significant than daily levels for swing trading
- Often respected by institutional algorithms
Monthly Levels (Orange Dashed Lines):
- Horizontal dashed lines marking the previous month's high and low
- Updates at the start of each new trading month
- Highest significance levels for long-term institutional positioning
- Major psychological and algorithmic reference points
VECTOR CANDLES
Candle Body Coloring System:
- Lime Green Bodies: Ultra-bullish vector candles (Z-score ≥ 3.0)
- Blue Bodies: Abnormal bullish vector candles (Z-score 2.0-2.99)
- Bright Red Bodies: Ultra-bearish vector candles (Z-score ≥ 3.0)
- Purple Bodies: Abnormal bearish vector candles (Z-score 2.0-2.99)
- Faded Green/Red: Normal market activity candles
Vector Identification Criteria:
- Statistical significance based on range and volume delta
- Persistence scoring (how much directional pressure remained)
- ATR-based absolute detection (candles >2x ATR automatically qualify)
- These candles often precede significant market moves or reversals
EMA CLOUD
Purple Cloud Visualization:
- Central line: 50-period EMA (blue line)
- Upper boundary: EMA + dynamic standard deviation band
- Lower boundary: EMA - dynamic standard deviation band
- Cloud fill: Purple semi-transparent area between boundaries
Interpretation:
- Price above cloud: Bullish bias context
- Price below cloud: Bearish bias context
- Price within cloud: Neutral/transitional zone
- Cloud thickness adapts to market volatility automatically
KILL ZONES
Background Highlighting:
- Yellow background tint during active kill zone periods
- London Session: 08:00-11:00 (UTC+1 time)
- NY Open: 13:00-16:00 (UTC+1 time)
- NY Close: 19:00-21:00 (UTC+1 time)
- Times automatically adjust to the chart timezone
Purpose:
- Highlights periods of typically increased institutional activity
- Times when liquidity hunting and manipulation often occur
- Periods when significant directional moves frequently begin
IMBALANCE ZONES - DETAILED BREAKDOWN
Fair Value Gaps (FVGs):
- Green boxes: Bullish FVGs (gap between bear candle high and bull candle low)
- Red boxes: Bearish FVGs (gap between bull candle high and bear candle low)
- Gray dotted lines: Midpoint of each gap (50% retracement level)
- Text label: "Fair Value Gap" in top-right corner
- Auto-removal: Boxes disappear when the price fills the gap
Order Blocks (OBs):
- Green boxes: Bullish order blocks (demand zones from the last bear candle before bullish vector)
- Red boxes: Bearish order blocks (supply zones from the last bull candle before the bearish vector)
- Gray dotted lines: Midpoint of each order block
- Text label: "OB" in top-right corner
- Invalidation: Boxes removed when price breaks below (bull OB) or above (bear OB)
Vector Candles Recovery Zones:
- Green boxes: Recovery zones after bullish vector candles
- Red boxes: Recovery zones after bearish vector candles
- Gray dotted lines: Midpoint of the vector candle range
- Text label: "Vector Recovery" on the right side
- These mark the full range of significant vector candles where retracements may occur
Support & Resistance Zones:
- Green boxes: Support zones (price currently above the zone)
- Red boxes: Resistance zones (price currently below the zone)
- Yellow boxes: Neutral zones (price within the zone)
- Text labels: "Support", "Resistance", or "Support/Resistance"
- Based on historical pivot clustering and strength analysis
Liquidity Pools:
- Green boxes: Bullish liquidity pools (below recent lows where buy stops cluster)
- Red boxes: Bearish liquidity pools (above recent highs where sell stops cluster)
- Gray dotted lines: Key liquidity level within the pool
- Text label: "Liquidity Pool" on the right side
- Zones where institutional players may hunt stop losses before reversing
----------------------------------------------------------
CALCULATION METHODOLOGY
Vector Candle Algorithm:
- Statistical Analysis using 48-bar lookback period
- Z-score thresholds: 2.0 (abnormal), 3.0 (ultra)
- ATR-based significance filtering
- Volume Delta Integration with lower timeframe analysis
- Persistence scoring based on directional pressure sustainability
- Combined scoring system (delta + range)
- Absolute Vector Detection for candles exceeding 2x ATR
Market Structure Parameters:
- Swing Size: 20-period pivot detection
- Breakout Threshold: 3 consecutive breaks for structure confirmation
- EMA Length: 50-period with dynamic cloud sizing
Fair Value Gap Detection:
- Auto Threshold: Dynamic gap sizing based on asset volatility
- Manual Threshold: User-defined minimum gap percentage
- Mitigation Logic: Automatic removal when price fills gaps
----------------------------------------------------------
TARGET USERS
This indicator is designed for traders who:
- Study Inner Circle Trader concepts
- Apply Smart Money Concepts in their analysis
- Focus on market structure and institutional behavior
- Seek confluence-based trading approaches
- Use higher timeframe bias for decision making
Experience Level: Intermediate to Advanced
Requires understanding of market structure concepts and institutional trading theory.
Recommended Timeframes:
- Analysis: 4H, Daily for market structure context
- Execution: 1H, 15min for entry timing
- Lower timeframes: With higher timeframe alignment
----------------------------------------------------------
CUSTOMIZATION OPTIONS
Display Controls:
- Master toggle for all imbalance zones
- Individual controls for each concept type
- Market structure line visibility
- Kill zone highlighting
- EMA cloud display
Visual Settings:
- Automatic light/dark mode color adaptation
- Adjustable zone transparency levels
- Extension distance controls
- Descriptive text labels
Technical Parameters:
- Vector candle sensitivity thresholds
- Historical analysis lookback periods
- Maximum zone display limits
- Zone invalidation conditions
----------------------------------------------------------
EDUCATIONAL BACKGROUND
Inner Circle Trader (ICT): A trading methodology developed by Michael J. Huddleston that focuses on understanding how institutional traders and market makers operate. The approach emphasizes market structure, liquidity concepts, and timing based on institutional behavior patterns.
Smart Money Concepts (SMC): An evolution of ICT principles that analyzes how large financial institutions move markets. These concepts include order blocks, fair value gaps, liquidity hunting, and market structure shifts.
Both methodologies are based on the premise that understanding institutional trading behavior can provide insights into market direction and timing.
----------------------------------------------------------
IMPORTANT DISCLAIMERS
This indicator is provided for educational and analytical purposes only. It is not financial advice and does not guarantee trading results.
Trading involves substantial risk of loss. Past performance does not indicate future results. Users should thoroughly understand the underlying concepts before applying them to live trading.
The effectiveness of these analytical methods may vary across different market conditions, timeframes, and instruments. Proper risk management and additional analysis are essential.
This indicator is a tool for market analysis, not a complete trading system. Success requires understanding of market principles, risk management, and continuous learning.
Always test analytical approaches thoroughly using historical data and demo accounts before implementing with real capital.

Time Range Marker By BCB ElevateThe Time Range Marker is a simple yet powerful visual tool for traders who want to focus on specific time intervals within the trading day. This indicator highlights a custom time range on your chart using a background color, helping you visually isolate key trading sessions or event windows such as:
Market open/close hours
News release periods
High-volatility trading zones
Personal strategy testing windows
⚙️ Key Features:
Customizable start and end time (hour & minute)
Works across all intraday timeframes
Adjustable highlight color to match your chart theme
Built using Pine Script v5 for speed and flexibility
🔧 Settings:
Start Hour / Minute – Set the beginning of the time range (in 24-hour format)
End Hour / Minute – Define when the range ends
Highlight Color – Choose the background color for better visibility
🕒 Timezone Note:
The indicator uses UTC time by default to ensure accuracy across markets. If your broker uses a different timezone (like EST, IST, etc.), the script can be adjusted to reflect your local market hours.
✅ How to Use the Time Range Marker Indicator
This indicator is used to visually highlight a specific time window each trading day, such as:
Market open or close sessions (e.g., NYSE, London, Tokyo)
High-impact news release periods
Custom time slots for strategy testing or scalping
🛠️ Installation Steps
Open TradingView and go to any chart.
Click on Pine Editor at the bottom of the screen.
Copy and paste the full Pine Script (shared above) into the editor.
Click the “Add to Chart” ▶️ button.
The indicator will appear on the chart with a highlighted background during the time range you set.
⚙️ How to Customize the Time Range
After adding the indicator:
Click the gear icon ⚙️ next to the indicator’s name on the chart.
Adjust the following settings:
Start Hour / Start Minute: The beginning of your time range (in 24-hour format).
End Hour / End Minute: When the highlight should stop.
Highlight Color: Pick a color and transparency for visual clarity.
Click OK to apply changes.
🕒 Timezone Consideration
By default, the indicator uses UTC (Coordinated Universal Time).
To match your broker’s timezone (e.g., EST, IST, etc.), you'll need to adjust the script by changing:
sessStart = timestamp("Etc/UTC", ...)
sessEnd = timestamp("Etc/UTC", ...)
to your correct timezone, like "Asia/Kolkata" for IST or "America/New_York" for EST.
Let me know your broker or local timezone, and I’ll update it for you.
📈 Tips for Traders
Combine this with volume, price action, or breakout indicators to focus your strategy on high-probability time windows.
Use multiple versions of this script if you want to highlight more than one time range in a day.

SMT Divergences V2 [OutOfOptions]Smart Money Technique (SMT) Divergence is designed to identify discrepancies between correlated assets within the same timeframe. It occurs when two related assets exhibit opposing signals, such as one forming a higher low while the other forms a lower low. This technique is particularly useful for anticipating market shifts or reversals before they become evident through other Premium Discount (PD) Arrays.
This indicator works by identifying the highs and lows that have formed for an asset on the current chart and the correlated symbol defined in the settings. Once a pivot on either asset is formed, it checks if the pivot has taken liquidity as identified by the previous pivot in the same direction (i.e., a new high taking out a previous high). If this is the case and the corresponding asset has not taken a similar pivot, the condition is determined to be a potential valid divergence. The indicator will then filter out SMTs formed by adjacent candles, requiring at least one candle difference between the candles forming the SMT.
If the “Candle Direction Validation” setting is enabled, the indicator will further check both assets to ensure that for bullish SMTs, the last high on both assets was formed by down candle, and for bearish SMTs, the low was formed by an up candle. This check can often eliminate low-probability SMTs that are frequently broken.
The referenced chart shows divergence between Nasdaq (NQ) and S&P 500 (ES) futures, which are normally closely correlated assets that move in the same direction. The lines shown represent bullish and bearish divergences between the two when they are formed. As you can see from the chart, SMT Divergences may not always indicate a reversal, or a reversal might be just a short-term retrace. Therefore, SMT Divergences should not be used independently. However, in conjunction with other PD arrays, they can provide strong confirmation of a change in market direction.
Configurability:
Pivot strength - Indicates how many bars to the left/right of a high for pivot to be considered, recommended to keep at 1 for maximum detection speed
Candle Direction Validation - Additional SMT validation to filter out weak/low-probability SMTs be examining candle direction
Remove Broken SMTs - Keeps the chart clean by removing broken (invalidate) SMTs from the chart, once price moves beyond the outmost edge of the SMT
Work in Realtime - Enabled real-time mode for even faster detection of SMTs
Line Styling for Bullish/Bearish SMTs - Ability to customize line style, color & width for bullish/bearish SMTs
Label Control - Whether or not to show SMT label and if shown what font size & color should be used and if labels should include a tooltip containing information about the SMT
What makes this indicator different:
When used on NQ/ES it will automatically detect the matching the corresponding ticker, i.e. if you have chart on NQU2025 it'll automatically match to ESU2025 and vice-versa. Works for mini/micro/continuous contract
Unlike other SMT indicators, this indicator has an option to remove broken (no longer valid SMTs)
Allows real-time detection of SMTs prior to the pivot being fully formed
Allows validation of SMTs to only display high-probability SMTs, that are more likely to signal a possible reversal
Includes alerting capability for both SMT creation and when the SMT is broken (invalidated)

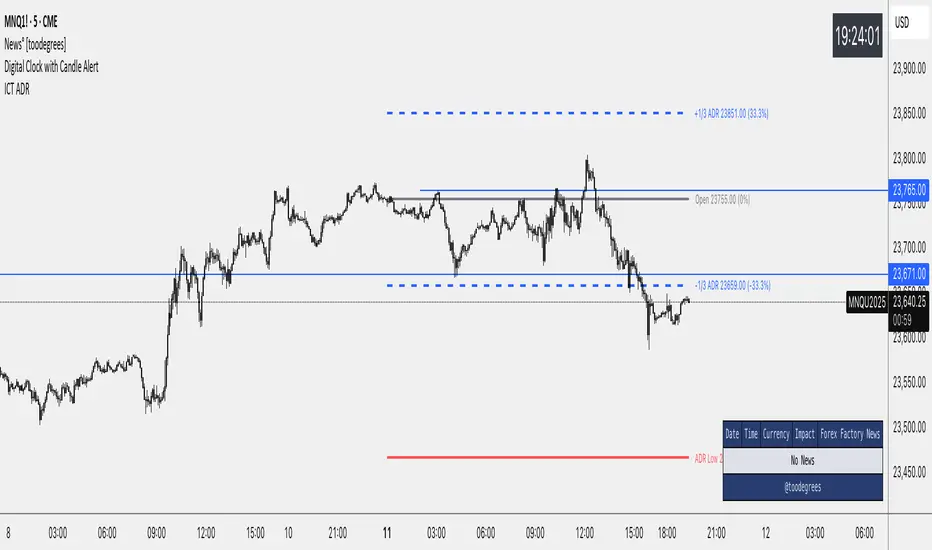
ICT Average Daily Range (ADR)📊 ICT Average Daily Range (ADR) Indicator
This indicator implements the Average Daily Range (ADR) concept taught by ICT (Inner Circle Trader). It calculates the average range of previous trading days and projects key levels for the current session, helping traders identify high-probability targets and reversal zones.
━━━━━━━━━━━━━━━━━━━━━━━━━━━━━━━━━━━━━━━━
✨ KEY FEATURES
- Accurate ADR Calculation - Uses only completed trading sessions (excludes current incomplete day)
- ICT Judas Swing Levels - Highlights the critical 1/3 ADR levels where institutional manipulation often occurs
- Two Calculation Modes - New York Midnight (ICT recommended) or Classic Daily
- Customizable Fractional Levels - 1/3, 2/3, 25%, 50%, 75% of ADR
- Smart Labels - Display price levels and percentage from open
- Flexible Visual Style - Separate line styles for different level groups
- Session Dividers - Optional vertical lines at session start
━━━━━━━━━━━━━━━━━━━━━━━━━━━━━━━━━━━━━━━━
📅 WEEKEND SESSION HANDLING
How Forex Sessions Work:
- Monday-Thursday: Full 24-hour sessions
- Friday: Partial session (00:00 to ~17:00 NY time)
- Sunday: Partial session (~17:00 NY to Monday 00:00)
- Saturday: No trading
Impact on ADR:
Both Friday and Sunday are partial sessions which can lower your ADR average. For example: Mon-Thu average 100 pips, Fri 70 pips, Sun 30 pips = 5-day ADR of 80 pips.
Other Markets:
- Crypto: 24/7 trading, no partial days
- Futures/Stocks: No Sunday session
━━━━━━━━━━━━━━━━━━━━━━━━━━━━━━━━━━━━━━━━
🎓 ICT CONCEPTS
Average Daily Range (ADR)
Statistical measure of average price movement per day. Acts as a "magnet" for price - markets tend to fulfill their ADR.
1/3 ADR Levels - "Judas Swing"
ICT's signature concept for identifying manipulation zones. Price often sweeps these levels to trap retail traders before reversing. High-probability reversal areas during London/NY sessions.
━━━━━━━━━━━━━━━━━━━━━━━━━━━━━━━━━━━━━━━━
⚙️ SETTINGS GUIDE
ADR Period: Number of days for calculation (default 5)
- Lower values = More responsive
- Higher values = Smoother levels
Calculation Mode:
- New York Midnight - ICT standard, best for Forex
- Classic Daily - Exchange timezone
Level Display:
- ADR High/Low - Primary targets
- 1/3 Levels - Judas Swing zones
- 2/3 Levels - Trending day targets
- Quarter Levels - 25% and 75%
- 50% Level - Mid-range
Visual Options:
- Separate line styles for each level group
- Customizable colors and width
- Optional labels with price/percentage
━━━━━━━━━━━━━━━━━━━━━━━━━━━━━━━━━━━━━━━━
💡 TRADING TIPS
1. Early Session: If price moves to 1/3 ADR quickly, watch for Judas Swing reversal
2. Mid Session: Use 2/3 levels as continuation targets in trending markets
3. Late Session: ADR completion often marks session extremes
4. Risk Management: Use fractional levels for scaling positions
5. Confluence: Combine with Fair Value Gaps, Order Blocks, and Liquidity Pools
Best Timeframes: 15m, 30m, 1H, 4H for intraday trading
━━━━━━━━━━━━━━━━━━━━━━━━━━━━━━━━━━━━━━━━
📝 NOTES
- Based on concepts taught by ICT (Inner Circle Trader)
- Requires at least 5 completed sessions for full accuracy
- ICT suggested using "New York Midnight" mode
- Weekend sessions handled based on actual market hours
- Be aware that Friday/Sunday partial sessions may lower ADR average
Created with focus on clean implementation and ICT's core teachings.
[TehThomas] - ICT Rejection BlocksWhat Are Rejection Blocks?
Rejection Blocks are price zones formed when a candle attempts to push through a level, gets rejected with force, and then closes in the opposite direction. This price action creates a “block” that reflects clear intent from smart money participants. These blocks are typically marked by a large wick that fails to close beyond a key high or low, followed by a body that closes back inside the previous range. The zone around the candle body becomes a footprint of where buyers or sellers aggressively stepped in, often defending that level with size.
Why Rejection Blocks Matter to Smart Money Traders
In any smart money model, understanding where large players are active is key. Rejection Blocks highlight exactly that. These zones often sit just above inducement highs or below engineered lows, where liquidity was taken before displacement occurred. By identifying where price got rejected with conviction, traders can spot the origin of institutional interest. These levels often act as magnets for retracement and can provide high-probability entries when price trades back into them. The best part is they often line up with other SMT elements like Fair Value Gaps, Breaker Blocks, or market structure shifts, allowing for strong confluence-based setups.
How the Indicator Works and Why It’s Effective
This script is designed to do one thing exceptionally well, automatically detect and display clean, high-quality rejection blocks. It filters out noise and only marks candles that meet strict rejection criteria. That means long wicks showing failed pushes, and bodies that close convincingly in the opposite direction. The indicator then draws a box over the candle body to mark the rejection zone. These boxes help map out areas where price is likely to react or stall in the future. By automating this process, the indicator saves time, improves consistency, and removes guesswork. You no longer have to manually scan charts or second-guess if a level is valid, the tool handles it for you.
What This Adds to Your Trading Workflow
This tool fits perfectly into any smart money strategy built around liquidity, displacement, and market structure. It helps you focus on the most meaningful zones, especially when price sweeps a high or low and leaves behind a reversal. Whether you trade breakouts, reversals, or liquidity setups, Rejection Blocks give you a visual confirmation of where price got turned away. They act as future entry zones, rejection points, or even stop placement areas. You can pair them with your Fair Value Gap entries, or use them to validate the direction of a shift in structure. This is the type of tool that simplifies your chart without losing precision.
Optimized for Focus and Clarity
There’s no clutter, no overload of options, and no distractions. Just clean, focused rejection zones that update in real-time. The boxes stay until invalidated, giving you a static map of relevant zones without recalculating on every bar. This makes it ideal for traders who want to plan entries, set alerts, or manage risk without redrawing levels every session. Whether you scalp on the 5M or swing trade using the 4H, this tool helps lock in the zones where price already told you something important, rejection with force.
Conclusion
The Rejection Blocks indicator is for traders who want cleaner charts, smarter levels, and more conviction behind every entry. It isolates zones where price showed clear rejection and turns them into actionable blocks that fit seamlessly into any smart money strategy. If you rely on liquidity sweeps, displacement, and reaction-based entries, this tool brings clarity and consistency to your edge. Just turn it on and let it show you where real rejection occurred.
Example of how to use it

Fib Swing Counter [A@J]Fib Swing Counter — Trade the Rhythm of the Market
This indicator automatically marks swing highs and lows with Fibonacci numbers (1, 1, 2, 3, 5, 8, 13, …), helping you track market structure, count price legs, and identify hidden order behind price movement.
Core Features:
Auto-detects pivots and labels them with the Fibonacci sequence.
Alternates between highs and lows — no repeats, no noise.
Custom reset time — start your count at the New York session open, a major news event, or your own strategic point.
Clean and simple visual display, adaptable to your chart style.
How Traders Use It:
Liquidity cycles: Spot when price is expanding or contracting in Fibonacci-driven waves.
Entry timing: Wait for setups to align with a key Fib count.
Confluence with other tools: Combine with ICT concepts, SMT divergence, supply/demand blocks, or Fibonacci retracements.
Session-based analysis: Restart the sequence everyMarket Open, Midnight, New York or London open to study price behavior from a fresh anchor point.
Whether you're into smart money concepts, price action, or algorithmic patterns, this tool adds a rhythmic layer to your analysis — because markets move with sequence, not randomness.

FVG 9:31–10:00 AM ETFVG 9:31–10:00 AM ET - Script Description
What This Script Does
This indicator finds **Fair Value Gaps (FVGs)** that form during the first 29 minutes of the U.S. stock market (9:31 AM to 10:00 AM Eastern Time). A Fair Value Gap is a price imbalance where there's a gap between candles that often becomes an important support or resistance level.
Key Features:
- **Time Window**: Only looks for FVGs between 9:31-10:00 AM ET (most important opening period)
- **One Per Day**: Finds only the first FVG that forms in this time window each day
- **Visual Display**: Draws a purple box around the gap with a clear "FVG" label
- **Price Tracking**: Monitors when price comes back to test the gap level
- **Alert System**: Sends notifications when price returns to the FVG zone
How FVGs Are Detected:
- **Bullish FVG**: When there's a gap up (low of middle candle is above high of 3rd candle back)
- **Bearish FVG**: When there's a gap down (high of middle candle is below low of 3rd candle back)
The 9:31-10:00 AM window is chosen because this is when institutions and algorithms create their biggest price moves right after market open, making these gaps very reliable.
Customization Options
User Settings
Extend FVG Box (Bars)
- **What it does**: Makes the purple box longer to the right
- **Default**: 0 (box ends right after the gap forms)
- **Options**: Any number from 0 to 100+
- **When to use**:
- Keep at 0 for clean historical view
- Set to 10-20 to track the gap during the current session
- Set higher for longer reference
Code Settings (Can Be Changed)
Time Window
- **Start**: 9:31 AM Eastern Time
- **End**: 10:00 AM Eastern Time
- **Can modify**: Change the hour/minute numbers in the code
Visual Style
- **Color**: Purple with see-through background
- **Label**: Shows "FVG" text in white
- **Can modify**: Change colors and transparency in the code
How to Use:
Setup
Chart Settings
1. Use 1-minute, 5-minute, or 15-minute charts (works best on these timeframes)
2. Apply to liquid markets like ES, NQ, major stocks, or forex pairs
3. Set the "Extend FVG Box" to your preference (start with 0 or 10)
What You'll See
- A purple box appears when an FVG forms during 9:31-10:00 AM
- Box shows the exact price levels of the gap
- "FVG" label appears on the box
- Only one FVG per day will be marked
Trading Strategies
Basic FVG Trading
1. **Wait for Formation**: Let the purple box appear during 9:31-10:00 AM
2. **Watch Price Movement**: See if price moves away from the gap
3. **Enter on Retest**: When price comes back to the purple box area, consider entering
4. **Trade Direction**:
- Bullish FVG = look for long opportunities when price retests
- Bearish FVG = look for short opportunities when price retests
Entry Methods
- **Bounce Play**: Enter when price touches the FVG box and bounces away
- **Break Play**: Enter if price strongly breaks through the FVG box
- **Rejection Play**: Enter opposite direction if price gets rejected at the FVG
Risk Management
Stop Losses
- Place stops just outside the FVG box (a few ticks beyond the gap)
- If trading a bounce, stop goes on opposite side of the gap
- If trading a break, stop goes back inside the gap
Position Sizing
- Start small until you understand how FVGs work in your market
- Bigger gaps = smaller position size (more risk)
- Smaller gaps = can use larger position size
Profit Targets
- Take profits at obvious levels like round numbers, previous highs/lows
- Consider taking half profits at 1:1 risk/reward ratio
- Let some position run if the move is strong
Best Practices
When It Works Best
- High-volume stocks and futures (ES, NQ work great)
- Normal market days without major news during the 9:31-10:00 window
- When there's clear institutional activity in the opening period
When to Be Careful
- Low-volume stocks or markets
- Major economic news releases during the time window
- Market holidays when volume is low
- Very choppy or sideways days
Alert Usage
- The script will alert you when price comes back to test the FVG
- Don't trade the alert blindly - always check the current market situation
- Use the alert as a heads-up to start watching the setup more closely
Tips for Success
- The earlier the FVG forms in the 9:31-10:00 window, often the more significant it is
- FVGs that form with high volume are usually more reliable
- Always consider the overall market direction - don't fight the main trend
- Practice on paper first to understand how FVGs behave in your chosen market
🔗 Works Best With:
✅ Liquidity Levels — Smart Swing Lows: Spot key structural lows that can fuel stop hunts and reversals.
✅ ICT Turtle Soup — Liquidity Reversal: Add a classic reversal pattern to your toolkit to catch fakeouts cleanly.
✅ ICT SMC Liquidity Grabs and OBs- Liquidity Grabs, Order Block Zones, and Fibonacci OTE Levels, allowing traders to identify institutional entry models with clean, rule-based visual signals.
This script is most valuable for day traders who want to catch institutional moves right after market open, but it can also help swing traders identify important intraday levels.
✅ ICT Macro Zones (Grey Box Version)- It tracks real-time highs and lows for each Silver Bullet session.
✅ Weekly Opening Gap (cryptonnnite)

Midnight 30min High/LowMidnight 30min High/Low — Overnight Liquidity Range Tracker
Capture the Overnight Session: A Strategic Level Identification Tool from Professional Trading Methodology
This indicator captures the high and low prices during the critical 30-minute midnight session (12:00-12:30 AM EST) and projects these levels forward as key support and resistance zones. These overnight ranges often contain significant liquidity and serve as crucial reference points for intraday price action, representing areas where institutional activity may have established important levels.
🔍 What This Script Does:
Identifies Critical Overnight Session Levels
- Automatically detects the 12:00-12:30 AM EST session window
- Captures the highest and lowest prices during this 30-minute period
- Projects these levels forward for multiple trading days
Creates Dynamic Support/Resistance Zones
- Extends midnight high/low levels as horizontal lines with customizable projection periods
- Fills the area between high and low to create a visual trading range
- Updates automatically each trading day with new overnight levels
Provides Clear Visual Reference Points
- Optional session start markers (●) highlight when the midnight session begins
- Color-coded lines distinguish between high and low levels
- Transparent fill area creates an easy-to-identify trading zone
Real-Time Level Tracking
- Updates levels in real-time during the active midnight session
- Maintains historical levels for reference and backtesting
- Compatible with data window for precise level values
⚙️ Customization Options:
Extend Days (1-30):** Control how many days forward the levels are projected (default: 5 days)
High Line Color:** Customize the midnight high line color (default: blue)
Low Line Color:** Customize the midnight low line color (default: orange)
Fill Color:** Adjust the transparency and color of the range area (default: light aqua, 80% transparency)
Show Session Markers:** Toggle yellow session start indicators on/off (default: enabled)
💡 How to Use:
Deploy on lower timeframes (1m-15m) for precise level identification and reaction monitoring**
Watch for key price interactions:
- Rejection at midnight high levels (potential resistance)
- Bounce from midnight low levels (potential support)
- Range-bound trading between the high and low levels
Combine with liquidity concepts:
- Monitor for stop hunts above/below these levels
- Look for false breakouts that snap back into the range
- Use as confluence with other ICT concepts like FVGs and Order Blocks
Strategic Applications:
- Range trading between midnight levels
- Breakout confirmation when price closes decisively outside the range
- Support/resistance validation for entry and exit planning
🔗 Combine With These Tools for Complete Market Structure Analysis:
✅ First FVG — Opening Range Fair Value Gap Detector.
✅ ICT Turtle Soup (Liquidity Reversal)— Spot stop hunts and false breakout scenarios
✅ ICT Macro Zones (Grey Box Version)- It tracks real-time highs and lows for each Silver Bullet session
✅ ICT SMC Liquidity Grabs and OBs- Liquidity Grabs, Order Block Zones, and Fibonacci OTE Levels, allowing traders to identify institutional entry models with clean, rule-based visual signals.
Together, these tools create a comprehensive Smart Money Concepts (SMC) framework — helping traders identify, anticipate, and capitalize on institutional-level price movements with precision and confidence during critical overnight sessions.

CandelaCharts - HTF Sweeps📝 Overview
This indicator lets you overlay a higher timeframe (HTF) onto your current chart, giving you a clearer view of broader market movements without switching timeframes.
This indicator also detects liquidity sweeps and plots them on both the higher timeframe (HTF) and the current lower timeframe (LTF), helping traders clearly spot potential reversal points. It adds LTF dividers for better structure clarity, making it easier to align with HTF shifts and refine entry timing with greater precision.
📦 Features
This indicator identifies price sweeps and their invalidations, helping traders spot potential liquidity grabs and failed breakout attempts.
Overlay a configurable higher timeframe (HTF) on the current chart
Detects and plots liquidity sweeps on both HTF and LTF
Adds lower timeframe (LTF) dividers for improved structure clarity
Ideal for ICT-style top-down analysis and precision entries without switching charts
⚙️ Settings
Customize the indicator to suit your strategy. Alert options are also available, so you can stay informed when key market events are triggered.
Timeframes: Select the higher timeframe (HTF) to overlay on your current chart.
HTF Coloring: Customize the color scheme for HTF candles.
HTF Offset: Space of HTF Candles and current chart.
HTF Size: Adjust the size of HTF candles.
HTF Labels: Toggle labels for HTF.
LTF H/L Line: Show or hide high/low lines from the lower timeframe.
LTF O/C Line: Display open/close lines from the lower timeframe.
Sweep: Enable detection and plotting of liquidity sweeps.
I-sweep: Toggle invalidated sweep detection.
Alerts: Enable Sweep Formation or Invalidation alerts
⚡️ Showcase
See the indicator applied in live market scenarios, illustrating how sweep detections and invalidations unfold on various charts.
HTF Candles
HTF Sweeps
LTF Sweeps
Invalidated Sweeps
🚨 Alerts
This indicator includes built-in alert functionality to keep you informed of key market events in real time. It supports the following customizable alerts on TradingView:
Sweep Detection: Notifies you when a price sweep is detected—either a liquidity sweep above recent highs or below recent lows. This can be a strong signal of potential reversals or liquidity grabs by larger market participants.
Sweep Invalidation: Alerts you when a previously detected sweep becomes invalidated due to price action moving beyond a defined threshold. This helps traders stay adaptive and avoid acting on outdated signals.
These alerts are fully integrated with TradingView’s native alert system, so you can receive notifications via app, email, or pop-up—ensuring you're always up to date, even when you're away from the chart.
⚠️ Disclaimer
Trading involves significant risk, and many participants may incur losses. The content on this site is not intended as financial advice and should not be interpreted as such. Decisions to buy, sell, hold, or trade securities, commodities, or other financial instruments carry inherent risks and are best made with guidance from qualified financial professionals. Past performance is not indicative of future results.

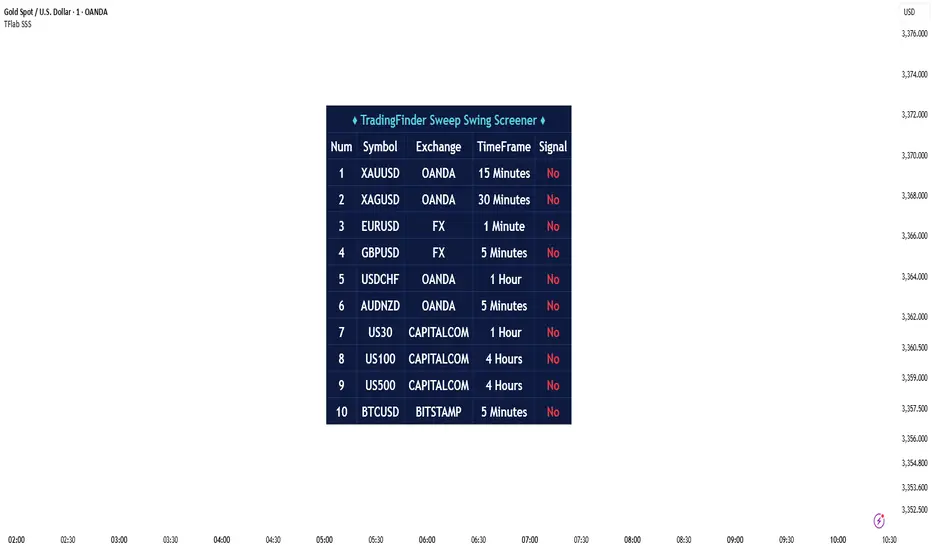
Sweep Swing Screener [TradingFinder]🔵 Introduction
Understanding how liquidity forms and how price reacts around key structural levels is essential for identifying precise, low-risk entry points. The Sweep Swing Screener is a specialized tool developed to continuously monitor market activity and detect liquidity sweeps, reaction zones, and valid confirmation candles across various trading instruments and timeframes.
This tool can be applied both to scan multiple symbols at once and to analyze all timeframes of a specific asset for potential reversal points. It begins by identifying a clear swing point, whether a swing high or a swing low, and then outlines a reaction zone between that level and either the highest or lowest value of the swing candle's open or close.
If the price revisits this zone, performs a liquidity grab, and prints an indecision candle like a doji or a narrow-bodied bar that closes within the zone, this may indicate a rejection of the level and the failure of a breakout attempt. At that moment, depending on the context, the screener may identify a bullish or bearish reversal and generate a corresponding Long or Short signal.
By emphasizing accurate entry timing, alignment with institutional order flow, and avoidance of common traps, this approach highlights market areas where liquidity engineering, reversal probability, and price inefficiency come together. As a result, the Sweep Swing Screener becomes a valuable part of any trader’s toolkit, particularly for those who rely on price action and liquidity logic to drive their decisions. It allows traders to focus on clean, actionable setups without getting lost in noise or misleading breakouts.
🔵 How to Use
The Sweep Swing Screener is designed to track market structure in real time and alert users when conditions for a potential reversal are present. Its methodology combines liquidity behavior with swing analysis and candle confirmation, all within predefined reaction zones.
To better understand this logic, consider a basic market flow where a swing high or low forms, followed by a return to that level. If the price sweeps the previous extreme and forms a confirming candle within the reaction zone, a signal is issued.
🟣 Long Signal
To identify a long setup, the screener looks for a valid swing low, often a level below which sell-side liquidity is likely to be clustered. Once found, it defines a reaction zone from the swing low to the lowest point between the candle’s open and close.
If the price returns to this area and creates a lower wick that extends beneath the swing low, the tool checks whether the price manages to close back inside the range, rejecting the breakdown. This indicates absorption of selling pressure and failure to sustain the move lower.
The screener then waits for a confirmation candle to appear. Typically, this is a doji or other small-bodied candle that closes inside the zone. If these conditions are met, the screener records a Long signal for that asset and, if enabled, sends a notification to alert the user.
🟣 Short Signal
For bearish setups, the screener begins by identifying a valid swing high, which usually marks a level where buy-side liquidity is concentrated. It then creates a reaction zone from the swing high to the highest point between the candle’s open and close.
When price returns to this level, sweeps above the swing high, and then fails to close higher, it may signal the presence of a bull trap and early exhaustion in the upward move.
A confirmation candle, usually a doji or a rejection bar that closes back within the zone, is then required. Once that occurs, the screener marks the asset with a Short signal and optionally sends a real-time alert to the user.
This type of setup helps highlight potential institutional sell zones, offering insight into where price is likely to reverse following a liquidity event.
🔵 Settings
🟣 Logical settings
Swing period : You can set the swing detection period.
Max Swing Back Method : It is in two modes "All" and "Custom". If it is in "All" mode, it will check all swings, and if it is in "Custom" mode, it will check the swings to the extent you determine.
Max Swing Back : You can set the number of swings that will go back for checking.
Maximum Distance Between Swing and Signal : The maximum number of candles allowed between the swing point and the potential signal. The default value is 50, ensuring that only recent and relevant price reactions are considered valid.
🟣 Display Settings
Table Size : Lets you adjust the table’s visual size with options such as: auto, tiny, small, normal, large, huge.
Table Position : Sets the screen location of the table. Choose from 9 possible positions, combining vertical (top, middle, bottom) and horizontal (left, center, right) alignments.
🟣 Symbol Settings
Each of the 10 symbol slots comes with a full set of customizable parameters :
Symbol : Define or select the asset (e.g., XAUUSD, BTCUSD, EURUSD, etc.).
Timeframe : Set your desired timeframe for each symbol (e.g., 15, 60, 240, 1D).
🟣 Alert Settings
Alert : Enables alerts for SSS.
Message Frequency : Determines the frequency of alerts. Options include 'All' (every function call), 'Once Per Bar' (first call within the bar), and 'Once Per Bar Close' (final script execution of the real-time bar). Default is 'Once per Bar'.
Show Alert Time by Time Zone : Configures the time zone for alert messages. Default is 'UTC'.
🔵 Conclusion
The Sweep Swing Screener provides a systematic method for identifying potential reversal zones by combining price structure, liquidity behavior, and candle-based confirmation. In markets that are often noisy and full of failed breakouts, focusing on these three elements helps clarify directional bias and supports more confident decision-making.
With the ability to scan multiple symbols and timeframes efficiently, this tool allows traders to stay focused on high-quality setups without the need to manually sift through dozens of charts. The inclusion of optional alerts further enhances its utility by offering timely updates when criteria are met.
By moving away from reactive strategies and toward structural anticipation, this screener supports traders who align their methods with institutional logic and the mechanics of smart money.
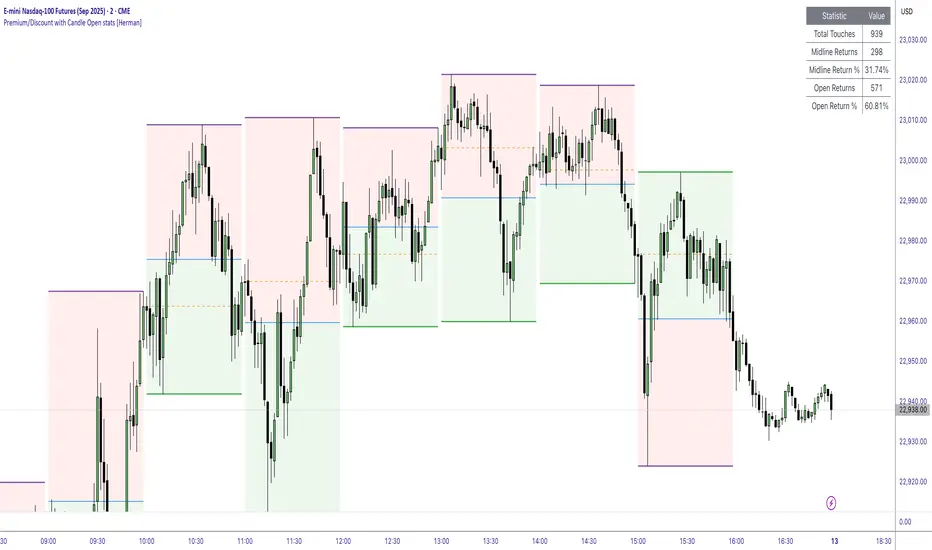
Premium/Discount with Candle Open stats [Herman]Premium/Discount with Stats
This indicator is designed to help traders identify and analyze premium/discount zones on any timeframe while automatically tracking statistics on price behavior relative to these zones. It is especially valuable for traders looking to structure entries, manage targets, and quantify market reactions to prior session ranges.
What it draws on the chart
✅ Range High and Low Lines
For each selected timeframe period (15min, 30min 1H, 4H, Daily), the indicator plots the high and low of the completed previous period.
These lines are color-coded dynamically based on sweep detection:
If the high was swept (price broke the previous high), the high line is marked as Premium.
If the low was swept, the low line is marked as Discount.
If both were swept or neither, it uses the default color settings.
✅ Midline
An optional midline at the 50% level of the previous period’s high-low range.
Helpful for mean-reversion traders or anyone watching for retests of equilibrium.
✅ Quartile Lines (25%–75%)
Optional additional lines at 25% and 75% of the previous range, helping traders visualize inner range subdivisions.
✅ Open Price Line
Marks the open price of the previous period as a horizontal reference.
✅ Background Fills
The region between low and midline is shaded with the Discount color.
The region between high and midline is shaded with the Premium color.
These optional fills help highlight the premium and discount zones visually.
✅ Current Incomplete Period Lines (optional)
You can choose to display provisional high, low, midline, quartiles, and open for the current forming period.
These update in real-time until the period closes.
Sweep Detection Logic
The indicator automatically tracks if the current period price sweeps above the previous period’s high or below the low.
A "sweep" is simply defined as price exceeding the previous high/low while tracking is active.
The sweep status affects the colors of the premium/discount lines, helping traders see potential liquidity grabs or stop hunts.
What it counts and tracks (Statistics)
The script automatically compiles statistics over time:
✅ Total Touches
Counts how many times the price in a new period touches either the previous period’s high or low.
A “touch” is registered once per side per period.
✅ Midline Returns
Counts how often, after touching the previous high/low, price returns to the previous period’s midline.
Gives you a measure of mean-reversion success.
✅ Open Returns
Similarly, tracks how often price returns to the previous period’s open after touching the previous high/low.
✅ Return Percentages
Displays the percentage of touches that result in a return to midline or open.
These percentages are calculated live on your chart and updated after each period closes.
✅ Stats Table
A customizable on-chart table summarizing all of these stats in real-time.
Helps traders evaluate the effectiveness of range-based trading setups over time.
How it Works (Technical details)
On each new bar, the script checks if a new period (as defined by your timeframe selection) has begun.
When a new period starts, the previous period’s high, low, open, midline, quartiles are recorded and drawn on the chart.
The script then “watches” the current period:
Updates provisional high and low.
Detects sweeps of previous highs/lows.
Tracks if price returns to the previous period’s midline or open after those sweeps.
Increments statistical counters if conditions are met.
Background fills and lines update dynamically based on real-time data.
Intended Use Cases
This indicator is ideal for:
✅ Identifying premium/discount zones for swing or intraday trades.
✅ Spotting liquidity sweeps and possible manipulation zones.
✅ Structuring trades with logical, data-driven target zones (midline, open).
✅ Quantifying the probability of mean-reversion moves after liquidity events.
✅ Developing and backtesting range-based trading models with live stats.
Highly Customizable
Choose any timeframe for defining the premium/discount range.
Toggle visibility of midline, quartiles, open line, current period preview.
Full control over colors, line styles, line widths, and background shading.
Optional real-time statistical table with total counts and return percentages.
Briese CoT Movement IndexThis Briese CoT (Commitments of Traders) Movement Index histogram indicator was built based on the formula by Stephen Briese in his book "The Commitments of Traders Bible":
"...difference between the COT Index and its reading of one or several weeks prior. I use six." —Chapter 7, page 75.
The code is a bit of a remix of the "ICT Commitment of Traders°" indicator by toodegrees and is meant for use in a new pane below a Weekly Chart .
The upper and lower thresholds are +40/-40. Some context: "A ± 40 point surge in the COT Index within a six-week period frequently marks the end of a counter-trend price reaction"
40 Point CoT Surge Rules (Commercials) from page 76
"During a correction from a prevailing uptrend, a +40 point movement in the CoT Index within a six-week period often marks the end of a corrective pullback, and the resumption of the major uptrend."
"During a reaction in a prevailing downtrend, a -40 point movement in the CoT Index within a six-week period frequently marks the end of a price reaction, and the resumption of the established downtrend."
"The failure of a ± point CoT Movement Index signal to restart the prevailing trend is a tip-off to a major trend change"
I'd recommend reading Briese's book for examples on how to properly interpret this indictor.
This indicator can be used in conjunction with another one I've published called the "Williams x Briese Hybrid CoT Index" which can be found on my scripts page.

Fair Value Gap Profiles [AlgoAlpha]🟠 OVERVIEW
This script draws and manages Fair Value Gap (FVG) zones by detecting unfilled gaps in price action and then augmenting them with intra-gap volume profiles from a lower timeframe. It is designed to help traders find potential areas where price may return to fill liquidity voids, and to provide extra detail about volume distribution inside each gap to assess strength and likely mitigation. The script automatically tracks each gap, updates its state over time, and can show which gaps are still unfilled or have been mitigated.
🟠 CONCEPTS
A Fair Value Gap is a zone between candles where no trades occurred, often seen as an inefficiency that price later revisits. The script checks each bar to see if a bullish (low above 2-bars-ago high) or bearish (high below 2-bars-ago low) gap has formed, and measures whether the gap’s size exceeds a threshold defined by a volatility-adjusted multiplier of past gap widths (to only detect significantly large gaps). Once a qualified gap is found, it gets recorded and visualized with a box that can stretch forward in time until filled. To add more context, a mini volume profile is built from a lower timeframe’s price and volume data, showing how volume is distributed inside the gap. The lowest-volume subzone is also highlighted using a sliding window scan method to visualise the true gap (area with least trading activity)
🟠 FEATURES
Visual gap boxes that appear automatically when bullish or bearish fair value gaps are detected on the chart.
Color-coded zones showing bullish gaps in one color and bearish gaps in another so you can easily see which side the gap favors.
Volume profile histograms plotted inside each gap using data from a lower timeframe, helping you see where volume concentrated inside the gap area.
Highlight of the lowest-volume subzone within each gap so you can spot areas price may target when filling the gap.
Dynamic extension of the gap boxes across the chart until price comes back and fills them, marking them as mitigated.
Customizable colors and transparency settings for gap boxes, profiles, and low-volume highlights to match your chart style.
Alerts that notify you when a new gap is created or when price fills an existing gap.
🟠 USAGE
This indicator helps you find and track unfilled price gaps that often act as magnets for price to revisit. You can use it to spot areas where liquidity may rest and plan entries or exits around these zones.
The colored gap boxes show you exactly where a fair value gap starts and ends, so you can anticipate potential pullbacks or continuations when price approaches them.
The intra-gap volume profile lets you gauge whether the gap was created on strong or thin participation, which can help judge how likely it is to be filled. The highlighted lowest-volume subzone shows where price might accelerate once inside the gap.
Traders often look for entries when price returns to a gap, aiming for a reaction or reversal in that area. You can also combine the mitigation alerts with your trade management to track when gaps have been closed and adjust your bias accordingly. Overall, the tool gives a clear visual reference for imbalance zones that can help structure trades around supply and demand dynamics.

Institutional Sessions Overlay (Asia/London/NY)Institutional Sessions Overlay is a professional TradingView indicator that visually highlights the main trading sessions (Asia, London, and New York) directly on your chart.
Customizable: Easily adjust session start and end times (including minutes) for each market.
Timezone Alignment: Shift session boxes using the timezone offset parameter so sessions match your chart’s timezone exactly.
Clear Visuals: Colored boxes and optional labels display session opens and closes for fast institutional market structure reference.
Toggle Labels: Show or hide session open/close labels with a single click for a clean or detailed look.
Intuitive UI: User-friendly grouped settings for efficient configuration.
This tool is designed for day traders, institutional traders, and anyone who wants to instantly recognize global session timing and ranges for SMC, ICT, and other session-based strategies.
How to use:
Set your chart to your local timezone.
Use the "Session timezone offset" setting if session boxes do not match actual session opens on your chart.
Adjust the hours and minutes for each session as needed.
Enable or disable labels in the “Display” settings group.
Tip: Use the overlay to spot session highs and lows, volatility windows, and institutional liquidity sweeps.

Logistic Regression ICT FVG🚀 OVERVIEW
Welcome to the Logistic Regression Fair Value Gap (FVG) System — a next-gen trading tool that blends precision gap detection with machine learning intelligence.
Unlike traditional FVG indicators, this one evolves with each bar of price action, scoring and filtering gaps based on real market behavior.
🔧 CORE FEATURES
✨ Smart Gap Detection
Automatically identifies bullish and bearish Fair Value Gaps using volatility-aware candle logic.
📊 Probability-Based Filtering
Uses logistic regression to assign each gap a confidence score (0 to 1), showing only high-probability setups.
🔁 Real-Time Retest Tracking
Continuously watches how price interacts with each gap to determine if it deserves respect.
📈 Multi-Factor Assessment
Evaluates RSI, MACD, and body size at gap formation to build a full context snapshot.
🧠 Self-Learning Engine
The logistic regression model updates on each bar using gradient descent, refining its predictions over time.
📢 Built-In Alerts
Get instant alerts when a gap forms, gets retested, or breaks.
🎨 Custom Display Options
Control the color of bullish/bearish zones, and toggle on/off probability labels for cleaner charts.
🚩 WHAT MAKES IT DIFFERENT
This isn’t just another box-drawing indicator.
While others mark every imbalance, this system thinks before it draws — using statistical modeling to filter out noise and prioritize high-impact zones.
By learning from how price behaves around gaps (not just how they form), it helps you trade only what matters — not what clutters.
⚙️ HOW IT WORKS
1️⃣ Detection
FVGs are identified using ATR-based thresholds and sharp wick imbalances.
2️⃣ Behavior Monitoring
Every gap is tracked — and if respected enough times, it becomes part of the elite training set.
3️⃣ Context Capture
Each new FVG logs RSI, MACD, and body size to provide a feature-rich context for prediction.
4️⃣ Prediction (Logistic Regression)
The model predicts how likely the gap is to be respected and assigns it a probability score.
5️⃣ Classification & Alerts
Gaps above the threshold are plotted with score labels, and alerts trigger for entry/respect/break.
⚙️ CONFIGURATION PANEL
🔧 System Inputs
• Max Retests – How many times a gap must be respected to train the model
• Prediction Threshold – Minimum score to show a gap on the chart
• Learning Rate – Controls how fast the model adapts (default: 0.009)
• Max FVG Lifetime – Expiration duration for unused gaps
• Show Historic Gaps – Show/hide expired or invalidated gaps
🎨 Visual Options
• Bullish/Bearish Colors – Set gap colors to fit your chart style
• Confidence Labels – Show probability scores next to FVGs
• Alert Toggles – Enable alerts for:
– New FVG detected
– FVG respected (entry)
– FVG invalidated (break)
💡 WHY LOGISTIC REGRESSION?
Traditional FVG tools rely on candle shapes.
This system relies on probability — by training on RSI, MACD, and price behavior, it predicts whether a gap will act as a true liquidity zone.
Logistic regression lets the system continuously adapt using new data, making it more accurate the longer it runs.
That means smarter signals, fewer false positives, and a clearer view of where real opportunities lie.

ICT Sensitive Key Levels [Mariinus]Indicator Overview – Inspired by ICT Concepts
This indicator is inspired by the teachings of Inner Circle Trader (ICT), whose philosophies and principles have greatly shaped the way I view price action. One of the most powerful lessons that stuck with me is his quote:
"All you need is OHLC."
Another fundamental concept that underpins this tool is the idea that:
"Price is constantly moving in cycles from Premium or Discount to Equilibrium, from Equilibrium to Discount to Premium."
With these core ideas in mind, this indicator was developed to help traders who are already using an ICT-based framework. In addition to plotting the standard OHLC levels, the ICT Sensitive Key Levels indicator also includes derived levels that provide deeper Market insight. These include the Equilibrium of the full candle range (High to Low) as well as the Equilibrium of the wicks – offering a more nuanced view of price balance and potential turning points, in line with ICT’s core concepts.
⚠️ Important Disclaimer:
This is not a standalone trading plan.
This is not a buy or sell signal generator.
Instead, this tool is designed to support traders who follow ICT principles by helping them identify higher-probability PD Arrays – the key zones where setups are more likely to occur. If your trading plan includes looking for specific PD Arrays and structural frameworks taught by ICT, then this indicator is a visual aid to refine and focus your attention on the areas where your framework has a higher probability of playing out.
🔁 Backtesting & Daily Preparation
In addition to improving your real-time analysis, this indicator is also a valuable tool for accelerated backtesting . Rather than manually drawing out levels, the indicator automatically provides them, allowing you to analyze past price action faster and more efficiently .
It’s also ideal for preparing your trading day . By loading the indicator before the session starts, you get a clear visual of key levels that may play a role in your strategy. And if you find the chart too cluttered with lines, simply copy the ones that matter to you, draw them manually, and then turn the indicator off to keep your chart clean while keeping your zones intact.
⚙️ Explanation of the Settings
You can combine up to 4 timeframes to monitor their respective levels while operating on a lower timeframe. For each timeframe, you can:
• Set a lookback period to control how far back you want to calculate levels.
• Choose to display or hide the levels of the current candle , which helps you monitor intra-candle ebbs and flows.
Each level (e.g., High, Low, Open, Close, Equilibrium) can be customized:
• Color
• Line style
• Line width
• To hide a level , simply set its opacity to zero.
You can also enable dividers to clearly mark the start and end of higher timeframe candles on your lower timeframe chart. These dividers are also fully customizable:
• Color
• Style
• Width
• And again, if you prefer a cleaner chart, you can set the opacity to zero to hide them completely.
This setup gives you full control over how much or how little visual data you want to see, aligning the tool with your personal trading workflow.
💡 Example Use Cases
These examples are for educational purposes only. This tool is not financial advice and should always be used in conjunction with your own trading plan—whether it involves Fair Value Gaps, Order Blocks, or a custom combination of ICT-based elements.
• Example 1: A 1H Bearish Fair Value Gap overlapping with the Equilibrium Key Level of the Previous Day's Range – a high-probability zone for reaction.
• Example 2: A 1H Bullish Fair Value Gap in Discount, overlapping with the Equilibrium of Two Days Ago, followed by a move into a 1H Bearish Order Block that coincides with the Previous Day’s Equilibrium.
• Example 3: The same 1H PD Arrays viewed from a 4H chart, alongside Weekly Price Levels – giving you a higher timeframe context that supports or invalidates lower timeframe setups.
• Example 4: A combination of two timeframes for added context. A 4H Bullish Fair Value Gap is nested inside the current Weekly Equilibrium Key Level . On the 15M chart , we observe a reaction that creates an Inversion Fair Value Gap , which aligns with the Equilibrium Key Level of the previous 4H candle .
This indicator doesn’t replace your trading plan—it enhances your ability to execute it. It’s a precision tool made for ICT traders who understand context, structure, and probability.

ICT Setup 04 [TradingFinder] SFP Sweep Liquidity Fake CHoCH/BOS🔵 Introduction
In smart money and ICT based trading, liquidity is never random. Some of the most meaningful market moves begin with a liquidity sweep where price intentionally hunts a previous swing high or swing low to trigger stop loss orders and absorb volume.
This manipulation is often followed by a sharp reversal from a reaction zone, creating ideal conditions for a high probability entry. This indicator is built to detect exactly that. It identifies a valid swing point and defines a reaction zone where price is likely to react.
For short setups, the zone lies between the swing high and the maximum of the candle’s open or close. For long setups, it’s drawn from the swing low to the minimum of the open or close.
When price returns to this zone and forms a qualified confirmation candle typically a doji or a small bodied candle that closes inside the zone while sweeping the liquidity this is a potential sign of reversal.
The candle must show both the sweep and the inability to hold above or below the key level, signaling a fake breakout or failed move. By combining elements of liquidity hunt, reaction zone rejection, and candle based entry confirmation, this tool highlights sniper entry points used by smart money to trap retail traders and reverse the trend. It helps filter out noise and enhances timing, making it ideal for trading in alignment with institutional order flow.
Long Position :
Short Position :
🔵 How to Use
This indicator is designed to highlight precise moments where price sweeps liquidity and reacts within a high probability reversal zone. By identifying clean swing highs and lows and defining a smart reaction zone around them, it filters out weak fakeouts and focuses only on setups with strong institutional footprints.
The tool works best when combined with market structure analysis and is suitable for both scalping and intraday trading. Below is a breakdown of how to interpret the signals for long and short positions based on the visual setups provided.
🟣 Long Setup
In a long setup, the indicator first detects a valid swing low where liquidity has likely accumulated below. A reaction zone is then drawn between the swing low and the minimum of the open or close of the swing candle.
When price returns to this zone, it must sweep the previous low and form a precise confirmation candle, such as a doji or a small bodied candle, that closes inside the zone. This candle must also reject the lower level, showing failure to continue downward.
As shown in the chart, once the liquidity grab is complete and the confirmation candle forms, a clean long signal is issued, indicating a potential bullish reversal backed by smart money behavior.
🟣 Short Setup
In a short setup, the indicator identifies a swing high where buy-side liquidity is resting. It then constructs a reaction zone between the high and the maximum of the open or close of the swing candle. Price must return to this zone, sweep the swing high, and form a bearish confirmation candle inside the zone.
A classic example is a doji or rejection candle that traps breakout buyers and fails to hold above the previous high. In the provided chart, the price aggressively hunts the liquidity above the swing high, but the close within the reaction zone signals exhaustion, prompting a short signal with high reversal probability.
These setups represent moments where price action, liquidity behavior, and candle structure align to offer strong entries. By focusing on clean sweeps and reactive confirmations, the indicator helps traders stay on the side of smart money and avoid common breakout traps.
🔵 Settings
🟣 Logical settings
Swing period : You can set the swing detection period.
Max Swing Back Method : It is in two modes "All" and "Custom". If it is in "All" mode, it will check all swings, and if it is in "Custom" mode, it will check the swings to the extent you determine.
Max Swing Back : You can set the number of swings that will go back for checking.
Maximum Distance Between Swing and Signal :The maximum number of candles allowed between the swing point and the potential signal. The default value is 50, ensuring that only recent and relevant price reactions are considered valid.
🟣 Display settings
Displaying or not displaying swings and setting the color of labels and lines.
🟣 Alert Settings
Alert SFP : Enables alerts for Swing Failure Pattern.
Message Frequency : Determines the frequency of alerts. Options include 'All' (every function call), 'Once Per Bar' (first call within the bar), and 'Once Per Bar Close' (final script execution of the real-time bar). Default is 'Once per Bar'.
Show Alert Time by Time Zone : Configures the time zone for alert messages. Default is 'UTC'.
🔵 Conclusion
This indicator is built for traders who rely on liquidity driven setups and smart money principles. By combining swing structure analysis with precision reaction zones and strict entry confirmation, it isolates the exact moments where price sweeps liquidity and fails to continue. These are high value points where institutional activity often reveals itself, and retail traps unfold.
Unlike generic breakout tools, this script focuses on quality over quantity by requiring both a sweep of a swing high or low and a confirmed rejection candle that closes inside a predefined zone. With customizable swing depth, proximity filters, visual highlights, and alert functions, it offers a complete framework for identifying and acting on fake breakouts with confidence. Whether you trade forex, crypto, or indices, this tool enhances your ability to align with true order flow and take entries where liquidity is most likely to shift.

HyperFlowIntroduction
HyperFlow is a premium market structure and liquidity rotation model built around the principles of internal inefficiencies, tested imbalances, and delivery shifts. Drawing inspiration from ICT concepts, it provides a high-level framework for identifying smart money footprints and timing entries with precision.
Rather than forecasting direction, HyperFlow focuses on recognizing repeatable delivery behaviors — helping traders visually track liquidity shifts from internal ranges to external objectives with consistency.
Core Philosophy
Markets are governed by the logic of liquidity engineering — the search and destruction of internal inefficiencies (Fair Value Gaps), followed by continuations toward external liquidity.
Timeframes to use:
HTF -> LTF
5m -> 15s
15m -> 1m
1h -> 5m
4h -> 15m
Daily -> 1h
Weekly -> 4h
Monthly -> 1D
HyperFlow identifies these transitions by:
Detecting High Timeframe Fair Value Gaps (HTF FVGs) — structural imbalances created by displacement
Tracking Valid Tests of those FVGs — signaling willingness to respect internal structure
Filtering for Delivery Confirmations — only acting when price delivers with intent through reclaimed imbalances
Mapping Risk and Objective Zones — using recent swing structures to define stop and target logic rooted in market logic
All components are reactive, visual, and non-repainting — designed to highlight structure after it forms, not anticipate it prematurely.
Key Features
Internal Range Liquidity Zones: Cleanly marked HTF imbalances show where price may seek efficiency
Tested FVG Filtering: Signals only form on valid rebalances — we wait for proof, not potential
Shift in Delivery Conditions: Price must show intent to reclaim imbalance before any rotation is considered
Automatic Objective Mapping: Recent structural highs/lows are used to project stop and target zones automatically
Session Filters + Time Alignment: Restrict signals to high-probability hours or defined killzones
Minimal, High-Impact Visuals: Tested/untested FVGs are differentiated by transparency and tone, keeping your chart clean and focused
HyperFlow is built for:
Traders who understand price delivery theory
Analysts studying displacement → reversion → continuation
Those seeking higher timeframe bias alignment through tested structure
Users of ICT-based concepts who want a visual, rules-based companion
This is not a beginner's tool. It’s for those seeking repeatable execution through structure and refinement, not guesswork.
Terms and Conditions
Our charting tools are products provided for informational and educational purposes only and do not constitute financial, investment, or trading advice. Our charting tools are not designed to predict market movements or provide specific recommendations. Users should be aware that past performance is not indicative of future results and should not be relied upon for making financial decisions. By using our charting tools, the purchaser agrees that the seller and the creator are not responsible for any decisions made based on the information provided by these charting tools. The purchaser assumes full responsibility and liability for any actions taken and the consequences thereof, including any loss of money or investments that may occur as a result of using these products. Hence, by purchasing these charting tools, the customer accepts and acknowledges that the seller and the creator are not liable nor responsible for any unwanted outcome that arises from the development, the sale, or the use of these products. Finally, the purchaser indemnifies the seller from any and all liability. If the purchaser was invited through the Friends and Family Program, they acknowledge that the provided discount code only applies to the first initial purchase of any SMCapital product. The purchaser is therefore responsible for cancelling – or requesting to cancel – their subscription in the event that they do not wish to continue using the product at full retail price. If the purchaser no longer wishes to use the products, they must unsubscribe from the membership service, if applicable. We hold no reimbursement, refund, or chargeback policy. Once these Terms and Conditions are accepted by the Customer, before purchase, no reimbursements, refunds or chargebacks will be provided under any circumstances.
By continuing to use these charting tools, the user acknowledges and agrees to the Terms and Conditions outlined in this legal disclaimer.

Devils MarkThe Devil’s Mark Indicator identifies bullish or bearish candlesticks with no opposing wick, plotting a horizontal line at the open/low (bullish) or open/high (bearish) price to mark the inefficiency.
This line highlights the level where price is expected to retrace to form the missing wick, serving as a visual cue.
The line is automatically removed from the chart once price crosses it, confirming the inefficiency has been rebalanced.
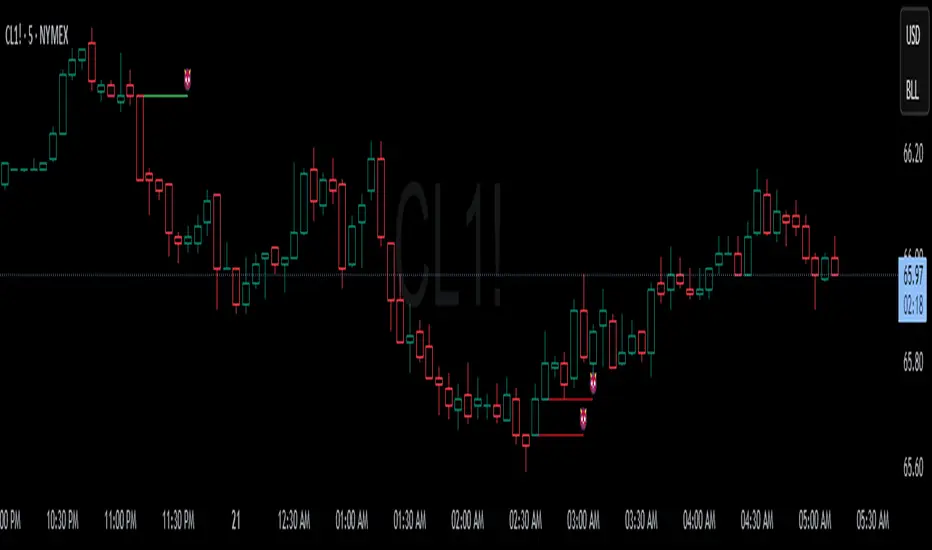
Contrarian with 5 Levels5 Levels application was inspired and adapted from Predictive Ranges indicator developed by Lux Algo. So much credit to their work.
Indicator Description: Contrarian with 5 Levels
Overview
The "Contrarian with 5 Levels" indicator is a powerful tool designed for traders seeking to identify potential reversal points in the market by combining contrarian trading principles with dynamic support and resistance levels. This indicator overlays a Simple Moving Average (SMA) shadow and five adaptive price levels, integrating Institutional Concepts of Structure (ICT) such as Break of Structure (BOS) and Market Structure Shift (MSS) to provide clear buy and sell signals. It is ideal for traders looking to capitalize on overextended price movements, particularly on the daily timeframe, though it is adaptable to other timeframes with proper testing.
How It Works
The indicator operates on two core components:
Contrarian SMA Shadow: A shaded region between the SMA of highs and lows (default length: 100) acts as a dynamic zone to identify overbought or oversold conditions. When the price moves significantly outside this shadow, it signals potential exhaustion, aligning with contrarian trading principles.
Five Adaptive Levels: Using a modified ATR-based calculation, the indicator plots five key levels (two resistance, one average, and two support) that adjust dynamically to market volatility. These levels serve as critical zones for potential reversals.
ICT Structure Analysis: The indicator incorporates BOS and MSS logic to detect shifts in market structure, plotting bullish and bearish breaks with customizable colors for clarity.
Buy and sell signals are generated when the price crosses key levels while outside the SMA shadow, indicating potential reversal opportunities. The signals are visualized as small circles above (sell) or below (buy) the price bars, making them easy to interpret.
Mathematical Concepts
SMA Shadow: The indicator calculates the SMA of the highest highs and lowest lows over a user-defined period (default: 100). This creates a dynamic range that highlights extreme price movements, which contrarian traders often target for reversals.
Five Levels Calculation: The five levels are derived using a volatility-adjusted formula based on the Average True Range (ATR). The average level (central pivot) is calculated as a smoothed price, with two upper (resistance) and two lower (support) levels offset by a multiple of the ATR (default multiplier: 6.0). This adaptive approach ensures the levels remain relevant across varying market conditions.
ICT BOS/MSS Logic: The indicator identifies pivot highs and lows on a user-defined timeframe (default: daily) to detect structural breaks. A BOS occurs when the price breaks a prior pivot high (bullish) or low (bearish), while an MSS signals a shift in market direction, providing context for potential reversals.
Entry and Exit Rules
Buy Signal (Blue Dot Below Bar): Triggered when the closing price is below both the SMA shadow (smaLow) and the average level (avg), and the price crosses under either the first or second support level (prS1 or prS2). This suggests the market may be oversold, indicating a potential reversal upward.
Sell Signal (White Dot Above Bar): Triggered when the closing price is above both the SMA shadow (smaHigh) and the average level (avg), and the price crosses over either the first or second resistance level (prR1 or prR2). This suggests the market may be overbought, indicating a potential reversal downward.
Recommended Usage
This indicator is optimized for the daily timeframe, where it has been designed to capture significant reversal opportunities in trending or ranging markets. However, it can be adapted to other timeframes (e.g., 1H, 4H, 15M) with proper testing of settings such as SMA length, ATR multiplier, and structure timeframe. Users are encouraged to backtest and optimize parameters to suit their trading style and asset class.
Customization Options
SMA Length: Adjust the SMA period (default: 100) to control the sensitivity of the shadow.
Five Levels Length and Multiplier: Modify the length (default: 200) and ATR multiplier (default: 6.0) to fine-tune the support/resistance levels.
Timeframe Settings: Set separate timeframes for structure analysis and five levels to align with your trading strategy.
Color and Signal Display: Customize colors for BOS/MSS lines and toggle buy/sell signals on or off for a cleaner chart.
Why Use This Indicator?
The "Contrarian with 5 Levels" indicator combines the power of contrarian trading with dynamic levels and market structure analysis, offering a unique perspective for identifying high-probability reversal setups. Its intuitive design, customizable settings, and clear signal visualization make it suitable for both novice and experienced traders. Whether you're trading forex, stocks, or cryptocurrencies, this indicator provides a robust framework for spotting potential turning points in the market.
We hope you find the "Contrarian with 5 Levels" indicator a valuable addition to your trading toolkit! Happy trading!
Please leave feedback in the comments section.
