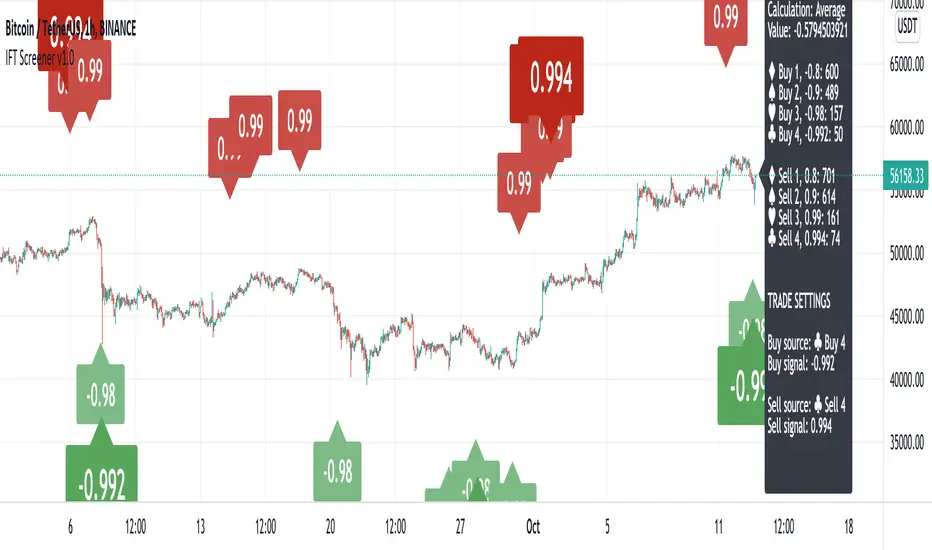
Inverse Fisher Transform ScreenerThis is a Screener for Inverse Fisher Transform on multiple oscillators
This tool is intended to aid you to visually analyse reasonable buy and sell IFT-signal thresholds across multiple tokens and different sources. It will help you speed up the tedious and manual work of trying out different IFT-settings when you're able to review the chart visually to find which values are present the most often and the location of that signal on the chart.
What does it bring to the table, why is it useful?
- Invese Fisher Transform on multiple oscillators such as RSI, MFI, CCI, Stochastic
- Combine multiple sources into one signal, select how it's calculated
- Visually review the chart for good IFT-settings
- 4 dynamic buy labels with different thresholds
- 4 dynamic sell labels with different thresholds
- Buy and sell on signal reversal
- Create your own trade alerts for automation
- Backtester compatible (plots 1 and 2 for buy and sell signals)
- A dynamic table counting amount of signals for each setting
- The labels are automatically updated when you change the values in the settings
How to use?
1. Change signal source and method
2. Change buy and sell thresholds
3. Show/hide additional labels
4. Review chart
5. Change trade settings
6. Backtest
7. Create alerts
Description
With this indicator you're able to visually review the signal strength of one or multiple oscillators processed with Inverse Fisher Transform ( IFT ), combine them and choose the method of calculation when they are combined. This produces a signal which strongly fluctuates between -1 and +1 instead of the more common 0-100 most oscillators uses. The intention is to make the decision making clearer and easier when you decide when to enter or exit a trade. This aims to help you remove the feelings from your trading.
Inverse Fisher Transform was first presented by John Ehlers in Stocks & Commodities V. 22:5 where he proposes to process RSI with the formula for hyperbolic tangent, tanh (x). This transforms the oscillator into a smoother and more compressed version with quicker oscillations.
Index
GoldenCO Aie2 Use of GoldenCO Aie2
This market price movement trend analysis uses exponential moving average which is ema5/20/50. The purpose of using this EMA is to find out the effect of price changes that occur and the current trend of the market whether bullish or bearish.
It is suitable for short-term or long-term trading.
for short term trading, the trader uses ema5-ema20 and for long term trading the trader can use ema5-ema50 as analysis.
This indicator serves as a guide to traders in trading activities.
we hope that, by recognizing and knowing the trend of this price movement it can help traders in trading activities well and can reduce risk. May it benefit the trader.
DISCLAIMER : This is not Buy/Sell call, just sharing idea analysis for education. Trade at your own risk.
AP Index - Geomagnetic disturbancesDaily AP index back to 2015-01-01.
Geomagnetic disturbances can be monitored by ground-based magnetic observatories recording the three magnetic field components. The global Kp index is obtained as the mean value of the disturbance levels in the two horizontal field components, observed at 13 selected, subauroral stations . The name Kp originates from "planetarische Kennziffer" ( = planetary index).
The three-hour index ap and the daily indices Ap, Cp and C9 are directly related to the Kp index. In order to obtain a linear scale from Kp, J. Bartels gave the following table to derive a three-hour equivalent range, named ap index.
Geomagnetic Ap Index: The daily index Ap is obtained by averaging the eight values of ap for each day.
Based on the data from Helmholtz Centre Potsdam GFZ German Research Centre for Geosciences.

Ehlers Relative Vigor Index [CC]The Relative Vigor Index was created by John Ehlers (Cybernetic Analysis For Stocks And Futures pg 58) and this is a momentum indicator that is similar to the Accumulation Distribution Oscillator created by Jim Waters and Larry Williams. He uses digital signal processing to smooth the indicator to provide clear buy and sell signals. The idea behind this indicator is that during uptrends, prices tend to close near the high and during downtrends, prices tend to close near the low. I have included strong buy and sell signals in addition to normal ones so strong signals are darker in color and normal ones are lighter in color. Buy when the line turns green and sell when it turns red. Usually the best signals I have found for this indicator is when the indicator is below the 0 line and turns green then it is usually a sign of a strong uptrend.
Let me know if there are any other scripts you would like to see me publish!

SMART4TRADER-INDEX PATTERN BREAKOUT MULTIThis indicator is designed to analyze the breakdown of previous values of the candles, not only on the selected tool, but also on others. The indicator is well used on the indices of the stock market. In the default indicator, recommended indexes are configured.
The indicator summarizes the results of the analysis of all tools and shows in the form of columns that are above and \ or below the zero line. Additionally, the indicator has two horizontal lines above zero (green) and two horizontal lines below zero (red). The breakdown of these nearest to zero lines signals the possible beginning of the move towards which the column is directed. If the column reached the left line, this means that a very strong trend is noticeable on all the tools selected in the settings.
Additionally, the indicator has a blue line that shows the average value of the columns both above and below the zero line. And also added Hull Moving Average Period (9).
BUY signal:
HIGH > HIGH(1) и LOW > LOW(1)
SELL signal:
HIGH < HIGH(1) и LOW < LOW(1) и LOW < LOW(2)
--------------------------------------------------------
Этот индикатор предназначен для анализа пробития предыдущих значений свечей, не только на выбранном инструменте, но и на других. Индикатор хорошо использовать на индексах фондового рынка. В индикаторе по умолчанию настроены рекомендуемые индексы для анализа.
Индикатор суммирует результаты анализа всех инструментов и показывает в виде столбиков, которые находиться выше и\или ниже нулевой линии. Дополнительно на индикаторе есть две горизонтальные линии выше нуля (зеленый) и две горизонтальные линии ниже нуля (красный). Пробитие этих ближайших к нулю линий сигнализирует о возможном начале движения в сторону, в которую направлен столбик. Если столбик достиг крайней линии, то это значит, что очень сильный тренд заметен на всех инструментах выбранных в настройках.
Дополнительно в индикаторе есть синяя линия, которая показывает среднее значение столбиков как выше, так и ниже нулевой линии. А также добавлена HULL MOVING AVERAGE период (9).
Сигнал на покупку:
HIGH > HIGH(1) и LOW > LOW(1)
Сигнал на продажу:
HIGH < HIGH(1) и LOW < LOW(1) и LOW < LOW(2)

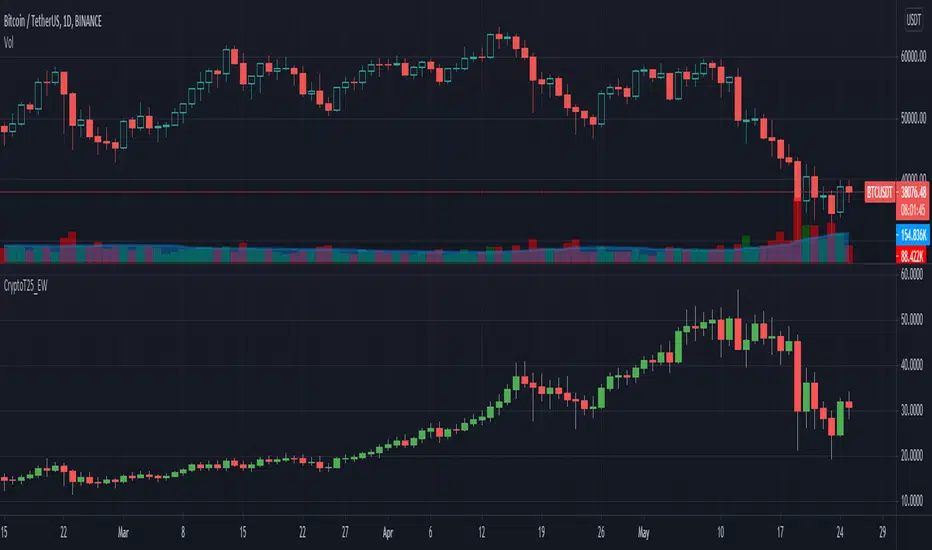
Crypto Top 25 Equal Weight IndexDraws an Equally Weighted Index of 25 securities. The inputs are pre-populated with the Top 25 cryptocurrencies by market cap at the time of publishing the script, but any 25 securities can be used.
Double click on this indicator's pane to view in full screen.
Note: Candle open is always equal to previous candle's close. I did this to avoid problems where sometimes candle open didn't make sense compared to close.
If you're into cryptocurrencies also have a look at these TradingView charts CRYPTOCAP:TOTAL, CRYPTOCAP:TOTAL2 and CRYPTOCAP:OTHERS.
Full CRYPTO pack macd, rsi, obv, ema alert versionThis is the indicator version of a simple, yet very efficient crypto strategy, adapted to 4h time frame, on big coins like ETH and BTC . However it can be adapted to other markets, timeframes etc
For this strategy I use a combination of a trend line , an oscillator, price action and volume .
This study has alert for both long and short entries/exit.
The rules are the next ones:
Long : we check that current candle is ascending and above the moving average, the macd is in positive range, rsi is below overbought level and volume is bigger than the moving avg of volume .
For short, we have the opposite long rules.
If you have any questions, please let me know !

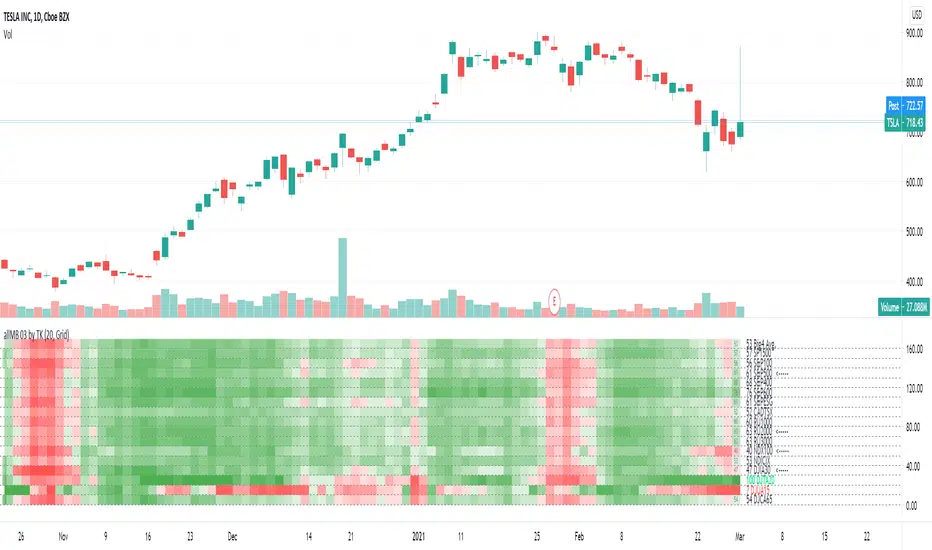
TradiKator 03 All Market BreadthTradiKator 03 All Market Breadth ( allMB 03 by TK ) is a visual indicator that plots All NA Market Breadth ( the percentage securities for all North American main stock exchange index's that is above a certain SMA line ).
Market breadth indicates the wave-induced motion of the whole market.
Q&A
Function and Setting
1. 15 index and 1 avg. or sum.
CADTSX = CANANDA TSX
S&P100 = S&P MEGA CAP 100
S&P500 = S&P LARGE CAP 500 *including S&P100
S&P400 = S&P MIDDLE CAP 400
S&P600 = S&P SMALL CAP 400
SP1500 = S&P 1500 * = S&P500 + S&P400 + S&P600
S&PESG = S&P ESG
NDX100 = NASDAQ 100
NDXCOM = NASDAQ COMPOSITE
RU2000 = RUSSELL 1000 * LARGE and MIDDLE CAP
RU2000 = RUSSELL 2000 * SMALL CAP
RU3000 = RUSSELL 3000 * = RUSSELL 1000 + RUSSELL 2000
DJIA30 = DOW JONES INDUSTRIAL AVERAGE 30
DJTA20 = DOW JONES TRANSPORTATION AVERAGE 20
DJUA15 = DOW JONES UTILITY AVERAGE 15
DJCA65 = DOW JONES COMPOSITE AVERAGE 65 *= DJIA30 + DJTA20 + DJUA15
You can open this indicator by multi times to check the different settings with "above ? SMA" in same time like the picture shows "above 50 days , above 20 days and above 20 days plot in lines"
Also, it is possible to combine this indicator with multiple setting to give the sum of the different "above? SMA"'s the result.
2. 6 choices for above ? SMA
Above 5 days, Above 20 days, Above 50 days, Above 100 days, Above 150 days or Above 200 days,
3. 2 methods to visualize the study result
Colorful grid, Green = more securities above ? SMA , Red = more securities below ? SMA
Line plot, High = more securities above ? SMA , Low = more securities below ? SMA
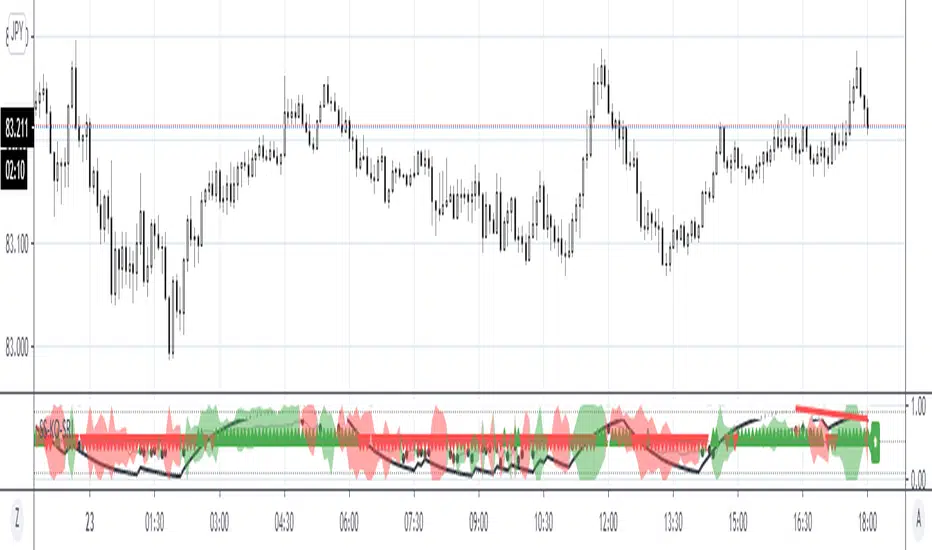
Similarity Search, Karobein and Seasonal Random IndexSimilarity Search, Karobein oscillator (KO) and Seasonal Random Index (SRI)
Description:
This indicator uses dynamic capabilities of Pinescript version 4 coupled with Seasonal Random Index (SRI) and Karobein Oscillator (KO). SRI (green/red areas) is employed to detect trends and KO (black curce) is used to find historical similarities to predict the next bar's direction. The midline arrows are the predictions produced by the similarity search algorithm.
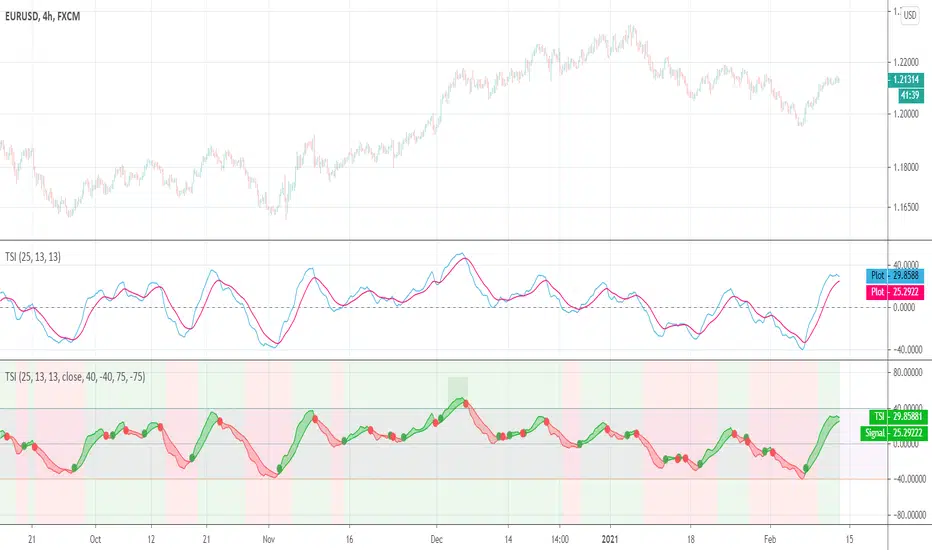
True Strength Index (TSI)User request. A tuned version of the built-in True Strength Index (TSI) indicator with the following options included:
TSI - Signal Histogram
TSI/Signal Crossovers
TSI/Signal Ribbon
Bands breakouts highlighting
Zero line crossovers background
MyAlgo -Index V2PLEASE READ THE ENTIRE POST BEFORE PURCHASING & USING THE MyAlgo Tool. Saves you and me some time in emails and messages. :)
This is the official version of MyAlgo Index V2
PLEASE UNDERSTAND THAT THIS IS A DIFFERENT AND SEPARATE PRODUCT AND SCRIPT FROM "MyAlgo SLIM" FROM THE MyAlgo TRADING TOOL SERIES
Description
The MyAlgo Index is the brain behind the MyAlgo Series and has all needed indicators included that are part of the MyAlgo Algorithms.
It is a very powerful Index showing how many indicators are bullish and how many are not.
All indicators and conditions chosen are unique.
Max Value 15
Min Value 0
White Line Index
Yellow Line ALMA of Index
Very powerful with divergences.
Side Notes
MyAlgo is being updated and upgraded very frequently to suit the requests of our customers.
This is not financial advice. Please read our disclaimer before using it.
Please refer to the signature field if you are interested in gaining access to this script.
Anything below this sentence will be Updates regarding MyAlgo

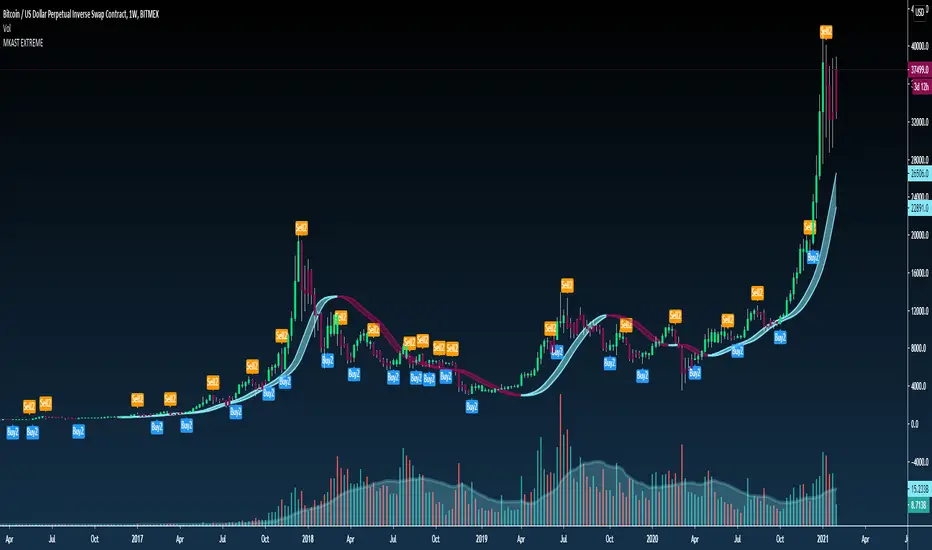
MyAlgo EXTREMEPLEASE READ THE ENTIRE POST BEFORE PURCHASING & USING THE MyAlgo Tool. Saves you and me some time in emails and messages. :)
This is the official version of MyAlgo EXTREME
PLEASE UNDERSTAND THAT THIS IS A DIFFERENT AND SEPARATE PRODUCT AND SCRIPT FROM "MyAlgo SLIM" FROM THE MyAlgo TRADING TOOL SERIES
Description
Buy & Sell Alerts can be set on all Tickers. This includes, but is not limited to Crypto, Commodities , FOREX, Equities and Indices. Also all candle Types are compatible.
Recommended Time-frames - Due to the complexity of MyAlgo-SLIM the user has a choice between three algorithms and is like that able to trade on all timeframes with the highest returns.
MyAlgo combines many different aspects at the same time, scans multiple other Algorithms and comes to a conclusion based on over 1350 lines of code.
It is based on Divergences, Elliott Waves , Ichimoku , MACD , MACD Histogram, RSI , Stoch , CCI , Momentum, OBV, DIOSC, VWMACD, CMF and multiple EMAs.
Every single aspect is weighted into the decision before giving out an indication.
Most buy/sell Algorithms FAIL because they try to apply the same strategy to every single chart, which
are as individual as humans. To conquer this problem, MyAlgo has a wide range of settings and variables which can be easily
modified.
To make it a true strategy, MyAlgo has as well settings for Take Profit Points and Stop
Losses. Everything with an Alert Feature of course so that FULL AUTOMATION IS POSSIBLE.
I know from experience that many people take one Algorithm and are simply too LAZY to add multiple Algorithms to make a rational choice. The result of that is that they lose money, by following blatantly only one Algorithm.
MyAlgo has additional 15 Indicators, perfect for all markets, which can be turned on and off individually.
Side Notes
MyAlgo is being updated and upgraded very frequently to suit the requests of our customers.
This is not financial advice. Please read our disclaimer before using it.
Please refer to the signature field if you are interested in gaining access to this script.
Anything below this sentence will be Updates regarding MyAlgo
Comparison (Malaysia Index & Sector)This is just a simple tool for convenient to compare and showing a clear image of all sector and index in Malaysia. They are just in one indicator. From this indicator, you can predict momentum of each sector in Malaysia, which is currently in bull or bear trend.
STRUCTURE
In the setting, the first line with the option of the following index (Malaysia Index) :
1. FBMKLCI
2. FTSEMYX:FBMSCAP
3. FTSEMYX:FBMACE
4. FTSEMYX:FBM70
5. FTSEMYX:FBMT100
6. FTSEMYX:FBMFLG
7. FTSEMYX:FBMEMAS
8. FTSEMYX:FA40
9. FTSEMYX:FBMMSCS
10. FTSEMYX:FBMAPMYR
11. FTSEMYX:FBMMSCAP
The rest of lines is all of the following sector (Malaysia Sector):
1. Technology
2. Telecommunication
3. Health
4. Consumer Product
5. Industrial Product
6. Construction
7. Property
8. Plantation
9. Utilities
10. Transportation
11. Energy
12. REIT
13. Finance
The last line (Line 15) is provided for other stock/index which is not available in option to manually fill.
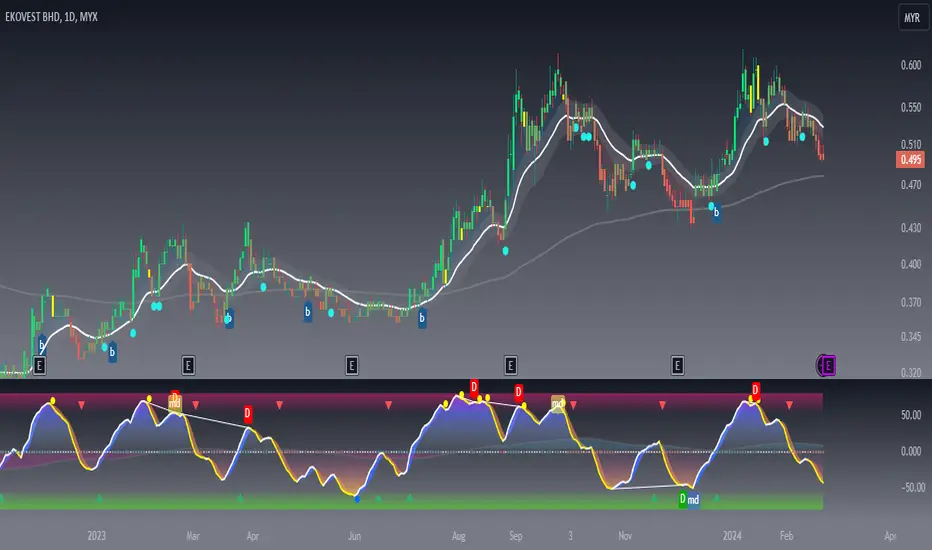
All sector and index price are smoothen by Moving Average (MA). The default moving average is Relative Moving Average (RMA) which is used in Relative Strength Index ( RSI ) Oscillator. But the range is different from RSI , it is from -100 to 100 instead of 0 to 100. In the end, result and interpretation are just the same as RSI . Green area indicates oversold area, while red area is overbought.
Other choice of Moving Averages are available to change.
The problem of putting all together is the script may take longer to process. It is just for convenient use.
Bottom-Up or Top-Down Invest?

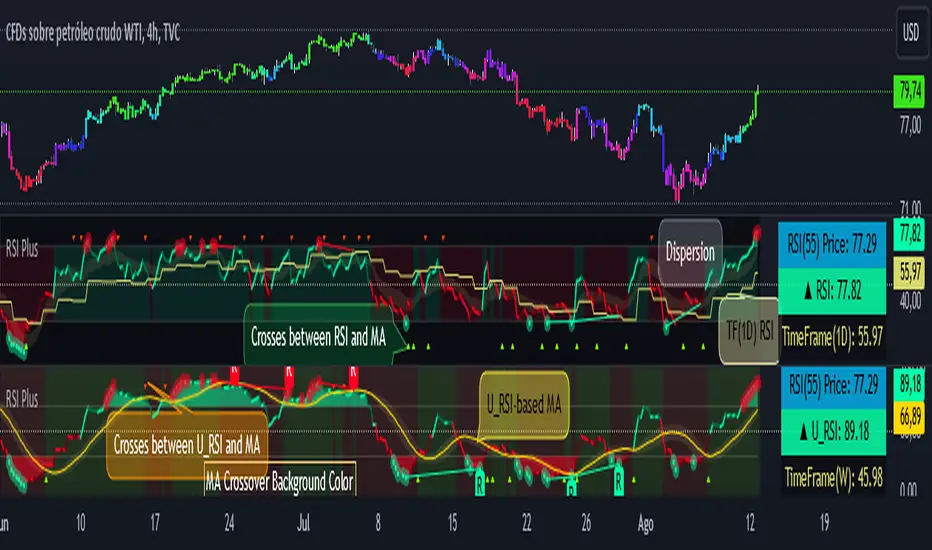
RSI PlusRSI Plus:
☑️ Show the divergences.
☑️ Shows the approximate price of an RSI level (by default it is level 55 but it can be changed for any other level).
☑️ Shows the bulls and bears zones, in green when crossing level 50 up and red when crossing down.
☑️ Circle the highest and lowest levels as possible purchases and sales.
☑️ Includes a smoothed RSI.
RSI Plus:
☑️ Muestra las divergencias.
☑️ Muestra el precio aproximado de un nivel del RSI (por defecto viene el nivel 55 pero se lo puede cambiar por cualquier otro nivel).
☑️ Muestra la zonas de toros y osos, en verde cuando cruza hacia arriba el nivel 50 y rojo cuando cruza hacia abajo.
☑️ Marca con un circulo los niveles mas alto y mas bajos como posibles compras y ventas.
☑️ Incluye un RSI suavizado.
(FINNIFTY) NIFTY Financial Service FreeFloat VolumeThis indicator is build keeping in mind how the Indian Market is formed - the free-float market capitalization concept
1) Considered new FINNIFTY - Nifty Financial Service index stocks according to NSE
2) Multiplied each stock Volume by its Weightage given in NSE Site every month End - means giving importance to volume by its weightage
3) Green Candle - Considered as +Ve Volume , Red Candle - Considered as -Ve Volume
4) Diff of +Ve Volume & -Ve Volume give clear picture market will go up or down
Note:- This Indicator work only for 15 Min time frame
Gives better results good Risk Reward used near Supp/Resistance
Combine with FINNIFTY Advance-Decline Ratio give confidence on the move
Eg:-
Bullish Scenario
Near Support, Volume Turned -Ve to +Ve, Adv /Dec of Fin Nifty >11/15
or combine any candle patterns( Pin Bar ) at Sup/Res or combine with Chart Pattern(Triangle/ Rectangle )
Bearish Scenario - Vice Versa to above

Volume Weighted Aggregated Premium Index v0.20.2 version of the indicator that determines the aggregate premium, weighted by volume, from all leading derivatives exchanges. The main difference was the change in the volume weighing algorithm from static to real time, and ETH was added to the indicator.
Exchanges:
Binance
OKEx
Huobi
Bybit
FTX
BitMEX
Deribit

Finex PremiumBitfinex:BTCUSD premium/discount compared to market average spot exchanges.
Smoothed option available.

Crypto Directional Movement Index DMI/ADXCrypto ADX + DMI
This indicator is a customised version of the ADX + DMI by J. Welles Wilder in 1978, with default settings optimal for cryptocurrencies.
What is the DMI (ADX) Indicator?
According to Investopedia:
DMI (ADX) consists of three indicators that measure a trend’s strength and direction. Three lines compose the Direction Movement Index (DMI): ADX (black line), DI+ (green line), and DI- (red line). The Average Directional Index (ADX) line shows the strength of the trend. The higher the ADX value, the stronger the trend. The color of the lines can be altered, but black, green, and red are the default in most software.
The Plus Direction Indicator (DI+) and Minus Direction Indicator (DI-) show the current price direction. When the DI+ is above DI-, the current price momentum is up. When the DI- is above DI+, the current price momentum is down.
This Version
The ADX default value has been changed to from 14 to 2 (optimal for cryptocurrencies). The background flashes red when the –DMI goes above the HZ1 threshold and green when the +DMI does the same. There is an option to change it so that it’ll only flash when the ADX and the DMI are both above the threshold. The ADX changes color when above HZ1.
Red and green plotshapes appear at DMI crossovers and three horizontal lines have also been added.
Any suggestions are most welcome

Premium Index Generic TheHuntThis indicator is similar to the standard premium index we made for bitcoin, but this one is for alts.
Just like with the bitcoin premium index, you can compare the spot price of a certain altcoin with the price on a futures exchange. The indicator can be used to spot potential strength or weakness in the market.
You can fill in 1 spot exchange pair and compare it with 2 futures exchange pairs.
For example fill in ETHUSD on coinbase and compare it with the future prices on bitmex and bybit.
We can clearly see that on that dump in the blue area, the premium index showed that spot prices were consistently higher than future prices which told us spot was buying the dip.

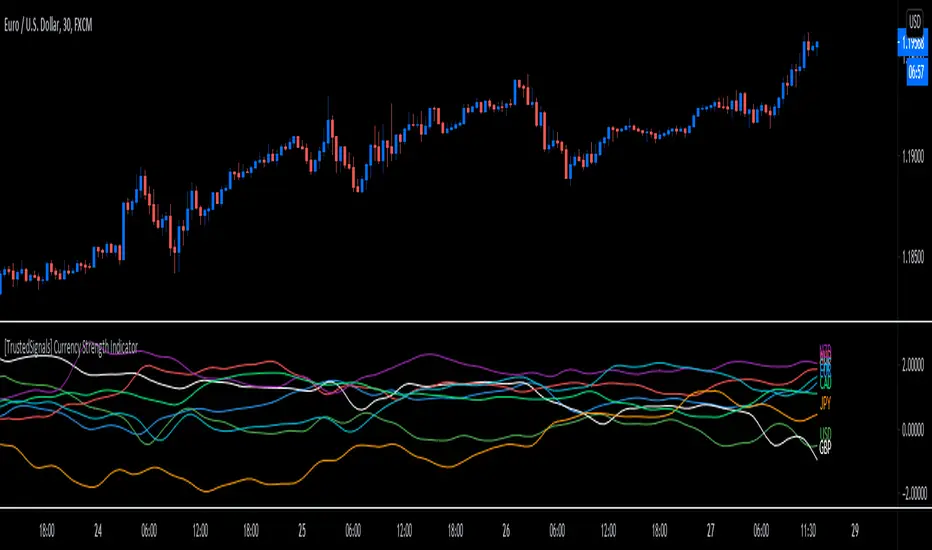
[TrustedSignals] Currency Strength IndicatorOur own branded currency strength meter gives you a quick visual guide to which currencies are currently strong, and which ones are weak.
The meter measures the strength of all forex cross pairs and applies calculations on them to determine the overall strength for each individual currency.
It is useful as a quick guide to which currencies you might want to trade, and which might be worth staying away from. For instance, if a certain currency is very strong, and another suddenly turns weaker, you may find a trading opportunity
The indicator has an extra option the user can activate, to show only the 2 indexes correlated to the displayed pair on the chart. For example, if the EURUSD pair is displayed on the chart, the indicator will only show the EUR index and the USD index.
It is recommended to use a lookback length of over 90 for Timeframes higher than 60min, and under 60 for lower intraday timeframes
Use the link below to obtain access to this indicator
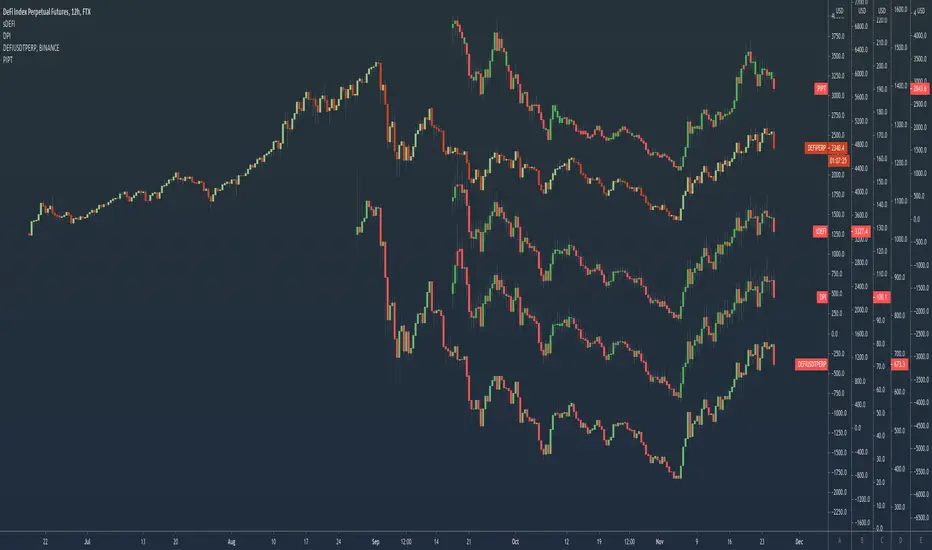
PIPT | Power Index Pool Token | DeFi indexPowerPool provides a DeFi index that has too many components to be used as a chart ticker.
So here is an indicator to bypass the ticker limit.
From the PowerPool docs : app.powerpool.finance
The chart shows it in comparison to other DeFi indexes, quite a difference as you can see!
DPI | DeFi Pulse IndexTokenSets and DeFi Pulse provide a DeFi index that has too many components to be used as a chart ticker.
So here is an indicator to bypass the ticker limit.
From the TokenSets docs : www.tokensets.com
The chart shows it in comparison to other DeFi indexes, quite a difference as you can see!

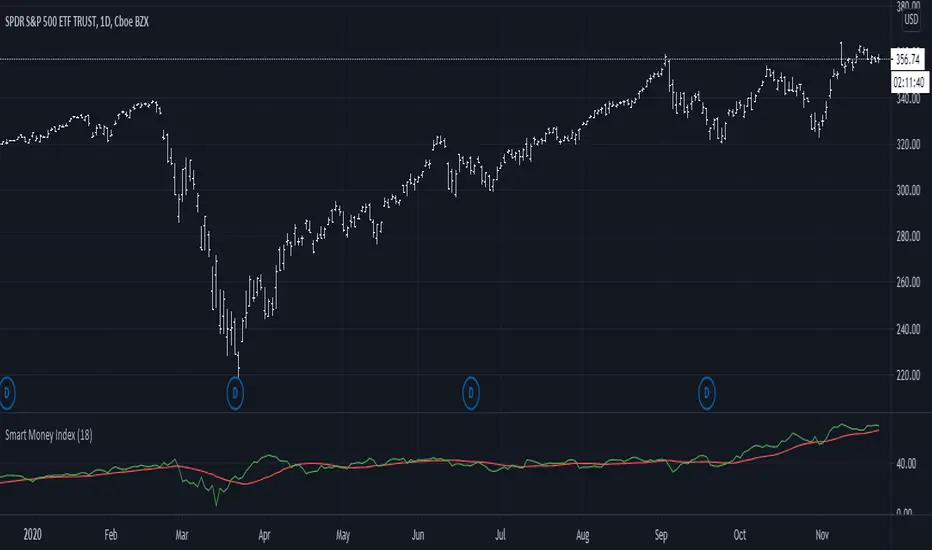
Smart Money Index (SMI)It came to my attention that one very common implementation of SMI was incorrect; rather than subtracting the first hour delta and adding the last hour delta it subtracts the whole day delta and adds the last 30m delta. While this indicator might have had some use, it is not what I understand to be the actual Smart Money Index and so I post this as a correction for use in other scripts.