Liquidation Heatmap [Alpha Extract]A sophisticated liquidity zone visualization system that identifies and maps potential liquidation levels based on swing point analysis with volume-weighted intensity measurement and gradient heatmap coloring. Utilizing pivot-based pocket detection and ATR-scaled zone heights, this indicator delivers institutional-grade liquidity mapping with dynamic color intensity reflecting relative liquidity concentration. The system's dual-swing detection architecture combined with configurable weight metrics creates comprehensive liquidation level identification suitable for strategic position planning and market structure analysis.
🔶 Advanced Pivot-Based Pocket Detection
Implements dual swing width analysis to identify potential liquidation zones at pivot highs and lows with configurable lookback periods for comprehensive level coverage. The system detects primary swing points using main pivot width and optional secondary swing detection for increased pocket density, creating layered liquidity maps that capture both major and minor liquidation levels across extended price history.
🔶 Multi-Metric Weight Calculation Engine
Features flexible weight source selection including Volume, Range (high-low spread), and Volume × Range composite metrics for liquidity intensity measurement. The system calculates pocket weights based on market activity at pivot formation, enabling traders to identify which liquidation levels represent higher concentration of potential stops and liquidations with configurable minimum weight thresholds for noise filtering.
🔶 ATR-Based Zone Height Framework
Utilizes Average True Range calculations with percentage-based multipliers to determine pocket vertical dimensions that adapt to market volatility conditions. The system creates ATR-scaled bands above swing highs for short liquidation zones and below swing lows for long liquidation zones, ensuring zone heights remain proportional to current market volatility for accurate level representation.
🔶 Dynamic Gradient Heatmap Visualization
Implements sophisticated color gradient system that maps pocket weights to intensity scales, creating intuitive visual representation of relative liquidity concentration. The system applies power-law transformation with configurable contrast adjustment to enhance differentiation between weak and strong liquidity pockets, using cyan-to-blue gradients for long liquidations and yellow-to-orange for short liquidations.
🔶 Intelligent Pocket State Management
Features advanced pocket tracking system that monitors price interaction with liquidation zones and updates pocket states dynamically. The system detects when price trades through pocket midpoints, marking them as "hit" with optional preservation or removal, and manages pocket extension for untouched levels with configurable forward projection to maintain visibility of approaching liquidity zones.
🔶 Real-Time Liquidity Scale Display
Provides gradient legend showing min-max range of pocket weights with 24-segment color bar for instant liquidity intensity reference. The system positions the scale at chart edge with volume-formatted labels, enabling traders to quickly assess relative strength of visible liquidation pockets without numerical clutter on the main chart area.
🔶 Touched Pocket Border System
Implements visual confirmation of executed liquidations through border highlighting when price trades through pocket zones. The system applies configurable transparency to touched pocket borders with inverted slider logic (lower values fade borders, higher values emphasize them), providing clear historical record of liquidated levels while maintaining focus on active untouched pockets.
🔶 Dual-Swing Density Enhancement
Features optional secondary swing width parameter that creates additional pocket layer with tighter pivot detection for increased liquidation level density. The system runs parallel pivot detection at both primary and secondary swing widths, populating chart with comprehensive liquidity mapping that captures both major swing liquidations and intermediate level clusters.
🔶 Adaptive Pocket Extension Framework
Utilizes intelligent time-based extension that projects untouched pockets forward by configurable bar count, maintaining visibility as price approaches potential liquidation zones. The system freezes touched pocket right edges at hit timestamps while extending active pockets dynamically, creating clear distinction between historical liquidations and forward-projected active levels.
🔶 Weight-Based Label Integration
Provides floating labels on untouched pockets displaying volume-formatted weight values with dynamic positioning that follows pocket extension. The system automatically manages label lifecycle, creating labels for new pockets, updating positions as pockets extend, and removing labels when pockets are touched, ensuring clean chart presentation with relevant liquidity information.
🔶 Performance Optimization Framework
Implements efficient array management with automatic clean-up of old pockets beyond lookback period and optimized box/label deletion to maintain smooth performance. The system includes configurable maximum object counts (500 boxes, 50 labels, 100 lines) with intelligent removal of oldest elements when limits are approached, ensuring consistent operation across extended timeframes.
This indicator delivers sophisticated liquidity zone analysis through pivot-based detection and volume-weighted intensity measurement with intuitive heatmap visualization. Unlike simple support/resistance indicators, the Liquidation Heatmap combines swing point identification with market activity metrics to identify where concentrated liquidations are likely to occur, while the gradient color system instantly communicates relative liquidity strength. The system's dual-swing architecture, configurable weight metrics, ATR-adaptive zone heights, and intelligent state management make it essential for traders seeking strategic position planning around institutional liquidity levels across cryptocurrency, forex, and futures markets. The visual heatmap approach enables instant identification of high-probability reversal zones where cascading liquidations may trigger significant price reactions.
Liquidation

Simulated Liquidation Heatmap [QuantAlgo]🟢 Overview
This indicator visualizes where clusters of stop-loss orders and liquidation levels are likely located, displayed as a 'heatmap'. It's based on the concept of market structure liquidity: large groups of stop orders tend to gather around obvious technical levels (like swing highs and lows), and these pools of orders often attract price movement from institutional traders. The indicator uses a fractal-based algorithm to identify these high-probability liquidation zones and displays them as dynamic, color-coded boxes.
The key feature is the thermal color gradient, which indicates the freshness (age) and therefore the relative relevance of the liquidity zone. Hot colors (e.g., Red/Yellow) represent fresh clusters that have just formed, suggesting strong and immediate liquidity interest. Cold colors (e.g., Blue/Purple) represent aged or decaying clusters that are becoming less relevant over time. This visualization allows traders to anticipate potential liquidity sweeps (stop hunts) and understand areas of significant retail and institutional positioning.
🟢 Key Features
1. Liquidity Zone Heatmap
The core function is the identification of swing high and swing low price points using a user-defined Lookback period. These points are where retail traders are statistically most likely to place their stop-loss orders. The indicator simulates the clustering of these orders by drawing a zone (box) around the detected swing point, with the vertical size controlled by the Stop/Liquidation Zone Width (%) setting.
▶ Cluster Lookback: Defines the sensitivity of swing point detection. Lower values detect frequent, minor zones (scalping/intraday); higher values detect major, stronger swing points (swing trading).
▶ Zone Width (%): Sets the percentage range above and below the swing point where stops are simulated to cluster, accounting for slippage and typical stop placement spread.
▶ Liquidity Decay: Zones gradually fade in color intensity and are eventually removed after the user-defined Liquidity Decay Period (Bars), ensuring the heatmap only displays relevant, current liquidity areas.
▶ Round Number Filter: An optional filter that limits the display to liquidity zones occurring only at psychologically significant round numbers (e.g., $100, $1,500.00), which typically attract higher concentrations of orders.
2. Thermal Color Gradient
The heatmap's color is a direct function of the zone's age, providing a visual proxy for immediate relevance.
▶ Freshness: Newly created zones are displayed in the Hot Color (high relevance).
▶ Decay: As bars pass, the zone color transitions along the gradient toward the Cold Color and increased transparency (lower relevance), until it is removed entirely.
▶ Color Schemes: Multiple pre-configured and custom color schemes are available to optimize the visualization for different chart themes and color preferences.
3. Liquidity Heat Thermometer
An optional visual thermometer is displayed on the chart to provide an instant, overall assessment of the current liquidation heat level in the immediate vicinity of the price.
▶ Calculation: The thermometer calculates an aggregate heat score based on the age and proximity of all liquidity zones within a user-defined Zone Detection Range (%) of the current price.
▶ Visual Feedback: A marker (triangle) points to the corresponding level on the thermometer's color gradient (Hot to Cold). A high reading indicates price is close to fresh, dense stop clusters, suggesting high volatility or an imminent liquidity sweep is probable. A low reading indicates price is in a low-density or aged liquidity area.
▶ Customization: The thermometer's resolution, position, and text size are fully customizable for optimal chart placement and readability.
🟢 Practical Applications
▶ Anticipate Sweeps: Prioritize trading in the direction of Hot (fresh) liquidity zones. For example, a hot low-side zone suggests strong sell-side liquidity (stop-losses) is available for large buyers to sweep.
▶ Filter Noise: Use the Round Number Filter to focus only on the highest probability liquidation zones, which are often at clean, psychological price levels.
▶ Validate Entries: Combine the Heat Thermometer with price action analysis. A rising heat level indicates increasing proximity to a major stop cluster, signaling a potential turn or an aggressive market move to sweep those stops.
▶ Risk Management: Understand that price often acts dynamically around these zones. High heat levels imply high risk/reward setups; stops should be placed strategically beyond the defined Liquidation Zone Width.
▶ Multi-Timeframe Context: Higher timeframes (e.g., Daily, 4-Hour) often reveal more significant, major liquidity zones. Use this indicator on lower timeframes (e.g., 5-min, 15-min) for execution, but prioritize zones that align with higher-timeframe structures.

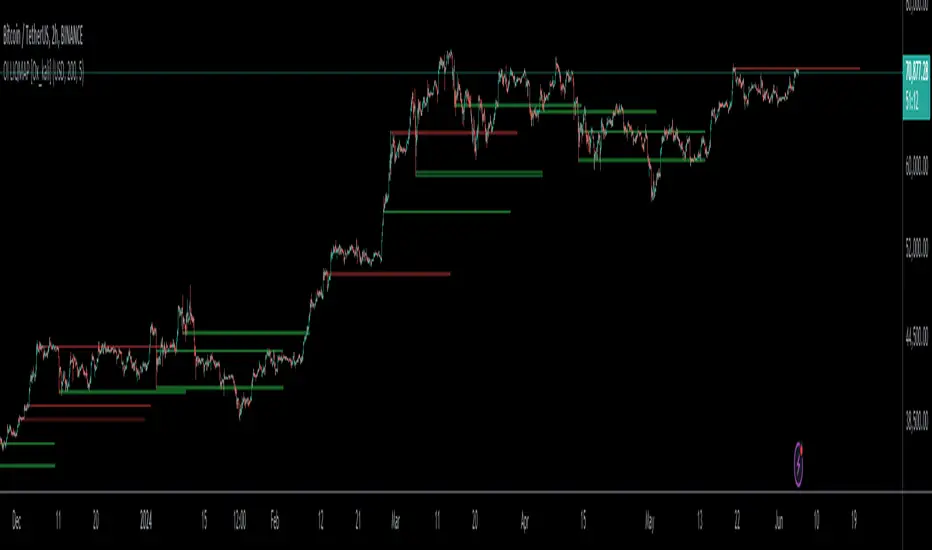
Time-Decay Liquidity Zones [BackQuant]Time-Decay Liquidity Zones
A dynamic liquidity map that turns single-bar exhaustion events into fading, color-graded zones, so you can see where trapped traders and unfinished business still matter, and when those areas have finally stopped pulling price.
What this is
This indicator detects unusually strong impulsive moves into wicks, converts them into supply or demand “zones,” then lets those zones decay over time. Each zone carries a strength score that fades bar by bar. Zones that stop attracting or rejecting price are gradually de-emphasized and eventually removed, while the most relevant areas stay bright and obvious.
Instead of static rectangles that live forever, you get a living liquidity map where:
Zones are born from objective criteria: volatility, wick size, and optional volume spikes.
Zones “age” using a configurable decay factor and maximum lifetime.
Zone color and opacity reflect current relative strength on a unified clear → green → red gradient.
Zones freeze when broken, so you can distinguish “active reaction areas” from “historical levels that have already given way”.
Conceptual idea
Large wicks with strong volatility often mark areas where aggressive orders met hidden liquidity and got absorbed. Price may revisit these areas to test leftover interest or to relieve trapped positions. However, not every wick matters for long. As time passes and more bars print, the market “forgets” some areas.
Time-Decay Liquidity Zones turns that idea into a rule-based system:
Find bars that likely reflect strong aggressive flows into liquidity.
Mark a zone around the wick using ATR-based thickness.
Assign a strength score of 1.0 at birth.
Each bar, reduce that score by a decay factor and remove zones that fall below a threshold or live too long.
Color all surviving zones from weak to strong using a single gradient scale and a visual legend.
How events are detected
Detection lives in the Event Detection group. The script combines range, wick size, and optional volume filters into simple rules.
Volatility filter
ATR Length — computes a rolling ATR over your chosen window. This is the volatility baseline.
Min range in ATRs — bar range (High–Low) must exceed this multiple of ATR for an event to be considered. This avoids tiny bars triggering zones.
Wick filters
For each bar, the script splits the candle into body and wicks:
Upper wick = High minus the max(Open, Close).
Lower wick = min(Open, Close) minus Low.
Then it tests:
Upper wick condition — upper wick must be larger than Min wick size in ATRs × ATR.
Lower wick condition — lower wick must be larger than Min wick size in ATRs × ATR.
Only bars with a sufficiently long wick relative to volatility qualify as candidate “liquidity events”.
Volume filter
Optionally, the script requires a volume spike:
Use volume filter — if enabled, volume must exceed a rolling volume SMA by a configurable multiplier.
Volume SMA length — period for the volume average.
Volume spike multiplier — how many times above the SMA current volume needs to be.
This lets you focus only on “heavy” tests of liquidity and ignore quiet bars.
Event types
Putting it together:
Upper event (potential supply / long liquidation, etc.)
Occurs when:
Upper wick is large in ATR terms.
Full bar range is large in ATR terms.
Volume is above the spike threshold (if enabled).
Lower event (potential demand / short liquidation, etc.)
Symmetric conditions using the lower wick.
How zones are constructed
Zone geometry lives in Zone Geometry .
When an event is detected, the script builds a rectangular box that anchors to the wick and extends in the appropriate direction by an ATR-based thickness.
For upper (supply-type) zones
Bottom of the zone = event bar high.
Top of the zone = event bar high + Zone thickness in ATRs × ATR.
The zone initially spans only the event bar on the x-axis, but is extended to the right as new bars appear while the zone is active.
For lower (demand-type) zones
Top of the zone = event bar low.
Bottom of the zone = event bar low − Zone thickness in ATRs × ATR.
Same extension logic: box starts on the event bar and grows rightward while alive.
The result is a band around the wick that scales with volatility. On high-ATR charts, zones are thicker. On calm charts, they are narrower and more precise.
Zone lifecycle, decay, and removal
All lifecycle logic is controlled by the Decay & Lifetime group.
Each zone carries:
Score — a floating-point “importance” measure, starting at 1.0 when created.
Direction — +1 for upper zones, −1 for lower zones.
Birth index — bar index at creation time.
Active flag — whether the zone is still considered unbroken and extendable.
1) Active vs broken
Each confirmed bar, the script checks:
For an upper zone , the zone is counted as “broken” when the close moves above the top of the zone.
For a lower zone , the zone is counted as “broken” when the close moves below the bottom of the zone.
When a zone breaks:
Its right edge is frozen at the previous bar (no further extension).
The zone remains on the chart, but is no longer updated by price interaction. It still decays in score until removal.
This lets you see where a major level was overrun, while naturally fading its influence over time.
2) Time decay
At each confirmed bar:
Score := Score × Score decay per bar .
A decay value close to 1.0 means very slow decay and long-lived zones.
Lower values (closer to 0.9) mean faster forgetting and more current-focused zones.
You are controlling how quickly the market “forgets” past events.
3) Age and score-based removal
Zones are removed when either:
Age in bars exceeds Max bars a zone can live .
This is a hard lifetime cap.
Score falls below Minimum score before removal .
This trims zones that have decayed into irrelevance even if their age is still within bounds.
When a zone is removed, its box is deleted and all associated state is freed to keep performance and visuals clean.
Unified gradient and color logic
Color control lives in Gradient & Color . The indicator uses a single continuous gradient for all zones, above and below price, so you can read strength at a glance without guessing what palette means what.
Base colors
You set:
Mid strength color (green) — used for mid-level strength zones and as the “anchor” in the gradient.
High strength color (red) — used for the strongest zones.
Max opacity — the maximum visual opacity for the solid part of the gradient. Lower values here mean more solid; higher values mean more transparent.
The script then defines three internal points:
Clear end — same as mid color, but with a high alpha (close to transparent).
Mid end — mid color at the strongest allowed opacity.
High end — high color at the strongest allowed opacity.
Strength normalization
Within each update:
The script finds the maximum score among all existing zones.
Each zone’s strength is computed as its score divided by this maximum.
Strength is clamped into .
This means a zone with strength 1.0 is currently the strongest zone on the chart. Other zones are colored relative to that.
Piecewise gradient
Color is assigned in two stages:
For strength between 0.0 and 0.5: interpolate from “clear” green to solid green.
Weak zones are barely visible, mid-strength zones appear as solid green.
For strength between 0.5 and 1.0: interpolate from solid green to solid red.
The strongest zones shift toward the red anchor, clearly separating them from everything else.
Strength scale legend
To make the gradient readable, the indicator draws a vertical legend on the right side of the chart:
About 15 cells from top (Strong) to bottom (Weak).
Each cell uses the same gradient function as the zones themselves.
Top cell is labeled “Strong”; bottom cell is labeled “Weak”.
This legend acts as a fixed reference so you can instantly map a zone’s color to its approximate strength rank.
What it plots
At a glance, the indicator produces:
Upper liquidity zones above price, built from large upper wick events.
Lower liquidity zones below price, built from large lower wick events.
All zones colored by relative strength using the same gradient.
Zones that freeze when price breaks them, then fade out via decay and removal.
A strength scale legend on the right to interpret the gradient.
There are no extra lines, labels, or clutter. The focus is the evolving structure of liquidity zones and their visual strength.
How to read the zones
Bright red / bright green zones
These are your current “major” liquidity areas. They have high scores relative to other zones and have not yet decayed. Expect meaningful reactions, absorption attempts, or spillover moves when price interacts with them.
Faded zones
Pale, nearly transparent zones are either old, decayed, or minor. They can still matter, but priority is lower. If these are in the middle of a long consolidation, they often become background noise.
Broken but still visible zones
Zones whose extension has stopped have been overrun by closing price. They show where a key level gave way. You can use them as context for regime shifts or failed attempts.
Absence of zones
A chart with few or no zones means that, under your current thresholds, there have not been strong enough liquidity events recently. Either tighten the filters or accept that recent price action has been relatively balanced.
Use cases
1) Intraday liquidity hunting
Run the indicator on lower timeframes (e.g., 1–15 minute) with moderately fast decay.
Use the upper zones as potential sell reaction areas, the lower zones as potential buy reaction areas.
Combine with order flow, CVD, or footprint tools to see whether price is absorbing or rejecting at each zone.
2) Swing trading context
Increase ATR length and range/wick multipliers to focus only on major spikes.
Set slower decay and higher max lifetime so zones persist across multiple sessions.
Use these zones as swing inflection areas for larger setups, for example anticipating re-tests after breakouts.
3) Stop placement and invalidation
For longs, place invalidation beyond a decaying lower zone rather than in the middle of noise.
For shorts, place invalidation beyond strong upper zones.
If price closes through a strong zone and it freezes, treat that as additional evidence your prior bias may be wrong.
4) Identifying trapped flows
Upper zones formed after violent spikes up that quickly fail can mark trapped longs.
Lower zones formed after violent spikes down that quickly reverse can mark trapped shorts.
Watching how price behaves on the next touch of those zones can hint at whether those participants are being rescued or squeezed.
Settings overview
Event Detection
Use volume filter — enable or disable the volume spike requirement.
Volume SMA length — rolling window for average volume.
Volume spike multiplier — how aggressive the volume spike filter is.
ATR length — period for ATR, used in all size comparisons.
Min wick size in ATRs — minimum wick size threshold.
Min range in ATRs — minimum bar range threshold.
Zone Geometry
Zone thickness in ATRs — vertical size of each liquidity zone, scaled by ATR.
Decay & Lifetime
Score decay per bar — multiplicative decay factor for each zone score per bar.
Max bars a zone can live — hard cap on lifetime.
Minimum score before removal — score cut-off at which zones are deleted.
Gradient & Color
Mid strength color (green) — base color for mid-level zones and the lower half of the gradient.
High strength color (red) — target color for the strongest zones.
Max opacity — controls the most solid end of the gradient (0 = fully solid, 100 = fully invisible).
Tuning guidance
Fast, session-only liquidity
Shorter ATR length (e.g., 20–50).
Higher wick and range multipliers to focus only on extreme events.
Decay per bar closer to 0.95–0.98 and moderate max lifetime.
Volume filter enabled with a decent multiplier (e.g., 1.5–2.0).
Slow, structural zones
Longer ATR length (e.g., 100+).
Moderate wick and range thresholds.
Decay per bar very close to 1.0 for slow fading.
Higher max lifetime and slightly higher min score threshold so only very weak zones disappear.
Noisy, high-volatility instruments
Increase wick and range ATR multipliers to avoid over-triggering.
Consider enabling the volume filter with stronger settings.
Keep decay moderate to avoid the chart getting overloaded with old zones.
Notes
This is a structural and contextual tool, not a complete trading system. It does not account for transaction costs, execution slippage, or your specific strategy rules. Use it to:
Highlight where liquidity has recently been tested hard.
Rank these areas by decaying strength.
Guide your attention when layering in separate entry signals, risk management, and higher-timeframe context.
Time-Decay Liquidity Zones is designed to keep your chart focused on where the market has most recently “cared” about price, and to gradually forget what no longer matters. Adjust the detection, geometry, decay, and gradient to fit your product and timeframe, and let the zones show you which parts of the tape still have unfinished business.

Liquidation Reversal Signals [AlgoAlpha]🟠 OVERVIEW
This tool detects potential liquidation-driven reversals by combining z-score analysis of up/down volume with the classic Supertrend. It watches for abnormal surges in directional volume (on a lower timeframe) and links them to trend flips on the main chart. When both align within a short window, it flags a probable reversal caused by forced liquidations. The goal is to help traders identify exhaustion points where aggressive liquidation moves may mark the end of a trend leg.
🟠 CONCEPTS
The logic revolves around Z-score normalization of up and down volume to locate statistical extremes. When up-volume z-scores exceed a threshold during a bearish Supertrend, it implies trapped shorts being squeezed; the opposite applies for long liquidations. The script tracks these liquidation spikes and monitors whether a Supertrend regime change follows soon after. If confirmed within the allowed timeout, a colored signal marks the event.
In essence:
Z-score outliers = potential forced liquidations.
Supertrend = structural regime context.
Combined = statistically confirmed reversal signals, not random flips.
This pairing reduces false positives by ensuring that both volatility structure and order-flow extremes agree before flagging a reversal.
🟠 FEATURES
Z-score detection for liquidation spikes with adjustable lookback and threshold.
Confirmation logic linking liquidations to Supertrend flips.
Alerts for liquidation spikes and confirmed reversal starts.
On-chart “No Volume” warning to avoid misreads on illiquid assets.
🟠 USAGE
Setup : Add the script to your main chart. Choose a lower timeframe (default 15m) to capture more granular liquidation flows. Adjust Z-Score Length to control how far back the script measures normal behavior and Threshold to decide what counts as extreme. Keep Timeout Bars low (e.g. 20–50) for faster reversals, or higher for slower markets.
Read the chart :
• Circles appear below bars when long liquidations occur; above bars for short liquidations.
• A Supertrend flip with a recent liquidation spike will display an arrow and color shift.
• Fills between candles and trend lines show which side dominates: green for bullish reversal, red for bearish.
• Candle color fades based on the magnitude of liquidation pressure.
Settings that matter :
• Z-Score Length : Longer smooths noise but delays signal; shorter reacts faster.
• Z-Score Threshold : Higher means only extreme liquidations trigger; lower finds smaller squeezes.
• Timeout Bars : Defines how long after a liquidation the Supertrend flip remains valid.
• Lower Timeframe : Determines the precision of volume readings; too low may increase noise.

Dynamic Liquidity HeatMap Profile [BigBeluga]🔵 OVERVIEW
The Dynamic Liquidity HeatMap Profile is a smart-flow liquidity tracker that maps where stop-loss clusters and resting limit orders are likely positioned.
Instead of traditional volume profiles based only on executed transactions, this tool projects probable liquidity pools — areas where traders are trapped or positioned and where smart money may hunt stops or fill orders.
It dynamically scans recent price swings, builds liquidity zones above and below price, and visualizes them as a heat map + histogram — highlighting areas with the greatest liquidity attraction.
Orange highlights the highest-concentration liquidity (POC), making potential sweep targets obvious.
🔵 CONCEPTS
Liquidity pools form above swing highs (buy stops) and below swing lows (sell stops).
Market makers & large players often push price into these zones to trigger stops and capture liquidity.
The indicator uses recent volatility + volume expansion to estimate where these pools exist.
Horizontal heat bars show depth and intensity of probable liquidity.
Profile side histogram displays buy-side vs sell-side liquidity distribution.
🔵 FEATURES
Dynamic Liquidity Detection — finds potential stop-loss clusters from recent swing behavior.
Dual-Side Heatmap — split liquidity view above (short stops) and below (long stops) current price.
Volume-Weighted Levels — higher volatility & volume = deeper liquidity expectation.
Real-Time Heat Coloring
• Lime = liquidity below price (potential buy-side fuel)
• Blue = liquidity above price (potential sell-side fuel)
• Orange = peak liquidity (POC)
Liquidity Profile Histogram — plotted at right side, layered by strength.
Auto-Cleaning Engine — removes invalidated liquidity after breaks.
Adjustable lookback window and bin resolution .
🔵 HOW TO USE
Look for price moving toward dense liquidity zones — high probability of wick raids or sweeps.
Orange POC often acts as magnet — strong target zone for smart money.
Combine with SFP / BOS logic to time reversals after liquidity hunts.
In trend, price repeatedly sweeps opposite-side liquidity before continuation.
Use liquidity walls as bias filters — heavy liquidity above often precedes downward move, and vice-versa.
Great for scalping sessions, indices, FX, BTC, ETH.
🔵 CONCLUSION
The Dynamic Liquidity HeatMap Profile gives traders a tactical edge by revealing where the market’s hidden liquidity resides.
It highlights where shorts and longs are positioned, identifies likely sweep zones, and marks the most attractive liquidity magnet (POC).
Use it to anticipate stop hunts, avoid getting trapped, and align with smart-money flow instead of fighting it.

CNagda-MomentumX - Institutional FlowMomentumX is designed to empower traders with a deeper understanding of market movements by focusing on Institutional Flow and advanced market structure analytics. The core goal is to identify and visualize where major market participants are operating, and to translate these complex footprints into clear, actionable trading signals — all in real time.
Real-time institutional activity mapping
Actionable entry and exit signals based on live market structure
Intuitive dashboard and dynamic chart visuals
Fully customizable modules for trend, liquidity, and order blocks
Core Logic Design
At the heart of MomentumX lies a robust algorithmic engine built to capture and surface institutional trading behavior. By leveraging advanced mathematical models, the indicator calculates institutional volume ratios and price momentum to pinpoint aggressive moves from large participants.
Institutional Volume & Price Momentum:
Utilizes custom volume indicators and price change analysis to detect strong buying or selling pressure, filtering out retail noise.
Liquidity Grab Detection & Activity Zones:
The script identifies liquidity grabs by monitoring abrupt price sweeps at major support/resistance levels—often where institutions trigger stop hunts or reversals. All critical activity zones are automatically color-coded on the chart for instant recognition.
Dashboard Visualization:
A fully dynamic dashboard table overlays live scores for accumulation, distribution, strength, and weakness—giving traders a real-time scan of market health.
Trendline & Order Block Architecture:
The logic auto-detects pivot highs/lows to draw smart trendlines, while the order block system highlights key reversal areas and breaker zones—making market structure clear and actionable.
MomentumX is packed with high-performance modules, each engineered to simplify complex market behavior and enhance decision-making for traders:
Institutional Flow Signals:
Instantly identifies spots where institutional players drive momentum, using unique volume and price activity analytics.
Bullish/Bearish Liquidity Grab Detection:
Marks abrupt price moves that signal stop hunts or reversals, letting traders anticipate snap-backs or trend shifts.
Trendline Auto-Detection:
Smartly draws trendlines based on significant swing highs and lows, automatically adjusting as price evolves.
Order Block System (Rejection/Breaker):
Spots and highlights key reversal zones with order block rectangles, confirming rejections or breakouts at strategic levels.
Dashboard and Bar Coloring:
A clean dashboard overlay presents live market scores, while dynamic bar coloring makes trend, strength, and high-activity periods instantly visible.
User Input Toggles for Each Module:
Every major feature is fully customizable—enable or disable modules to match individual trading setups or preferences.
Scripting/Development
MomentumX’s scripting process is modular, enabling clarity, scalability, and fast optimization throughout development:
Initialization & Inputs:
Start by defining all user input options, module toggles, color settings, and calculation parameters—ensuring maximum flexibility early on.
Core Calculation Functions:
Script advanced institutional volume and price momentum algorithms. Build out swing length logic, market state filters, and activity scoring methods.
Detection Engines:
Develop and integrate engines for liquidity grabs, automated trendline detection, and order block identification—each with dedicated functions for speed and precision.
Visual Overlays & Plotting:
Implement powerful plotting logic for colored bars, score dashboards, trendlines, reversal zones, and liquidity markers—making every data point clear and actionable on the chart.
Testing Handlers:
Add diagnostic panels and debug outputs to refine calculations and assure accuracy in every market environment.
Sample Trade Setups (Usage)
Cnagda MomentumX delivers clarity for multiple trading styles by providing timely, actionable setups grounded in institutional behavior and market structure. Here’s how traders can leverage the indicator for confident decision-making:
Liquidity Grab Reversal
Enter trades around detected liquidity grabs when price sweeps major support/resistance and the dashboard signals a momentum shift.
Example: Wait for a bullish/Bearish grab near market lows/high, with institutional flow turning positive/negative—enter long/short for potential mean reversion.
Order Block Breakout
Trade breakouts when price cleanly rejects or flips key order block zones highlighted on the chart.
Example: Short at a marked breaker block after a rejection signal, confirmed by a downward institutional activity spike.
Trendline Continuation
Ride established market moves by entering on trendline confirmations plotted by the auto-detect system.
Example: Go long after a trendline retest, confirmed by a green bar color and dashboard strength score.
Dashboard Confirmation
Combine dashboard metrics (strength, accumulation, distribution) with bar color overlays for multi-factor entries.
Example: Enter trades only when all market signals align in real time for maximum probability.
For Short Entry check -- Weakness : For Long Entry Check - Strength With Other Indications
MomentumX is not just another indicator – it’s your edge for reading the market like an insider. By transparently mapping institutional flow, uncovering hidden liquidity zones, and color-coding every major structure shift, MomentumX transforms complexity into actionable clarity. Whether you’re scalping, swing trading, or investing, you’ll gain a decisive, real-time advantage on every chart.
Embrace smarter decisions, adapt to changing market conditions instantly, and join a new generation of technically empowered traders.
Customize, observe, and let the market reveal opportunities in a way you’ve never experienced before.
Happy Trading

Cnagda Trading ToolCnagda Trading Tools - complete set of intraday trading
1. Trendline breakout based On ATR.
2. Live RSI, volume/candle average 20 Periods, trend direction last 34 periods, and some useful dashboard features.
3. Ma Scalp Line provide trend support and resistance + Where Line More Flat Previous Time You Also Use That Range As Support And Resistance
4. RSI based POC ( Point Of Control) indicate high Volume Area like fixed Range Volume profile
5. London session breakout with buy/sell Signal and NewYork session opening half hour range breakout with Buy/sell signal
Ma Scalp Buy And Sell Signal For Short term Scalping ( 5 Min Timeframe) Based on Ema And Wma Crossover
I hope these tools will improve your trading, but you should trade only after proper research, this indicator is not responsible for any loss.

Leveraged Liquidation ZonesOVERVIEW
This indicator estimates potential liquidation zones based on leveraged positions (25x, 50x, 75x, 100x). It visually displays upper and lower bounds for each leverage tier, allowing traders to infer areas where the market might be seeking liquidity.
CONCEPTS
In leveraged markets, especially crypto derivatives, price often moves towards zones of high liquidation potential — areas where traders using high leverage are likely to be stopped out. These zones represent concentrations of liquidity that can serve as targets for price movement.
This script models simplified liquidation areas by calculating the price range within which positions using specific leverage levels would be at risk, assuming no maintenance margin and using the previous candle close as a reference.
FEATURES
Visual zones for 25x, 50x, 75x, and 100x leverage levels.
Customizable visibility and colors for each leverage tier.
Real-time zone calculation based on the previous candle close.
Simple and clean design to overlay directly on price action.
USAGE
Use this tool to identify areas of liquidity accumulation or potential price magnet zones. High-leverage liquidations often lead to volatile movements when triggered, so tracking these zones can help anticipate breakout or reversal behavior.
You can toggle individual leverage levels via the settings panel, and adjust color transparency to suit your chart theme. This tool is most effective when combined with volume spikes, order book analysis, or high-frequency behavior.

Liquidity Hunter HeatmapLiquidity Hunter (GPS Companion Tool)
Liquidity Hunter is a specialized script designed to help traders visualize and track potential liquidation zones, clusters, and imbalance traps in real-time. It is particularly useful for scalpers and short-term traders who rely on liquidity sweeps, stop hunts, and reversion plays.
This tool does not replicate open-source liquidation trackers. Instead, it uses a proprietary combination of volume surges, candle displacement, VWAP deviation, and high-timeframe wicks to infer areas of trapped traders and display them with clear, color-coded markers.
Key Features:
• Real-Time Liquidation Estimates: Detects where major stop losses (and potential liquidations) may have occurred, based on proprietary volume + price action logic.
• Cluster Strength Bubbles: Visual bubbles (scaled by cluster size) show where liquidations are stacking. Purple for bearish, white for bullish — intensity reflects strength.
• Pre-Liquidation Warning Zones: Highlights areas where price is likely to sweep liquidity before reversing, helping traders avoid chasing moves.
• Dollar-Based Labels (Optional): Displays the estimated value liquidated, helping traders size the significance of a move (e.g., $8.4M).
• Minimal Clutter Mode: Designed for intraday clarity — hides excess lines and uses bubbles, not shapes, for cleaner visualization.

Liqudation HeatMap [BigBeluga]🔵 OVERVIEW
An advanced liquidity visualization tool that plots horizontal heat zones to highlight where potential liquidations and volume clusters are most likely hiding beneath price action.
Liqudation HeatMap scans historical price movements for local highs and lows with elevated volume or candle range. It then draws dynamic heatmap boxes—shaded from lime (low interest) to yellow (high interest)—revealing potential zones of trapped positions or stop clusters. A vertical scale on the right shows you the relative strength of volume behind each level, from 0 to the highest detected.
🔵 CONCEPTS
Maps areas of potential liquidity using volume or candle range (if volume is unavailable).
Identifies swing highs/lows (pivots) and extends heatmap boxes outward from these levels. Colors each zone based on the relative strength of volume concentration.
Fades or removes zones once price crosses their midpoints, simulating the idea of liquidity being “consumed.”
Displays a live vertical scale that shows the volume range for quick reference.
🔵 FEATURES
Dynamic Heatmap Zones:
Draws few boxes above and after pivot highs and below pivot lows, each shaded based on volume concentration.
Smart Coloring System:
Uses a gradient from lime (low) to yellow (high) to visually distinguish between weak and strong liquidity zones.
Adaptive ATR Widths:
Automatically adjusts zone thickness based on volatility (ATR), scaling intelligently across timeframes.
Liquidity Consumption Logic:
Zones are stope extending once price interacts with them—mimicking the behavior of real liquidation sweeps.
Volume Scale Legend:
A real-time scale is plotted on the right side, showing the min-max range of volume used for heat calculations.
🔵 HOW TO USE
Look for thick yellow zones to identify areas of concentrated stop losses or liquidation triggers.
Use these levels to anticipate mean reversion points or high-volatility zones.
Combine with your trend or structure tools to trade into or fade these liquidity pools.
On lower timeframes, use this tool to confirm entries around sweeps or deviations.
Use the right-side scale to compare relative zone strength instantly.
🔵 CONCLUSION
Liqudation HeatMap is a powerful visualization tool that uncovers where liquidity likely resides on the chart. By highlighting hidden traps and reactive levels in real-time, it gives traders a significant edge when it comes to spotting stop hunts, mean reversions, and areas of institutional interest. Whether you’re scalping or swing trading, this heatmap provides unmatched context on the market’s hidden intent.

Liquidity Location Detector [BigBeluga]
This indicator helps traders identify potential liquidity zones by detecting significant volume levels at key highs and lows. By using color intensity and scoring numbers, it visually highlights areas where liquidity concentration may be highest while incorporating trend analysis through EMAs.
🔵Key Features:
Liquidity Zone Detection: Automatically detects and marks areas where significant volume has accumulated at swing highs and lows.
Dynamic Box Plotting: Draws liquidity boxes at key highs and lows, updating based on market conditions.
Volume Strength Scaling: Uses a scoring system to rank liquidity zones, helping traders identify the strongest areas.
Color Intensity for Volume Strength: More transperent color indicate less liquidity, while less transperent represent stronger volume concentrations.
Customizable Display: Users can adjust the number of displayed liquidity zones and modify colors to suit their trading style.
Real-Time Liquidity Adaptation: As price interacts with liquidity zones, the indicator updates dynamically to reflect changing market conditions.
Auto-Stopping Liquidity Zones: Liquidity boxes automatically stop extending to the right once price crosses them, preventing outdated zones from interfering with live market action.
Trend Analysis with EMAs: Includes two optional EMAs (fast and slow) to help traders analyze market trends. Users can enable or disable these EMAs in the settings and use crossover signals for trend confirmation.
🔵Usage:
Identify Key Liquidity Areas: Use color intensity and transparency levels to determine high-impact liquidity zones.
Support & Resistance Confirmation: Liquidity zones can act as potential support and resistance levels, enhancing trade decision-making.
Market Structure Analysis: Observe how price interacts with liquidity to anticipate breakout or reversal points.
Scalping & Swing Trading: Works for both short-term and long-term traders looking for liquidity-based trade setups.
Liquidation Map Insight: A liquidity map highlights areas where large amounts of leveraged positions (both long and short) are likely to get liquidated. Since many traders use leverage, sharp price movements can trigger a cascade of liquidations, leading to rapid price surges or drops. Monitoring these liquidity zones and trends helps traders anticipate where price might react strongly.
Liquidity Location Detector is an essential tool for traders seeking to map out potential liquidity zones, providing deeper insights into market structure and trading volume dynamics.

Liquidations Levels [RunRox]📈 Liquidation Levels is an indicator designed to visualize key price levels on the chart, highlighting potential reversal points where liquidity may trigger significant price movements.
Liquidity is essential in trading - price action consistently moves from one liquidity area to another. We’ve created this free indicator to help traders easily identify and visualize these liquidity zones on their charts.
📌 HOW IT WORKS
The indicator works by marking visible highs and lows, points widely recognized by traders. Because many traders commonly place their stop-loss orders beyond these visible extremes, significant liquidity accumulates behind these points. By analyzing trading volume and visible extremes, the indicator estimates areas where clusters of stop-loss orders (liquidity pools) are likely positioned, giving traders valuable insights into potential market moves.
As shown in the screenshot above, the price aggressively moved toward Sell-Side liquidity. After sweeping this liquidity level for the second time, it reversed and began targeting Buy-Side liquidity. This clearly demonstrates how price moves from one liquidity pool to another, continually seeking out liquidity to fuel its next directional move.
As shown in the screenshot, price levels with fewer anticipated trader stop-losses are indicated by less vibrant, faded colors. When the lines become more saturated and vivid, it signals that sufficient liquidity - in the form of clustered stop-losses has accumulated, potentially attracting price movement toward these areas.
⚙️ SETTINGS
🔹 Period – Increasing this setting makes the marked highs and lows more significant, filtering out minor price swings.
🔹 Low Volume – Select the color displayed for low-liquidity levels.
🔹 High Volume – Select the color displayed for high-liquidity levels.
🔹 Levels to Display – Choose between 1 and 15 nearest liquidity levels to be shown on the chart.
🔹 Volume Sensitivity – Adjust the sensitivity of the indicator to volume data on the chart.
🔹 Show Volume – Enable or disable the display of volume values next to each liquidity level.
🔹 Max Age – Limits displayed liquidity levels to those not older than the specified number of bars.
✅ HOW TO USE
One method of using this indicator is demonstrated in the screenshot above.
Price reached a high-liquidity level and showed an initial reaction. We then waited for a second confirmation - a liquidity sweep followed by a clear market structure break - to enter the trade.
Our target is set at the liquidity accumulated below, with the stop-loss placed behind the manipulation high responsible for the liquidity sweep.
By following this approach, you can effectively identify trading opportunities using this indicator.
🔶 We’ve made every effort to create an indicator that’s as simple and user-friendly as possible. We’ll continue to improve and enhance it based on your feedback and suggestions in the future.

Open Interest liquidation map [Ox_kali]This script is inspired by @LeviathanCapital work on aggregating Open Interest , as presented in the Open Interest Suite Aggregated script. This script aims to provide a liquidation map of Open Interest by identifying significant anomalies across multiple trading platforms. By integrating data from Binance, BitMEX, and Kraken, this script tries to offer a comprehensive and detailed view of Open Interest movements and attempts to define zones of interest.
Key Points
1. Multiple Data Sources : The script retrieves Open Interest data from several trading platforms, including Binance (USDT, USD, BUSD), BitMEX (USD, USDT), and Kraken (USD).
2. Anomaly Detection : Utilizes a simple moving average (SMA) to calculate the average size of Open Interest candles and identify anomalies based on a user-specified size factor.
3. Background Coloring : Offers an option to color the background of the charts based on detected anomalies, allowing for clear visualization of significant movements.
4. Dynamic Support and Resistance Zones : Defines and dynamically updates support and resistance zones based on Open Interest anomalies.
5. Alerts : Configures alerts to notify the user when an Open Interest anomaly is detected.
Trading Utility
This script can be useful for monitoring significant changes in Open Interest and potential liquidation zones across multiple platforms. The main trading applications include:
1. Identifying Liquidation Points : By detecting Open Interest anomalies, it is possible to identify potential liquidation points where significant price movements might occur.
2. Multi-Platform Analysis : By aggregating Open Interest data from multiple platforms, a more comprehensive market overview is obtained.
3. Detecting Support and Resistance Zones : Dynamic support and resistance zones help identify key price levels where trend reversals might occur.
4. Customized Alerts: Anomaly alerts allow for automated responses to market changes.
Conclusion
The “Open Interest liquidation map ” script is an experimental tool for analyzing Open Interest across multiple trading platforms. Inspired by Leviathan’s work, this script attempts to identify liquidation and interest zones. This is an experimental version, and I welcome any comments and feedback for improvement.
Please note that the Open Interest liquidation map is not a guarantee of future market performance and should be used in conjunction with proper risk management. Always ensure that you have a thorough understanding of the indicator’s methodology and its limitations before making any investment decisions. Additionally, past performance is not indicative of future results.
Liquidations [ChartPrime]Liquidations Indicator:
The Liquidations indicator is a powerful tool designed to help traders identify significant liquidation levels in financial markets. By analyzing volume data over a specified lookback period, the indicator highlights potential areas where market participants with high leverage positions may face liquidation, providing valuable insights into market dynamics.
Usage:
Traders can use the Liquidations indicator to:
◈ Identify liquidity grab opportunities: Liquidation levels often attract price action as market participants with leveraged positions face the risk of forced liquidation. Traders can anticipate price movements as the market aims to trigger these stops, potentially leading to rapid price movements or reversals.
◈ Confirm trend strength: A cluster of liquidation levels in the same direction as the prevailing trend may confirm the strength of the trend, while divergences between liquidation levels and price movements may signal potential trend reversals.
Settings:
◈ Previous Value Bars Back: Specifies the number of previous bars used in calculating the liquidation levels.
◈ Show Leverage: Allows users to selectively display liquidation levels for different leverage multiples, including 5x, 10x, 25x, 50x, and 100x.
◈ Liquidation Levels Width: Sets the width of the lines representing liquidation levels on the chart.
◈ Short Liquidations Color: Specifies the color of the lines representing short liquidation levels.
◈ Long Liquidations Color: Specifies the color of the lines representing long liquidation levels.
◈ Bar Color: Sets the color of the background bar when the indicator is active.
Visual Representation:
◈ Liquidation levels are plotted as horizontal lines on the chart, with different colors representing short and long liquidation levels.
◈ Each liquidation level is labeled with the corresponding leverage multiple (e.g., 5x, 10x, etc.).
A dashboard displays the active liquidation levels for each leverage multiple, allowing traders to quickly assess the current market conditions.
◈ Time Window allows users to cut off unnecessary part of the chart and concentrate on a current active part of the chart to make better trading decisions:
Interpretation:
Market participants tend to place stop-loss orders near liquidation levels , creating clusters of pending orders. As price approaches these levels, it may trigger a cascade of stop-loss orders, providing liquidity for market orders and potentially leading to rapid price movements in the opposite direction.
Traders can anticipate price reversals or accelerations as price interacts with liquidation levels, using them as reference points for identifying potential entry or exit opportunities.
Note:
While the Liquidations indicator provides valuable insights into market dynamics, traders should use it in conjunction with other technical analysis tools and risk management strategies to make informed trading decisions.

Unmitigated Liquidity Imbalances [AlgoAlpha]🎉 Introducing the Unmitigated Liquidity Imbalance Indicator by AlgoAlpha! 🎉
Dive into the depths of market analytics with our "Unmitigated Liquidity Imbalance" indicator. This tool harnesses unique algorithms to detect liquidity imbalances between bulls and bears, helping traders spot trends and potential entry and exit points with greater accuracy. 📈🚀
🔍 Key Features:
🌟 Advanced Analysis : Analyses candle direction and length to forecast market peaks and valleys.
🎨 Customizable Visuals : Tailor the chart with your choice of bullish green or bearish red to reflect different market conditions.
🔄 Real-Time Updates : Continuously updates to reflect live market changes.
🔔 Configurable Alerts : Set up alerts for key trading signals such as bullish and bearish reversals, as well as trend shifts.
📐 How to Use:
🛠 Add the Indicator : Add the indicator to your favourites and customize the settings to suite your needs.
📊 Market Analysis : Monitor the oscillator threshold; readings above 0.5 suggest bullish sentiment, while below 0.5 indicate bearish conditions. And reversal signals are displayed to show potential entry points.
🔔 Set Alerts : Enable notifications for reversal conditions or trend changes to seize trading opportunities without constant chart watching.
🧠 How It Works:
The core mechanism of the indicator is based on detecting changes in candlestick size and direction to identify bullish and bearish liquidity levels from the peak & valley indicator's logic. By comparing the length of a current candle to the previous one and checking the change in direction, it pinpoints moments where market sentiment could be shifting, indicating if the liquidity at that point is bullish or bearish. The script then looks at what percentage of the past few unmitigated levels are bullish or bearish based on a customizable lookback and determines the liquidity imbalance which can then be interpreted as trend.
Empower your trading with the Unmitigated Liquidity Imbalance indicator and navigate the markets with confidence and precision. 🌟💹
Happy trading, and may your charts be ever in your favour! 🥳✨
💎 Related Indicator

Crypto Liquidation Heatmap [LuxAlgo]The Crypto Liquidation Heatmap tool offers real-time insights into the liquidations of the top cryptocurrencies by market capitalization, presenting the current state of the market in a visually accessible format. Assets are sorted in descending order, with those experiencing the highest liquidation values placed at the top of the heatmap.
Additional details, such as the breakdown of long and short liquidation values and the current price of each asset, can be accessed by hovering over individual boxes.
🔶 USAGE
The crypto liquidation heatmap tool provides real-time insights into liquidations across all timeframes for the top 29 cryptocurrencies by market capitalization. The assets are visually represented in descending order, prioritizing assets with the highest liquidation values at the top of the heatmap.
Different colors are used to indicate whether long or short liquidations are dominant for each asset. Green boxes indicate that long liquidations surpass short liquidations, while red boxes indicate the opposite, with short liquidations exceeding long liquidations.
Hovering over each box provides additional details, such as the current price of the asset, the breakdown of long and short liquidation values, and the duration for the calculated liquidation values.
🔶 DETAILS
🔹Crypto Liquidation
Crypto liquidation refers to the process of forcibly closing a trader's positions in the cryptocurrency market. It occurs when a trader's margin account can no longer support their open positions due to significant losses or a lack of sufficient margin to meet the maintenance requirements. Liquidations can be categorized as either a long liquidation or a short liquidation.
A long liquidation occurs when long positions are being liquidated, typically due to a sudden drop in the price of the asset being traded. Traders who were bullish on the asset and had opened long positions will face losses as the market moves against them.
On the other hand, a short liquidation occurs when short positions are being liquidated, often triggered by a sudden spike in the price of the asset. Traders who were bearish on the asset and had opened short positions will face losses as the market moves against them.
🔹Liquidation Data
It's worth noting that liquidation data is not readily available on TradingView. However, we recognize the close correlation between liquidation data, trading volumes, and asset price movements. Therefore, this script analyzes accessible data sources, extracts necessary information, and offers an educated estimation of liquidation data. It's important to emphasize that the presented data doesn't reflect precise quantitative values of liquidations. Traders and analysts should instead focus on observing changes over time and identifying correlations between liquidation data and price movements.
🔶 SETTINGS
🔹Cryptocurrency Asset List
It is highly recommended to select instruments from the same exchange with the same currency to maintain proportional integrity among the chosen assets, as different exchanges may have varying trading volumes.
Supported currencies include USD, USDT, USDC, USDP, and USDD. Remember to use the same currency when selecting assets.
List of Crypto Assets: The default options feature the top 29 cryptocurrencies by market capitalization, currently listed on the Binance Exchange. Please note that only crypto assets are supported; any other asset type will not be processed or displayed. To maximize the utility of this tool, it is crucial to heed the warning message displayed above.
🔹Liquidation Heatmap Settings
Position: Specifies the placement of the liquidation heatmap on the chart.
Size: Determines the size of the liquidation heatmap displayed on the chart.
🔶 RELATED SCRIPTS
Liquidations-Meter
Liquidation-Estimates
Liquidation-Levels

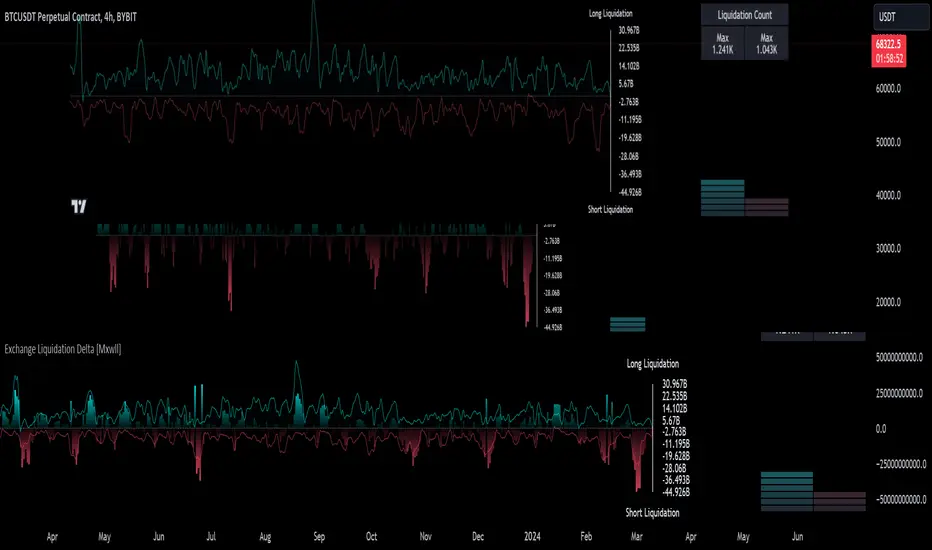
Genuine Liquidation Delta [Mxwll] - No EstimatesTHANK YOU TradingView for allowing us to upload custom data!!!
As a result, Mxwll Capital is providing an indicator that shows REAL liquidation delta for over 100 cryptocurrencies sourced directly from a popular crypto exchange!
Features
Crypto exchange sourced liquidation delta
Crypto exchange sourced long liquidation daily count
Crypto exchange sourced short liquidation daily count
All provided data extends back 2 years!!
Various aesthetic components to illustrate data
Liquidation delta data (sourced from a popular exchange) is provided for:
1000shib
aave
ada
algo
alice
arb
audio
alpha
ankr
ape
apt
atom
avax
axs
bal
band
bat
bch
bel
blz
blur
bnb
bnx
btc
chr
chz
comp
coti
crv
ctk
dash
defi
doge
dot
dydx
edu
egld
enj
ens
eos
etc
eth
fil
flm
ftm
fxs
gala
gmx
grt
hbar
hnt
icx
id
inj
iost
iota
joe
kava
knc
ksm
ldo
lina
link
lit
lrc
ltc
mana
mask
matic
mkr
near
neo
ocean
omg
one
ont
op
people
qtum
reef
ren
rndr
rose
rlc
rsr
rune
rvn
sand
sfp
skl
snx
sol
stmx
storj
sui
sushi
sxp
theta
tomo
trb
trx
unfi
uni
vet
waves
xem
xlm
xmr
xrp
xtz
yfi
zec
zen
zil
zrx
How-To
The image above shows the indicator with default settings.
The image above shows the start point of our data!
Over 2-years of data, allowing for plentiful analysis!
The image above explains the primary plot.
Filled blue columns reflect liquidation delta exceeding the long side. When the liquidation delta plot is aqua and exceeds 0 to the upside, longs were liquidated more than shorts for the
day.
Filled red columns reflect liquidation delta exceeding the short side. When the liquidation delta plot is red and exceeds 0 to the downside, shorts were liquidated more than longs for the day.
The image above explains the solid line (polyline) plot and its intentions!
Filled, solid, blue line reflects the total number of long liquidation events for the period.
Filled, solid, red line reflects the total number of short liquidation events for the period.
Keep in mind that the total number of liquidation events is normalized to plot alongside the total liquidation delta for the day. So, there aren't "millions" of liquidation events taking place, the total liquidation count for the long and short side is simply normalized to fit atop total liquidation delta.
The image above explains the liquidation count meter the indicator provides!
The left (blue columns) reflect the intensity of long liquidation events for the day. The right (red columns) reflect the intensity of short liquidation events for the day.
The "Max" numbers at the top show the maximum number of long liquidation events, or short liquidation events, for their respective columns.
Therefore, if the number of long liquidation events were "1.241k", as stated for this cryptocurrency in the table, the blue meter would be full. Similar logic applies to the red meter.
Once more, THANK YOU @TradingView and @PineCoders for allowing us to upload custom data! This project wouldn't be possible without it!
Liquidity Finder🔵 Introduction
The concept of "liquidity pool" or simply "liquidity" in technical analysis price action refers to areas on the price chart where stop losses accumulate, and the market, by reaching those areas and collecting liquidity (Stop Hunt), provides the necessary energy to move the price. This concept is prominent in the "ICT" and "Smart Money" styles. Imagine, as depicted below, the price is at a support level. The general trader mentality is that there is "demand" for the asset at this price level, and this demand will outweigh "supply" as before. So, it is likely that the price will increase. As a result, they start buying and place their stop loss below the support area.
Stop Hunt areas are essentially traders' "stop loss" levels. These are the liquidity that institutional and large traders need to fill their orders. Consequently, they penetrate the price below support areas or above resistance areas to touch their stop loss and fill their orders, and then the price trend reverses.
Cash zones are generally located under "Swings Low" and above "Swings High." More specifically, they can be categorized as support levels or resistance levels, above Double Top and Triple Top patterns, below Double Bottom and Triple Bottom patterns, above Bearish Trend lines, and below Bullish Trend lines.
Double Top and Triple Top :
Double Bottom and Triple Bottom :
Bullish Trend line and Bearish Trend line :
🔵 How to Use
To optimally use this indicator, you can adjust the settings according to the symbol, time frame, and your needs. These settings include the "sensitivity" of the "liquidity finder" function and the swing periods related to static and dynamic liquidity lines.
"Statics Liquidity Line Sensitivity" is a number between 0 and 0.4. Increasing this number decreases the sensitivity of the "Statics Liquidity Line Detection" function and increases the number of lines identified. The default value is 0.3.
"Dynamics Liquidity Line Sensitivity" is a number between 0.4 and 1.95. Increasing this number increases the sensitivity of the "Dynamics Liquidity Line Detection" function and decreases the number of lines identified. The default value is 1.
"Statics Period Pivot" is set to 8 by default. By changing this number, you can specify the period for the static liquidity line pivots.
"Dynamics Period Pivot" is set to 3 by default. By changing this number, you can specify the period for the dynamic liquidity line pivots.
🔵 Settings
Access to adjust the inputs of Static Dynamic Liquidity Line Sensitivity, Dynamics Liquidity Line Sensitivity, Statics Period Pivot, and Dynamics Period Pivot is possible from this section.
Additionally, you can enable or disable liquidity lines as needed using the buttons for "Show Statics High Liquidity Line," "Show Statics Low Liquidity Line," "Show Dynamics High Liquidity Line," and "Show Dynamics Low Liquidity Line."

Liquidation Levels with Liquidity Sweeps/Breakouts [AlgoAlpha]🌊📈 Dive into the depths of market liquidity with "Liquidation Levels with Liquidity Sweeps/Breakouts" - your ultimate tool for navigating the turbulent waters of trading! 🧹💹 Crafted by the wizards at AlgoAlpha, this Pine Script™ masterpiece illuminates the unseen liquidity levels and sweeps, guiding you through the financial seas with insight. 🚀🔍
Key Features:
🕒 Timeframe Flexibility: Customize your analysis with a TimeFrame Multiplier, allowing the indicator to operate on higher timeframes for broader market insight.
💥 Dynamic Volume Threshold: Set your sensitivity to breakouts with the High Volume Threshold, ensuring you catch significant market movements while avoiding fakeouts.
👀 Visibility Controls: Toggle the display of swept liquidity and highlight liquidity breakouts with customizable background colors for clear, actionable insights.
🎨 Custom Appearance: Personalize your chart with bullish, bearish, and breakout colors to match your trading style.
How to Use the Liquidity Levels with Liquidation Sweeps Indicator:
Maximize your trading efficiency with the Liquidity Levels with Liquidation Sweeps Indicator by following these simple steps! 🚀🌟
⚙️ Customize Settings: Access the indicator settings to personalize the TimeFrame Multiplier, High Volume Threshold, and Relative Volume Period. Tailor these settings to match your trading strategy and chart preferences.
👁️ Analyze Liquidity Levels: Monitor the chart for liquidity levels and sweeps. Bullish sweeps are marked with green labels, bearish sweeps with red, and breakouts highlighted by the chart background.
🔔 Set Alerts: Enable alert conditions for liquidity breakouts and sweeps within the indicator's settings. This feature allows you to receive real-time notifications, helping you to act promptly on trading opportunities.
How It Works:
The heart of this indicator lies in its ability to track and highlight liquidity levels derived from swing pivots, and sweeps across multiple timeframes. By calculating relative volume against a user-defined threshold, it identifies strong volume movements indicative of liquidity breakouts, this helps filter out fake-outs. When a liquidity level is breached but not completely mitigated, it's either marked as a bullish or bearish sweep, which come with the option to show an estimate of the number of liquidations during the sweep.
if peakform and peakprinted != 1
aR.push(line.new(bar_index-mult, h.get(1), bar_index+1, h.get(1), color = red))
aRv.push(h.get(1))
peakprinted := 1
if valleyform and valleyprinted != 1
aS.push(line.new(bar_index-mult, l.get(1), bar_index+1, l.get(1), color = green))
aSv.push(l.get(1))
valleyprinted := 1

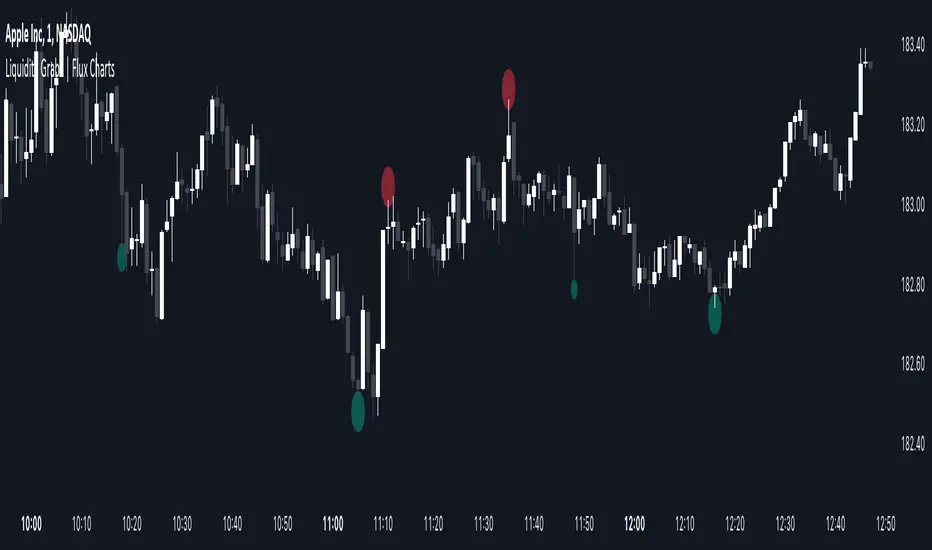
Liquidity Grabs | Flux Charts💎 GENERAL OVERVIEW
Introducing our new Liquidity Grabs indicator! This indicator can renders bubbles with different sizes at candles that have liquidity grabs, which happen when a liquidity areas (buyside / sellside liquidity) is swept. These candles often fill a lot of market orders that were sitting on the liquidity zone. You can check "How Does It Work" section for more information.
Features of the new Liquidity Grabs Indicator :
Renders Liquidity Grabs
Customizable Algorithm
Customizable Styles
Alerts
🚩UNIQUENESS
Liquidity grabs can be useful when determining candles that have executed a lot of market orders, and planning your trades accordingly. This indicator renders liquidity grabs in an unique bubble style, the size of the bubble is calculated by the size of the wick that caused the liquidity grab. The indicator also lets you customize the pivot length and the wick-body ratio for liquidity grabs.
📌 HOW DOES IT WORK ?
Liquidity grabs occur when one of the latest pivots has a false breakout. Then, if the wick to body ratio of the bar is higher than 0.5 (can be changed from the settings) a bubble is plotted. Using the wick length as a metric to measure liquidity is good because long wicks can translate to a large amount of buyers / sellers entering the market.
The bubble size is determined by the wick to body ratio of the candle.
⚙️SETTINGS
1. General Configuration
Pivot Length -> This setting determines the range of the pivots. This means a candle has to have the highest / lowest wick of the previous X bars and the next X bars to become a high / low pivot.
Wick-Body Ratio -> After a pivot has a false breakout, the wick-body ratio of the latest candle is tested. The resulting ratio must be higher than this setting for it to be considered as a liquidity grab.
Liquidation Longs/Shorts [UAlgo]🔶Description:
The "Liquidation Longs/Shorts " indicator is designed to identify potential liquidation levels for long and short positions. It calculates the distance of the selected price source (close, high, low, or open) from two moving averages (MA) and plots the resulting values on the chart. When the price is at an extreme distance from the moving averages, it suggests a potential liquidation point for either long or short positions.
🔶Key Features:
Liquidation Calculations: The indicator calculates the distance of the selected price source from two moving averages: a simple moving average (SMA) and an exponential moving average (EMA) with customizable lengths.
Color Customization: Users can customize the colors of the plotted columns representing the distance from the moving averages for long and short liquidation levels.
Liquidation Circles: The indicator marks potential liquidation levels with small circles on the chart, with customizable colors for long and short liquidations.
Orange Circles -> Identifies Potential Short Liquidations
Aqua Circles -> Identifies Potential Long Liquidations
Example:
Adaptive Source Selection: Traders can select the price source (close, high, low, or open) for liquidation calculations, allowing flexibility based on their trading strategies.
Dynamic Threshold Calculation: The indicator dynamically adjusts the liquidation threshold based on the selected moving average lengths, providing adaptability to changing market conditions.
Disclaimer:
Use with Caution: This indicator is provided for educational purposes only and should not be considered as financial advice. Users should exercise caution and perform their own analysis before making trading decisions based on the indicator's signals.
Not Financial Advice: The information provided by this indicator does not constitute financial advice, and the creator (UAlgo) shall not be held responsible for any trading losses incurred as a result of using this indicator.
Backtesting Recommended: Traders are encouraged to backtest the indicator thoroughly on historical data before using it in live trading to assess its performance and suitability for their trading strategies.
Risk Management: Trading involves inherent risks, and users should implement proper risk management strategies, including but not limited to stop-loss orders and position sizing, to mitigate potential losses.
No Guarantees: The accuracy and reliability of the indicator's signals cannot be guaranteed, as they are based on historical price data and past performance may not be indicative of future results.
This indicator serves as a tool to assist traders in identifying potential liquidation levels, but it should be used in conjunction with other technical analysis tools and risk management practices for effective trading decision-making.

Liquidation Level ScreenerThe Liquidation Level Screener is an analytical tool designed for traders who seek a comprehensive view of potential liquidation zones in the market. This script, adaptable to almost any timeframe from 1 minute to 3 days, offers a unique perspective by mapping out key liquidation levels where significant market actions could occur.
Key Features:
Multi-Exchange Data Aggregation: Unlike many other indicators, the Liquidation Levels Indicator compiles data from multiple leading exchanges including Binance, Bitmex, Kraken, and Bitfinex. This approach ensures a more holistic and accurate representation of market sentiment, providing insights into potential liquidation points across various platforms.
Customizable Timeframes and Modes: The script is versatile, working effectively across various timeframes. It operates in two distinct modes:
Actual Levels Display: Visually represents potential liquidation levels.
Settings Mode: Showcases an open interest (OI) oscillator. When OI is exceptionally high, indicating a surge in opened positions at a specific candle, it signals traders to be vigilant about upcoming liquidation levels.
Three-Tier Liquidation System: The indicator categorizes liquidation levels into three distinct tiers based on open interest levels—1, 2, and 3—with Level 3 representing the highest concentration of open positions. This tiered approach allows traders to gauge the significance of each level and adjust their strategies accordingly.
Histogram Visualization: A novel feature of this script is the histogram on the chart's right side, representing the concentration of liquidation levels in specific market zones. This visual aid helps traders identify crucial areas that warrant close attention, enhancing decision-making.
Customizable Options:
Moving Averages: Choose from a wide range of moving average types, including VWMA, SMA, EMA, and more, to tailor the indicator to your analysis style.
Histogram Settings: Adjust the number of histograms, lookback bars, and their proximity to the latest candle, allowing for a personalized density and range of visualization.
Liquidation Level Sensitivity: Set thresholds for different liquidation levels, fine-tuning the indicator to detect varying degrees of market leverage.
Color Coding: Customize the color scheme for different leverage levels, enhancing visual clarity and ease of interpretation.
The Liquidation Level Screener offers a unique edge by highlighting potential zones where significant market movements can occur due to liquidations. By consolidating data from multiple exchanges, it provides a more rounded view of market behavior, which is essential in today’s interconnected trading environment. The tiered liquidation system and histogram feature equip traders with the ability to identify and focus on key market segments where high activity is expected. This tool is particularly valuable for traders who base their strategies on market liquidity and leverage dynamics.
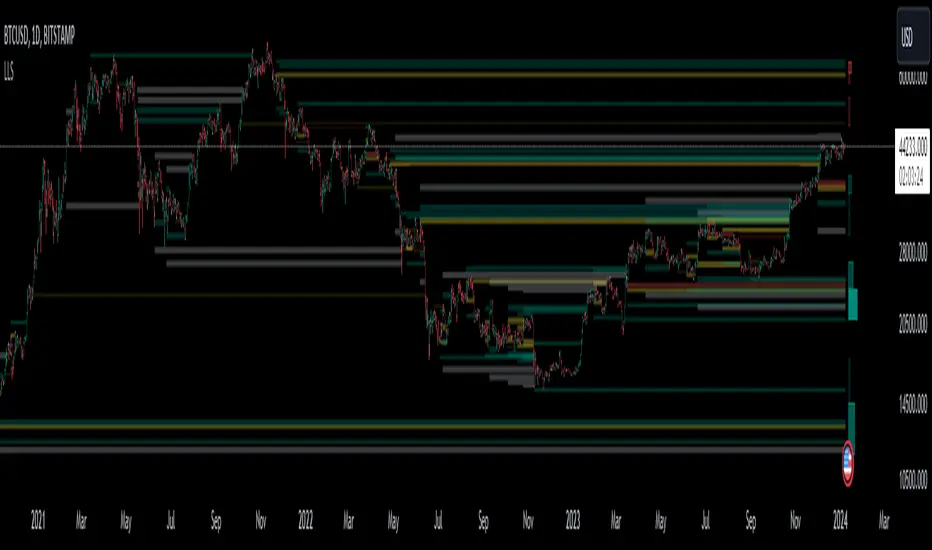
Liquidations Meter [LuxAlgo]The Liquidation Meter aims to gauge the momentum of the bar, identify the strength of the bulls and bears, and more importantly identify probable exhaustion/reversals by measuring probable liquidations.
🔶 USAGE
This tool includes many features related to the concept of liquidation. The two core ones are the liquidation meter and liquidation price calculator, highlighted below.
🔹 Liquidation Meter
The liquidation meter presents liquidations on the price chart by measuring the highest leverage value of longs and shorts that have been potentially liquidated on the last chart bar, hence allowing traders to:
gauge the momentum of the bar.
identify the strength of the bulls and bears.
identify probable reversal/exhaustion points.
Liquidation of low-leveraged positions can be indicative of exhaustion.
🔹 Liquidation Price Calculator
A liquidation price calculator might come in handy when you need to calculate at what price level your leveraged position in Crypto, Forex, Stocks, or any other asset class gets liquidated to add a protective stop to mitigate risk. Monitoring an open position gets easier if the trader can calculate the total risk in order for them to choose the right amount of margin and leverage.
Liquidation price is the distance from the trader's entry price to the price where trader's leveraged position gets liquidated due to a loss. As the leverage is increased, the distance from trader's entry price to the liquidation price shrinks.
While you have one or several trades open you can quickly check their liquidation levels and determine which one of the trades is closest to their liquidation price.
If you are a day trader that uses leverage and you want to know which trade has the best outlook you can calculate the liquidation price to see which one of the trades looks best.
🔹 Dashboard
The bar statistics option enables measuring and presenting trading activity, volatility, and probable liquidations for the last chart bar.
🔶 DETAILS
It's important to note that liquidation price calculator tool uses a formula to calculate the liquidation price based on the entry price + leverage ratio.
Other factors such as leveraged fees, position size, and other interest payments have been excluded since they are variables that don’t directly affect the level of liquidation of a leveraged position.
The calculator also assumes that traders are using an isolated margin for one single position and does not take into consideration the additional margin they might have in their account.
🔹Liquidation price formula
the liquidation distance in percentage = 100 / leverage ratio
the liquidation distance in price = current asset price x the liquidation distance in percentage
the liquidation price (longs) = current asset price – the liquidation distance in price
the liquidation price (shorts) = current asset price + the liquidation distance in price
or simply
the liquidation price (longs) = entry price * (1 – 1 / leverage ratio)
the liquidation price (shorts) = entry price * (1 + 1 / leverage ratio)
Example:
Let’s say that you are trading a leverage ratio of 1:20. The first step is to calculate the distance to your liquidation point in percentage.
the liquidation distance in percentage = 100 / 20 = 5%
Now you know that your liquidation price is 5% away from your entry price. Let's calculate 5% below and above the entry price of the asset you are currently trading. As an example, we assume that you are trading bitcoin which is currently priced at $35000.
the liquidation distance in price = $35000 x 0.05 = $1750
Finally, calculate liquidation prices.
the liquidation price (longs) = $35000 – $1750 = $33250
the liquidation price (short) = $35000 + $1750 = $36750
In this example, short liquidation price is $36750 and long liquidation price is $33250.
🔹How leverage ratio affects the liquidation price
The entry price is the starting point of the calculation and it is from here that the liquidation price is calculated, where the leverage ratio has a direct impact on the liquidation price since the more you borrow the less “wiggle-room” your trade has.
An increase in leverage will subsequently reduce the distance to full liquidation. On the contrary, choosing a lower leverage ratio will give the position more room to move on.
🔶 SETTINGS
🔹Liquidations Meter
Base Price: The option where to set the reference/base price.
🔹Liquidation Price Calculator
Liquidation Price Calculator: Toggles the visibility of the calculator. Details and assumptions made during the calculations are stated in the tooltip of the option.
Entry Price: The option where to set the entry price, a value of 0 will use the current closing price. Details are given in the tooltip of the option.
Leverage: The option where to set the leverage value.
Show Calculated Liquidation Prices on the Chart: Toggles the visibility of the liquidation prices on the price chart.
🔹Dashboard
Show Bar Statistics: Toggles the visibility of the last bar statistics.
🔹Others
Liquidations Meter Text Size: Liquidations Meter text size.
Liquidations Meter Offset: Liquidations Meter offset.
Dashboard/Calculator Placement: Dashboard/calculator position on the chart.
Dashboard/Calculator Text Size: Dashboard text size.
🔶 RELATED SCRIPTS
Here are some of the scripts that are related to the liquidation and liquidity concept, for more and other conceptual scripts you are kindly invited to visit LuxAlgo-Scripts .
Liquidation-Levels
Liquidations-Real-Time
Buyside-Sellside-Liquidity
