SMC Orderblocks (MTF)The SMC Orderblocks Indicator is designed to detect institutional orderblocks by focusing on price action and pattern detection, with a strong emphasis on identifying liquidity grabs.
This tool helps traders pinpoint areas where significant institutional trades are likely to occur by assuming the presence of orderblocks based on observed market behavior.
Unlike other indicators that may rely heavily on volume, the SMC Orderblocks Indicator offers a fresh approach rooted in a deep study of price action and Smart Money Concepts (SMC).
🔍 Unique Approach
Unlike other orderblock indicators that typically depend on volume to detect orderblocks (a common and valid method), the SMC Orderblocks Indicator explores a new approach. After extensive study and understanding of price action and SMC principles, this indicator focuses on market behavior to assume where institutional orderblocks might be. This approach offers traders a unique perspective and valuable insights, allowing them to view the market through a different lens.
🧠 The Theory Behind It
In trading, liquidity is essential for institutions and large market participants to execute their substantial orders. Orders tend to cluster around predictable levels, such as recent highs or lows, creating pools of liquidity. To secure better entry points for their large trades, institutions and market makers may manipulate prices to sweep these liquidity levels. The SMC Orderblocks Indicator is designed to detect these market manipulations—when price moves to capture liquidity—and uses these events to assume the presence of orderblocks at key levels. By recognizing these manipulations, the indicator provides insights into potential areas of significant institutional activity.
⚙️ How It Works
In order to make it work, there are two big essentail parts for this indicator. The first one is being able to identify liquidity areas. The second one is to detect the liquidity grab pattern.
1. Identifying Liquidity
So, in order to find market manipulations, mainly "liquidity grabs", the first thing we need is to find where the liquidity is.
Here "liquidity", refers to "orders", and only the exchange actually knows at what price orders are placed. The limit orders are visible in the order book and most of the time the exchange let this information be publicly accessed. But not all orders are in the orderbook. The stop-limit orders like stop-loss orders are added in the orderbook only when the market price reaches a certain price (the stop price).
At present, when using a chart script like Pinescript, there is no known way to access this real information.
But fortunately, traders and institutional behavior stay the same. Traders tend to place their orders at predictable levels, like above highs or below lows. They can also be near inducement areas, specifically created by institutions to induce traders to place their orders at certain levels.
So, the job of the indicator is first to find these levels, regardless of the method used. In the previous version of this script, I used pivots to detect highs and lows, but this method was lacking when it came to finding inducement zones or stacks of liquidity.
Instead, the indicator now uses a new method to check whether there is a stack of non-liquidated candles. This method allows the detection of inducement zones with unliquidated candles. When the stack reaches a certain number (by default, three), the liquidity is marked as valid for sweep detection.
Note: When using the indicator, you can enable the display of liquidity (to see mitigated and unmitigated liquidity) and their stack number.
2. Detecting a Liquidity sweep
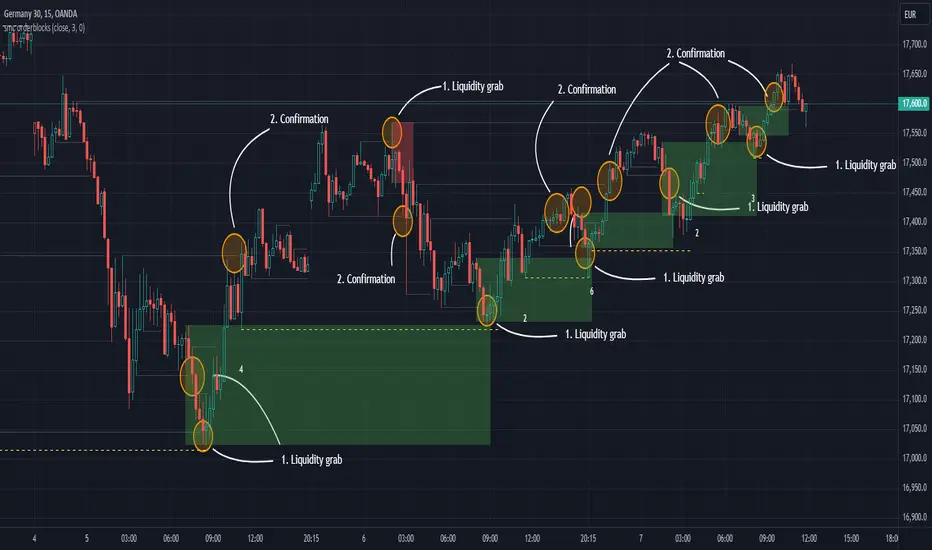
Once the first and key part is done, we need to detect the market manipulation: the liquidity grabs. Liquidity grab patterns are always the same. In the following example, let's assume the institutions want to fill sell orders in a bearish market. Here are the steps they will likely take:
- 1. The institutionals place their main orders (the orderblock) at a desired price.
- 2. They let the liquidity accumulate next to that desired price. They can even induce traders to place their own orders there. The will serve as liquidity.
- 3. Institutionals will manipulate the market price to move it towards their awaiting orders to fill them. Once that price is reach, and their orders are being filled, the market price will start moving in the opposite direction.
- 4. The grab is confirmed, when the liquidity in that oppsiite direction is grabed, or simply when the bearish market trend resumes by breaking the lows, along with additional confirmations
Sometimes, institutions will have two opposite positions in the same asset—one short and one long. This is called hedging. The goal here is to use the long orders to push the market price towards the main sell orders. Once the sell orders are filled and the market price starts falling, they may try to push it up again to close their long position with minimal loss and finally let the price fall for good.
It is at that moment that it is best to enter the market. This is why, by default, the indicator will display when the price starts moving upward towards the liquidity grab: because it's where the manipulation started and where the price is likely to reach again before resuming the main trend.
Real-Time Visualization:
As soon as an "orderblock" (or market manipulation) is detected, the indicator will display it on the chart in real time.
This immediate visualization helps traders stay ahead and catch the main market move.
💡 Usage Tips
Apply the script to your chart. This is a price-action based script so it will work on most markets. You do not need to edit settings but you can adjust them to match your trading style.
To get the most out of the SMC Orderblocks Indicator, it’s recommended to use it alongside other analysis tools, espacially market structure indicators. You can try the free-to-use SMC Market Structure (MTF) to filter the interesting orderblocks.
Additionnaly, if you search liquidity areas to set as your trade's target, you can enable their display to see mitigated and unmitigated liquidity lines. The display is disabled by default to keep charts clean.
While the indicator helps detect potential institutional orderblocks based on liquidity grabs, combining its insights with your trading knowledge and other tools will enhance decision-making.
⚠️ Disclaimer
While this method provides useful information, the orderblocks can only be assumed based on market behavior. Moreover, given how the indicator works, the accuracy cannot be guaranteed. It's important to combine the indicator's information with your own experience and other confirmation methods.
Orderblocks are also time-sensitive. The fact that an orderblock was detected and displayed on the chart does not guarantee that orders will still be present when the price returns to that level. If too much time has elapsed since the orderblock was created, or if the market structure has changed, it may be wise to disregard it. Always seek additional confirmation before opening a position.
The theory presented here on how institutional orderblocks are made, and how the market may be manipulated to fill orders, is based on my own research, knowledge, and analysis. Since I have never worked within an institution, these are educated assumptions and could be incorrect. Please always do your own research.
🚀 Active Development
The SMC Orderblocks Indicator is continuously evolving, with updates aimed at improving the rules for detecting and confirming orderblocks. Future updates may include new features and bug fixes to enhance performance and adapt to different trading styles.
📬 Note: If you encounter a bug, please contact me directly via private message, as I do not want to pollute the comment section with screenshots.
If you have any questions or suggestions for new features, feel free to reach out. You can also add a comment to boost its visibility.
Additionally, it’s recommended to compare the results of this indicator with others to find what best suits your trading style.
Please note that while this indicator is a paid script, you do not need to pay to test it. Contact me directly on TradingView via private message or through my socials, or leave a comment, and I’ll provide you with a free trial.
Liquiditygrab
Pure Price Action Liquidity Sweeps [LuxAlgo]The Pure Price Action Liquidity Sweeps indicator is a pure price action adaptation of our previously published and highly popular Liquidity-Sweeps script.
Similar to its earlier version, this indicator detects the presence of liquidity sweeps on the user's chart, while also identifying potential areas of support/resistance or entry when liquidity levels are taken. The key difference, however, is that this price action version relies solely on price patterns, eliminating the need for numerical swing length settings.
🔶 USAGE
A Liquidity Sweep occurs when the price breaks through a liquidity level , after which the price returns below/above the liquidity level , forming a wick.
The examples below show a bullish and bearish scenario of "a wick passing through a liquidity level where the price quickly comes back".
Short-term liquidity sweep detection is based on short-term swing levels. Some of these short-term levels, depending on further market developments, may evolve into intermediate-term levels and, in the long run, become long-term levels. Therefore, enabling short-term detection with the script means showing all levels, including minor and temporal ones. Depending on the trader's style, some of these levels may be considered noise. Enabling intermediate and long-term levels can help filter out this noise and provide more significant levels for trading decisions. For further details on how swing levels are identified please refer to the details section.
The Intermediate-term option selection for the same chart as above, filters out minor or noisy levels, providing clearer and more significant levels for traders to observe.
🔶 DETAILS
The swing points detection feature relies exclusively on price action, eliminating the need for numerical user-defined settings.
The first step involves detecting short-term swing points, where a short-term swing high (STH) is identified as a price peak surrounded by lower highs on both sides. Similarly, a short-term swing low is recognized as a price trough surrounded by higher lows on both sides.
Intermediate-term swing and long-term swing points are detected using the same approach but with a slight modification. Instead of directly analyzing price candles, we now utilize the previously detected short-term swing points. For intermediate-term swing points, we rely on short-term swing points, while for long-term swing points, we use the intermediate-term ones.
🔶 SETTINGS
Detection: Period options of the detected swing points.
🔶 RELATED SCRIPTS
Pure-Price-Action-Structures.
Liquidity-Sweeps.

Liquidity Swings & SweepsThis Pine script indicator is designed to create a visual representation liquidity as identified by swing Highs/Lows along with an indication of the liquidity level that was swept, optionally rating the strength of the sweep based on time & price.
Relevance:
Liquidity levels & sweeps are crucial for many SMC/ICT setups and can indicate a point at which the price changes direction or may re-trace in an opposite direction to provide additional liquidity for continued move in the original direction. Additionally, liquidity levels may provide targets for setups, as price action will often seek to take out those levels as they main contain many buy/sell stops.
How It Works:
The indicator tracks all swing points, as identified using user-defined strength of the swing. Once a swing is formed that meets the criteria, it is represented by a horizontal line starting at the price of the current swing until the last bar on the chart. While the swing is valid, this line will continue to be extended until the swing is invalid or a new swing is formed. Upon identifying a new swing, the indicator then scans the earlier swings in the same direction looking for a point of greatest liquidity that was taken by the current swing. This level is then denoted by dashed horizontal line, connecting earlier swing point to the current. At the same time any liquidity zones between the two swings are automatically removed from the chart if they had previously been rendered on the chart. If the setting to enable scan for maximum liquidity is enabled, then while looking back, the indicator will look for lowest low or highest high that was taken by the current swing point, which may not be a swing itself, however, is a lowest/highest price point taken (mitigated) by the current swing, which in many cases will be better price then then the one represented by previous swing. If the option to render sweep label is enabled, the sweep line will also be completed by a label, that will score the sweep and a tooltip showing the details of the level swept and the time it took to sweep it. The score explained further in configurability section ranks the strength of the sweep based on time and is complemented by price (difference in price between the two liquidity levels).
Configurability:
A user may configure the strength of the swing using both left/right strength (number of bars) as well as optionally instruct the indicator to seek the lowest/highest price point which may not be previous swing that was taken out by newly formed swing.
From appearance perspective liquidity level colors & line width presenting the liquidity/swing can be configured. There is also an option to render the liquidity sweep label that will generate an icon-based rating of the liquidity sweep and a tooltip that provides details on the scope of the swing, which includes liquidity level swept and when it was formed along with the time it took to sweep the liquidity.
Rating is of sweeps is primarily based on time with a secondary reference to price
💥- Best rating, very strong sweep with an hourly or better liquidity sweep
🔥- Second rating, strong sweep with 15 – 59 minute liquidity sweep, or 5+ minute sweep of 10+ points
✅- Third rating, ok sweep with 5 - 15 minute liquidity sweep, or lower-time-frame sweep of 10+ points
❄️ - Weakest sweep, with liquidity of 5 or less minutes swept
What makes this indicator different:
Designed with high performance in mind, to reduce impact on chart render time.
Only keeps valid liquidity levels & sweeps on the chart
Automatically removes previously taken liquidity levels
Ranks liquidity sweeps to indicate strength of the sweep

ICT Turtle Soup | Flux Charts💎 GENERAL OVERVIEW
Introducing our new ICT Turtle Soup Indicator! This indicator is built around the ICT "Turtle Soup" model. The strategy has 5 steps for execution which are described in this write-up. For more information about the process, check the "HOW DOES IT WORK" section.
Features of the new ICT Turtle Soup Indicator :
Implementation of ICT's Turtle Soup Strategy
Adaptive Entry Method
Customizable Execution Settings
Customizable Backtesting Dashboard
Alerts for Buy, Sell, TP & SL Signals
📌 HOW DOES IT WORK ?
The ICT Turtle Soup strategy may have different implementations depending on the selected method of the trader. This indicator's implementation is described as :
1. Mark higher timerame liquidity zones.
Liquidity zones are where a lot of market orders sit in the chart. They are usually formed from the long / short position holders' "liquidity" levels. There are various ways to find them, most common one being drawing them on the latest high & low pivot points in the chart, which this indicator does.
2. Mark current timeframe market structure.
The market structure is the current flow of the market. It tells you if the market is trending right now, and the way it's trending towards. It's formed from swing higs, swing lows and support / resistance levels.
3. Wait for market to make a liquidity grab on the higher timeframe liquidity zone.
A liquidity grab is when the marked liquidity zones have a false breakout, which means that it gets broken for a brief amount of time, but then price falls back to it's previous position.
4. Buyside liquidity grabs are "Short" entries and Sellside liquidity grabs are "Long" entries by default.
5. Wait for the market-structure shift in the current timeframe for entry confirmation.
A market-structure shift happens when the current market structure changes, usually when a new swing high / swing low is formed. This indicator uses it as a confirmation for position entry as it gives an insight of the new trend of the market.
6. Place Take-Profit and Stop-Loss levels according to the risk ratio.
This indicator uses "Average True Range" when placing the stop-loss & take-profit levels. Average True Range calculates the average size of a candle and the indicator places the stop-loss level using ATR times the risk setting determined by the user, then places the take-profit level trying to keep a minimum of 1:1 risk-reward ratio.
This indicator follows these steps and inform you step by step by plotting them in your chart.
🚩UNIQUENESS
This indicator is an all-in-one suit for the ICT's Turtle Soup concept. It's capable of plotting the strategy, giving signals, a backtesting dashboard and alerts feature. It's designed for simplyfing a rather complex strategy, helping you to execute it with clean signals. The backtesting dashboard allows you to see how your settings perform in the current ticker. You can also set up alerts to get informed when the strategy is executable for different tickers.
⚙️SETTINGS
1. General Configuration
MSS Swing Length -> The swing length when finding liquidity zones for market structure-shift detection.
Higher Timeframe -> The higher timeframe to look for liquidity grabs. This timeframe setting must be higher than the current chart's timeframe for the indicator to work.
Breakout Method -> If "Wick" is selected, a bar wick will be enough to confirm a market structure-shift. If "Close" is selected, the bar must close above / below the liquidity zone to confirm a market structure-shift.
Entry Method ->
"Classic" : Works as described on the "HOW DOES IT WORK" section.
"Adaptive" : When "Adaptive" is selected, the entry conditions may chance depending on the current performance of the indicator. It saves the entry conditions and the performance of the past entries, then for the new entries it checks if it predicted the liquidity grabs correctly with the current setup, if so, continues with the same logic. If not, it changes behaviour to reverse the entries from long / short to short / long.
2. TP / SL
TP / SL Method -> If "Fixed" is selected, you can adjust the TP / SL ratios from the settings below. If "Dynamic" is selected, the TP / SL zones will be auto-determined by the algorithm.
Risk -> The risk you're willing to take if "Dynamic" TP / SL Method is selected. Higher risk usually means a better winrate at the cost of losing more if the strategy fails. This setting is has a crucial effect on the performance of the indicator, as different tickers may have different volatility so the indicator may have increased performance when this setting is correctly adjusted.

ICT Setup 01 [TradingFinder] FVG + Liquidity Sweeps/Hunt Alerts🔵 Introduction
The ICT (Inner Circle Trader) style of trading involves analyzing the behavior of market participants and market makers to identify areas where fake buy and sell activities occur. This trading style helps retail traders align with market maker behavior and avoid falling into market traps.
A key aspect of the ICT strategy is focusing on liquidity hunts. This involves searching for trading opportunities in areas of the market with low liquidity or where other traders have little activity. The ICT method leverages market inefficiencies and weaknesses, allowing traders to profit from small price movements that might go unnoticed by others.
In "ICT Setup 01," our focus is on these liquidity areas and stop hunts that form in Fair Value Gaps (FVGs). Trading within FVGs, combined with confirmations from "Hunts" and "Sweeps," can enhance trader performance.
🔵 How to Use
The presence of Fair Value Gaps (FVGs) in the market indicates rapid, powerful movements likely caused by the influx of smart money. When the price returns to these levels, a market reaction is expected.
Combining this with the complex and deceptive behavior of smart money—such as "Liquidity Sweeps" and "Stop Hunts"—forms an ICT-based price action setup that we expect to perform well.
Components of "ICT Setup 01" :
● Fair Value Gap (FVG)
● Premium and Discount
● Hunts / Sweeps
Whenever the price returns to an FVG area and reacts in such a way that only the wicks of the candles remain in the area and the candle bodies are outside the FVG, the first condition for creating the setup is met.
If subsequent candles hunt the wick that has penetrated the deepest into the FVG, a buy or sell signal is issued. In the format where hunting is based on Sweeps, penetrations that extend even outside the area are considered signals, provided they do not form a body within the area.
Additionally, a refining system exists for cases where a candle body forms in the area, optimizing the proximal levels of the FVG.
Bullish Setup :
Bearish Setup :
🔵 Features and Settings of "ICT Setup 01"
You can Find out more in Setting :
● FVG Detector Multiplier Factor
● FVG Validity Period
● Level in Low-Risk Zone
● Issuing Signals Method
● Number of Signals Allowed from a Zone
● Signal after Hunts/Sweeps
● How Many Hunts/Sweeps
● Show or Hide
● Alert Sender
FVG Detector Multiplier Factor :
This feature allows you to determine the size of the moves forming the FVGs based on the ATR (Average True Range). The default value is 1 to identify the majority of setups. You can increase this value according to the symbol and market you are trading in to achieve better results.
FVG Validity Period :
This shows the validity period of an FVG based on the number of candles. By default, an FVG area is valid for up to 15 candles. However, you can increase or decrease this period.
Level in Low-Risk Zone :
This feature helps reduce your risk. The method works by identifying the entire length of the three candles forming the FVG and dividing it into two equal areas. The upper area is "Premium," and the lower area is "Discount." To reduce risk, it is better for "Demand FVG" to be in the "Discount" and "Supply FVG" in the "Premium." This feature is off by default.
Issuing Signals Method :
This feature allows you to specify whether the hunt should occur only within the FVG area or if the wicks can extend outside the area.
If set to "Hunts," only signals where the wicks are within the area are issued, and the area loses its validity if the wicks extend outside.
In "Sweeps" mode, wicks can extend outside the area as long as they do not form a body within the area.
Number of Signals Allowed from a Zone :
This feature allows you to specify how many valid signals can be issued from one area.
Signal after Hunts/Sweeps :
In markets or symbols with a tendency for frequent stop hunts, this feature allows you to specify how many hunts should occur before you receive a signal to avoid receiving potentially failed signals.
How Many Hunts/Sweeps :
Enter the number of hunts you want to set for the "Signal after Hunts/Sweeps" feature here.
Show or Hide :
The number of setups formed may be very large, and displaying all of them on the chart can be distracting and messy. By default, only the last setup is displayed, but if you want to see all setups, you can turn on the relevant options.
Alert Sender :
You cannot constantly monitor multiple charts to identify trading opportunities. Using the alert sending feature can save time and improve performance.
Alerts Name : Customize the alert name to your preference.
Message Frequency : Determines the frequency of alert messages. Options include 'All' (triggers every time the function is called), 'Once Per Bar' (triggers only on the first call within the bar), and 'Once Per Bar Close' (triggers only on the final script execution of the real-time bar upon closure). The default is 'Once per Bar.'
Show Alert Time by Time Zone : Configure the alert messages to reflect any chosen time zone. For instance, input 'UTC+1' for London time. The default is 'UTC.'
By configuring these settings, traders can effectively utilize ICT setups to improve their trading strategies and outcomes.

Liquidity Grab Zones | Flux Charts💎 GENERAL OVERVIEW
Introducing our new Liquidity Grab Zones Indicator! This indicator finds liquidity grabs in the current ticker and renders buyside & sellside liquidity grab zones. The retests and breakout of the zones are labeled, and you can set up alerts to get notified. For more information, please check the "HOW DOES IT WORK" section.
Features of the new Liquidity Grab Zones Indicator :
Renders Buyside & Sellside Liquidity Grab Zones
Retests & Breaks
Inverse Zones After Broken Feature
Alerts For All Features
Customizable Algorithm
Customizable Styles
🚩UNIQUENESS
Liquidity grabs can be useful when determining candles that have executed a lot of market orders, so you can plann your trades accordingly. This indicator lets you customize the pivot length and the wick-body ratio for liquidity grabs, provide retest & breakout labels, with customized styling and alerts.
📌 HOW DOES IT WORK ?
Liquidity grabs occur when one of the latest pivots has a false breakout. Then, if the wick to body ratio of the bar is higher than 0.5 (can be changed from the settings) a zone is plotted.
These zones usually indicate areas of high market interest where price action may reverse or accelerate. Identifying these zones can provide traders with critical levels for entering or exiting trades. A breakout of these zones generally mean strong movements are inbound, while failing breakouts make these zones act like support / resistance zones.
The indicator also reverses the type of the zone after an invalidation (can be turned off from the settings). This feature helps traders identify potential reversals more accurately.
The zone width is set to the area from the wick to the body of the candlestick, which can be seen here :
⚙️SETTINGS
1. General Configuration
Pivot Length -> This setting determines the range of the pivots. This means a candle has to have the highest / lowest wick of the previous X bars and the next X bars to become a high / low pivot.
Wick-Body Ratio -> After a pivot has a false breakout, the wick-body ratio of the latest candle is tested. The resulting ratio must be higher than this setting for it to be considered as a liquidity grab.
Zone Invalidation -> Select between Wick & Close price for Liquidity Grab Zone Invalidation.
Use these customizable settings to fine-tune the indicator according to your trading strategy and preferences.

Liquidity Grab Screener | Flux Charts💎 GENERAL OVERVIEW
Introducing our new Liquidity Grab Screener! This screener can provide information about the latest liquidity grabs in up to 5 tickers. You can also customize the algorithm that finds the liquidity grabs and the styling of the screener.
Features of the new Liquidity Grab Screener :
Find Latest Liquidity Grabs Accross 5 Tickers
Price, Size, Status Information
Customizable Algoritm / Styling
📌 HOW DOES IT WORK ?
Liquidity grabs occur when one of the latest pivots has a false breakout. Then, if the wick to body ratio of the bar is higher than 0.5 (can be changed from the settings) a bubble is plotted.
The bubble size is determined by the wick to body ratio of the candle.
This screener then finds liquidity grabs accross 5 different tickers, and shows the latest information about them.
Price -> The price when the liquidity grab happened.
Size -> Size of the liquidity grab, determined by the wick-body ratio.
Status -> Shows the elapsed time of the liquidity grab.
🚩UNIQUENESS
Liquidity grabs can be useful when determining candles that have executed a lot of market orders, and planning your trades accordingly. This screener will find liquidity grabs from up to 5 tickers and give information about their price, size and status. The screener also lets you customize the pivot length and the wick-body ratio for liquidity grabs.
⚙️SETTINGS
1. Tickers
You can set up to 5 tickers for the screener to scan order blocks here. You can also enable / disable them and set their individual timeframes.
2. General Configuration
Pivot Length -> This setting determines the range of the pivots. This means a candle has to have the highest / lowest wick of the previous X bars and the next X bars to become a high / low pivot.
Wick-Body Ratio -> After a pivot has a false breakout, the wick-body ratio of the latest candle is tested. The resulting ratio must be higher than this setting for it to be considered as a liquidity grab.

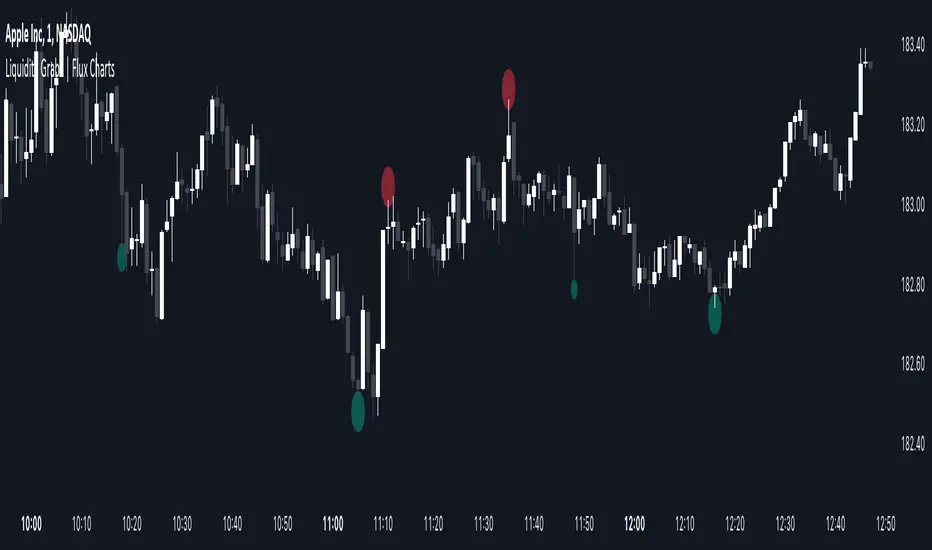
Liquidity Grabs | Flux Charts💎 GENERAL OVERVIEW
Introducing our new Liquidity Grabs indicator! This indicator can renders bubbles with different sizes at candles that have liquidity grabs, which happen when a liquidity areas (buyside / sellside liquidity) is swept. These candles often fill a lot of market orders that were sitting on the liquidity zone. You can check "How Does It Work" section for more information.
Features of the new Liquidity Grabs Indicator :
Renders Liquidity Grabs
Customizable Algorithm
Customizable Styles
Alerts
🚩UNIQUENESS
Liquidity grabs can be useful when determining candles that have executed a lot of market orders, and planning your trades accordingly. This indicator renders liquidity grabs in an unique bubble style, the size of the bubble is calculated by the size of the wick that caused the liquidity grab. The indicator also lets you customize the pivot length and the wick-body ratio for liquidity grabs.
📌 HOW DOES IT WORK ?
Liquidity grabs occur when one of the latest pivots has a false breakout. Then, if the wick to body ratio of the bar is higher than 0.5 (can be changed from the settings) a bubble is plotted. Using the wick length as a metric to measure liquidity is good because long wicks can translate to a large amount of buyers / sellers entering the market.
The bubble size is determined by the wick to body ratio of the candle.
⚙️SETTINGS
1. General Configuration
Pivot Length -> This setting determines the range of the pivots. This means a candle has to have the highest / lowest wick of the previous X bars and the next X bars to become a high / low pivot.
Wick-Body Ratio -> After a pivot has a false breakout, the wick-body ratio of the latest candle is tested. The resulting ratio must be higher than this setting for it to be considered as a liquidity grab.
Liquidity Sweeps [LuxAlgo]The Liquidity Sweeps indicator detects the presence of liquidity sweeps on the user's chart, while also providing potential areas of support/resistance or entry when Liquidity levels are taken.
In the event of a Liquidity Sweep a Sweep Area is created which may provide further areas of interest.
🔶 USAGE
A Liquidity Sweep occurs when the price breaks through a liquidity level (further referred to as LqL ), after which the price returns below/above the liquidity level , forming a wick.
The script provides 2 options when this can happen:
A wick passes a LqL after which the price quickly returns.
First the closing price breaks through a LqL . After a while, the price retests the LqL and forms a wick in the opposite direction.
The examples above show a bullish and bearish scenario of "a wick passing through an LqL where the price quickly comes back". This type of Liquidity Sweep is represented by a dotted line.
The following example shows a broken LqL , where the price retests the Liquidity zone and bounces back.
Instead of a dotted line, this type of Liquidity Sweep is represented by a dashed line.
When a Liquidity Sweep takes place, this is indicated by highlighting the "wick- LqL " distance. This distance is also the basis for the Sweep Area (see next sub-section). A small 3-bar long dotted line starts from the opposite wick as an extra aid to determine potential support/resistance/entry, ...
Colors can be set in the settings (here yellow and aqua blue instead of default colors for clarity).
🔹 Sweep Areas
The distance between the LqL and the maximum limit of the wick forms a Sweep Area , which can provide a potential support/resistance or entry zone.
These examples show both types of Liquidity Sweeps , followed by a box indicating the Sweep Area .
When the Sweep Area is mitigated or a certain amount of bars has passed (Settings - 'Max bars'), the boxes will no longer be updated.
In this case, the 'Trigger' label shows the bar where the high crossed a LqL , after which a red box starts between LqL and high.
The low of the 'Trigger' bar is the starting point of a short dotted line. Next to the 'Trigger bar' the high touches the Sweep Area before returning, providing a potential short entry. One bar further, another entry opportunity presents itself when the price breaks the small dotted line.
In the following bullish example, not only do we see opportunities when the LqL has been swept, but the following Sweep Area provides some potential entries.
The small green dotted lines also act as a guide where the price breaks above, then forms a small range, after which the price continues in an upward direction.
Here, the initial trigger on the left forms a Sweep Area that is quickly broken. However, the small green line provides a potential entry area later on. The price moves in a short channel before breaking above the LqL (green dashed line), providing more potential entries. Price retests this LqL , and goes below this level. The price remained around the previously formed channel, after which the price resumed its upward trend.
🔶 SETTINGS
🔹 Liquidity Sweeps
Swings: Period used for the swing detection, with higher values returning longer term Liquidity Levels .
Options:
- Only Wicks: Only detects a Liquidity Sweep when a wick sweeps a previous wick
- Only Outbreaks & Retest: Only detects a Liquidity Sweep when the price breaks a Liquidity Level , returns & retests the Liquidity Level , and forms a wick in the opposite direction.
- Wicks + Outbreaks & Retest: Both options can be detected.
🔹 Sweep Area
Extend: Enables/Disables extension of the Sweep Area boxes.
Max Bars: Limit the extension to a certain number of bars.
Color Sweep Area box.

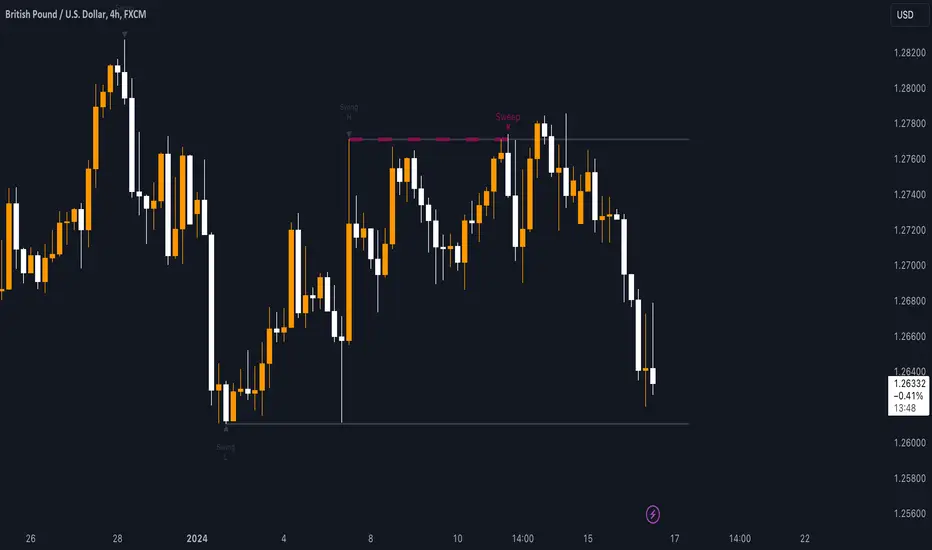
Sweep institutionalThis indicator focuses on identifying "SWEEPs" based on taking liquidity at highs and lows. The application of the SWEEP strategy is highly determinant in the Swing points, as they serve as the target of our operations.
ALERTS INCLUDED
🔹Example of Strategy Application
1.-Create the BULLISH SWEEP.
2.-You can enter LONG.
3.-If it is a BULLISH SWEEP, take a long with a SWING HIGH target (2-3 pips up).
4.-If it is a BULLISH SWEEP, place your SL behind the SWEEP (2-3 pips).
(This example is bullish, but it would be the same in a bearish setup, applying everything in the opposite way)
t's very crucial for the strategy to reference SWING POINTS, as these points will be our take profit and stop loss points.
The strategy is based on identifying a SWEEP. After this, we can look for trading opportunities with targets on the opposite side of the fractal. Remember, if you decide to enter, the Stop Loss should be placed protected by the Sweep, and the Take Profit should be set at the opposite Swing, as seen in the example.
Use this STRATEGY IN TIMEFRAMES GREATER THAN 30M. If you decide to use it in timeframes <30M, there's a higher probability of encountering false SWEEPs (the most optimal are 1h & 4h)
🔹Use
The Sweep strategy involves identifying potential trades based on the creation of a "SWEEP" (liquidity grab) at the Swing High or Swing Low. Below is an example of a bearish opportunity after taking liquidity from a Swing High with a wick and no candle body closing above it.
🔹Details
As you have seen, it indicates the surpassing of a high without the candle body, this is called a “SWEEP.” Each time this occurs, the price is likely to surpass the opposite SWING High/Low. The following example will show more clearly how it works in both bullish and bearish scenarios.
🔹Configuration
-Cooldown period: is the length of the operating Range line
-Swing detection: determines the points to be used as SL and TP protection
Bullish/Berish Sweep
-Line Width: size of the line
-Line Style: design type
-Color
Liquidity PeaksThe "Liquidity Peaks" indicator is a tool designed to identify significant supply and demand zones based on volumetric analysis. It analyzes the volume profile within a specified lookback range to pinpoint the most volumetric point and draw corresponding zones on the price chart.
The 𝐋𝐢𝐪. 𝐏𝐞𝐚𝐤𝐬 indicator utilizes volume data to identify key supply and demand areas on the price chart. By examining the volume profile within a defined lookback range, it highlights three distinct zones: liquidity grab, volume containment, and the most volumetric point.
Zones and their meanings:
Liquidity grab (Orange box): This zone represents a price level where there is a significant swipe of the previous demand zone within the volume range. It indicates a potential shift in market sentiment and serves as a key supply or demand area.
Volume containment (Gray box): This zone displays the area of volume contained before the peak in volume. It provides insights into the range where buying or selling pressure was concentrated, highlighting potential support or resistance levels.
Most volumetric point (Light blue box): This zone represents the point within the lookback range that exhibits the highest volume. It signifies a significant area of market interest and indicates a potential supply or demand level.
Adjustable options:
Adjust liquidity Grab: This option allows you to adjust the size of the boxes. When enabled, the box size is set to twice the size of the high or low of the candle's wick. This adjustment enhances the visibility and accuracy of identifying swipes at specific price levels.
Show origin: Enabling this option ensures that the liquidity boxes are drawn from the wick they were created from. This provides a clear visual reference to the specific candle and highlights the liquidity levels associated with it.
Utility:
The 𝐋𝐢𝐪. 𝐏𝐞𝐚𝐤𝐬 indicator is a valuable tool for traders and investors seeking to identify significant supply and demand zones in the market. By analyzing volume data and drawing corresponding zones on the chart, it helps to pinpoint areas where buying or selling pressure is likely to emerge.
Traders can utilize this information to identify potential support and resistance levels, plan their entries and exits, and make more informed trading decisions. The liquidity grab zones can act as potential reversal or breakout points, while the volume containment zones and most volumetric points provide insights into areas of high market interest.
It is important to note that this indicator should be used in conjunction with other technical analysis tools and indicators to confirm trading signals and validate market dynamics.
Example Charts:

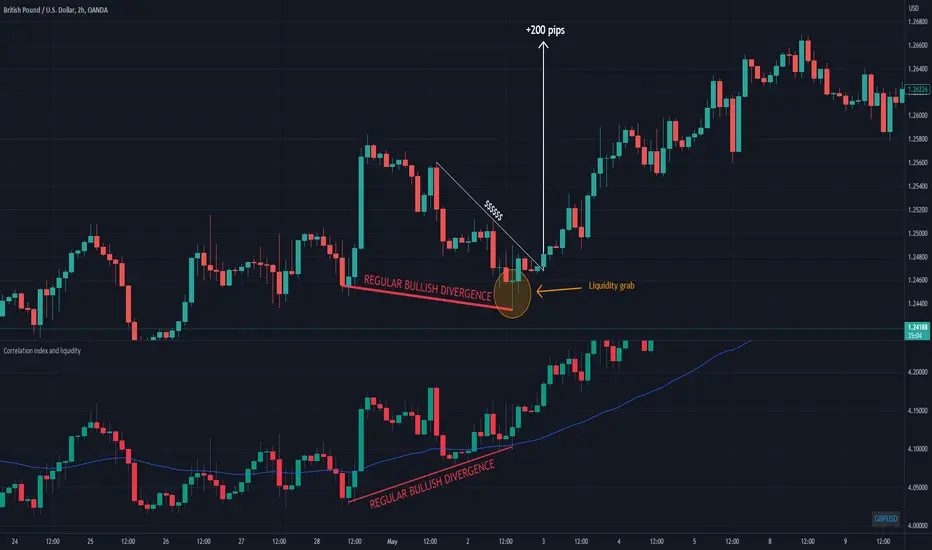
Correlation index and liquidityAn indicator with which you can easily compare any ticker with the ones offered.
You can choose any of the tags that are offered in the options
You can also create your own ticker if you select the Custom in Mode option.
If the comparison mode is enabled, the current ticker you are viewing is divided by the ticker selected in the indicator.
For example, if you have the EURUSD ticker open. And the EURUSD indicator is selected in the option in the indicator. Then you will get the EURUSD correlation index with other currency pairs that are correlated, for example GBPUSD+NZDUSD+AUDUSD. This means that you can now see the common index of those three pairs in relation to the EURUSD.
Custom index for major currency, example GBP have index of GBPUSD+GBPAUD+GBPJPY+GBPNZD+GBPCHF. This means that you can now see the common index of those pairs in relation to the GBP.
This script is unique because it requires the optimal combination of pairs needed for each pair specifically, which I came to during many years of studying the forex market so the source code of the script have to remain hidden.
If you are a beginerr, you can just apply simple trend-breakout strategy after you spot the divergence.
For advanced traders, you can use this together with ICT's and SMC concepts as a confirmation upon your entry.
Please comment if you like it!
CRYPTO DIVERGENCE FINDERThis indicator allows you to easily compare any ticker you're looking at with the ones I've found to work best over many years of studying the crypto market. For these reasons, the code of the script is hidden because that is exactly what makes it unique.
You can choose any cryptocurrency, but I recommend using only perpetuals on 'BINANCE' exchange.
If the comparison mode is enabled, the current ticker you are viewing is divided by the ticker selected in the indicator.
For example, if you are watching "SOLUSDT.P" you should open the settings of the indicator and write "SOLUSDT.P" in the ticker field. Then you will get the SOLUSDT.P correlation index with other crypto and currency pairs that are correlated (like I already said this is something that is product of many years of studying this market and this is exactly what is unique about the code so the source of the script have to stay protected).
If you are a beginer, you can just apply simple trend-breakout strategy after you spot the divergence.
For advanced traders, you can use this together with ICT's and SMC concepts as a confirmation upon your entry.

Liquidity Grab ReversalIndicator looks for liquidity grab & reversal trades on any timeframe. These types of trades reveal how the big institutions, banks and hedge funds trade with big money. If they want their very big positions to be filled they need to find areas in chart where the majority of the money is sitting. Where is it? Where is the majority of orders placed? Right below supports or right above resistances, these orders are stoplosses or stop orders. So they need to push the price to these areas, take all the available stoplosses and trigger all the available stop orders in order to fill their positions and then push the price to the opposite side to make profit (and retail to lose).
Indicator looks for support or resistance (S/R) areas which are represented by dotted lines. This S/R areas are created by minimum of 2 pivot high/low (H/L). Every pivot H/L that creates the S/R area is marked with diamond label. This S/R area is called liquidity. After liquidity is created, indicator looks for liquidity grab (mostly represented by fast spike to this area) and then price should go fast to the opposite side. This behaviour can be called reversal after liquidity grab. If we want to participate in the reversal we can put stop order at high of the candle that grabbed the support/liquidity if it is long liquidity grab or at low of the candle that grabbed the resistance/liquidity if it is short liquidity grab. These entry points are represented by solid lines. Stoplosses can be placed to the local maximum/minimum created after liquidity grab - so if entry is at high of the liquidity grab candle then stoploss can be put at low of the structure created after liquidity grab.
In settings of the indicator you can set whether only long or only short liquidity grabs are shown. Long liquidity grabs are green and short ones are red.
You can adjust core settings of the indicator:
Liquidity H/Ls Look Back/Forward Period: For PIVOT HIGH there has to be X (by default 1) candle/s lower to the left and X (by default 1) candle/s lower to the right and vice versa for PIVOT LOW,
Liquidity Grab by Close or High/Low.

ICT HTF Liquidity Levels /w Alert [MsF]Japanese below / 日本語説明は英文の後にあります。
-------------------------
*This indicator is based on sbtnc's "HTF Liquidity Levels". It's a very cool indicator. thank you.
It has 3 functions: visualization of HTF liquidity (with alert), candle color change when displacement occurs, and MSB (market structure break) line display.
=== Function description ===
1. HTF liquidity (with alert)
Lines visualize the liquidity pools on the HTF bars. Alerts can be set for each TF's line.
Once the price reaches the line, the line is repaint.
To put it plainly, the old line disappears and a new line appears. The line that disappeared remains as a purged line. (It is also possible to hide the purged line with a parameter)
The alert will be triggered at the moment the line disappears. An alert will be issued when you touch the HTF's liquid pools where the loss is accumulated, so you can notice the stop hunting with the alert.
This alert is an original feature of this indicator.
The timeframe of the HTF can't modify. You can get Monthly, weekly, daily and H1 and H4.
Each timeframe displays the 3 most recent lines. By narrowing it down to 3, it is devised to make it easier to see visually. (This indicator original)
2. Displacement
Change the color display of the candlesticks when a bullish candle stick or bearish candle stick is attached. Furthermore, by enabling the "Require FVG" option, you can easily discover the FVG (Fair Value Gap). It is a very useful function for ICT trading.
3. MSB (market structure break)
Displays High/Low lines for the period specified by the parameter. It is useful for discovering BoS & CHoCH/MSS, which are important in ICT trading.
=== Parameter description ===
- HTF LIQUIDITY
- Daily … Daily line display settings (color, line width)
- Weekly … Weekly line display settings (color, line width)
- Monthly … Monthly line display settings (color, line width)
- INTRADAY LIQUIDITY
- 1H … 1H line display settings (color, line width)
- 4H … 4H line display settings (color, line width)
- PURGED LIQUIDITY … Display setting of the line once the candle reaches
- Show Purge Daily … Daily purged line display/non-display setting
- Show Purge Weekly … Weekly purged line display/non-display setting
- Show Purge Monthly … Monthly purged line display/non-display setting
- Show Purge 1H … 1H purged line display/non-display setting
- Show Purge 4H … 4H purged line display/non-display setting
- MARKET STRUCTURE BREAK - MBS
- Loopback … Period for searching High/Low
- DISPLACEMENT FOR FVG
- Require FVG … Draw only when FVG occurs
- Displacement Type … Displacement from open to close? or from high to low?
- Displacement Length … Period over which to calculate the standard deviation
- Displacement Strength … The larger the number, the stronger the displacement detected
-------------------------
このインジケータはsbtncさんの"HTF Liquidity Levels"をベースに作成しています。
上位足流動性の可視化(アラート付き)、変位発生時のローソク色変更、MSB(market structure break)ライン表示の3つの機能を有します。
<機能説明>
■上位足流動性の可視化
上位足の流動性の吹き溜まり(ストップが溜まっているところ)をラインで可視化します。ラインにはアラートを設定することが可能です。
一度価格がラインに到達するとそのラインは再描画されます。
平たく言うと、今までのラインが消えて新しいラインが出現する。という事です。
消えたラインはpurgeラインとして残ります。(パラメータでpurgeラインを非表示にすることも可能です)
アラートはラインが消える瞬間に発報します。上位足の損切り溜まってるところにタッチするとアラートを発報するので、アラートにてストップ狩りに気づくことができます。
このアラート発報については本インジケータオリジナルの機能となります。
表示可能な上位足のタイムフレームは固定です。月足、週足、日足およびH1とH4を表示することができます。
各タイムフレーム、直近から3つのラインを表示します。3つに絞ることで視覚的に見やすく工夫しています。(本インジケータオリジナル)
■変位発生時のローソク色変更
大きな陽線、陰線を付けた場合に、そのローソク足をカラー表示を変更します。
さらに"Require FVG"オプションを有効にすることで、FVG(Fair Value Gap)を容易に発見することができます。ICTトレードにを行うにあたり大変有用な機能となっています。
■MSB(market structure break)ライン表示
パラメータで指定した期間のHigh/Lowをライン表示します。ICTトレードで重要視しているBoS & CHoCH/MSSの発見に役立ちます。
<パラメータ説明>
- HTF LIQUIDITY
- Daily … 日足ライン表示設定(色、線幅)
- Weekly … 週足ライン表示設定(色、線幅)
- Monthly … 月足ライン表示設定(色、線幅)
- INTRADAY LIQUIDITY
- 1H … 1時間足ライン表示設定(色、線幅)
- 4H … 4時間足ライン表示設定(色、線幅)
- PURGED LIQUIDITY … 一度到達したラインの表示設定
- Show Purge Daily … 日足ライン表示/非表示設定
- Show Purge Weekly … 週足ライン表示/非表示設定
- Show Purge Monthly … 月足ライン表示/非表示設定
- Show Purge 1H … 1時間足ライン表示/非表示設定
- Show Purge 4H … 4時間足ライン表示/非表示設定
- MARKET STRUCTURE BREAK - MBS
- Loopback … High/Lowを探索する期間
- DISPLACEMENT FOR FVG
- Require FVG … FVG発生時のみ描画する
- Displacement Type … openからcloseまでの変位か?highからlowまでの変位か?
- Displacement Length … 標準偏差を計算する期間
- Displacement Strength … 変位の強さ(数字が大きいほど強い変位を検出)

Stophunt WickAcknowledgement
This indicator is dedicated to my friend Alexandru who saved me from one of these liquidation raids which almost liquidated me.
Alexandru is one of the best scalpers out there and he always nails his entries at the tip of these wicks.
This inspired me to create this indicator.
What's a Liquidation Wick?
It's that fast stop-hunting wick that stophunts everyone by triggering their stop-loss and liquidation.
Liquidity is the lifeblood of stock market and liquidation is the process that moves price.
This indicator will identify when a liquidity pool is getting raided to trigger buy or sell stops, they are also know as stop-hunts.
How does it work?
When market consolidates in one direction, it builds up liquidity zones.
Market maker will break out of these consolidation phases by having dramatic price action to either pump or dump to raid these liquidity zones.
This is also called stop-hunts or liquidity raids. After that it will start reversing back to the opposite direction.
This is most noticeable by the length of the wick of a given candle in a very short amount of time and the total size of the candle.
This indicator highlights them accordingly.
Settings
Wick and Candle ratio works with default values but finetune will enhance user experience and usability.
Wick Ratio: Size of the wick compared to body of a candle.
Adjust this to higher ratio on smaller timeframe or smaller ratio on bigger timeframe to your trading style to spot a trend reversal.
Candle Ratio: The size of the candle, by default it is 0.75% of the current price.
For example, if BTC is at 20,000 then the size of the candle has to be minimum 150.
This can be fine tuned to bigger candle size on higher time frames or smaller for shorter timeframe depending on the trade type.
How to use it?
This indicator will identify when a liquidity pool is getting raided to trigger buy or sell stops, they are also know as stop-hunts. It can be used of its own for scalping but there are also a good few indicators which would most definitely help to confluence bigger timeframe trades.
Scalp
This indicator shows the most chaotic moments in price action; therefore it works best on smaller timeframes, ideally 3 or 5 minute candle.
- Wait for the market to start pumping or dumping.
- Current candle will change colour (Bullish/Bearish).
- Enter trade as soon as price starts to reverse back.
- Place the stop-loss outside of the current candle.
- Wait for the Liquidation Wick to appear as confirmation.
Price is very chaotic during a liquidity stop-hunt raid but there is a saying:
"In the midst of chaos, there is also opportunity" - Sun-Tzu
Since this is a very high risk, high reward strategy; it is advised to practice on paper trade first.
Practice until perfection and this indicator would be the perfect bread and butter scalp confirmation.
Fair Value Gap
FVG strategy is the most accurate in conjunction with this indicator.
Normally price would reverse after consuming fair value gaps but often it's difficult to know when and where.
This indicator would identify those crucial entry points for reverse course direction of the price action.
Support and Resistance
This indicator can also be used in conjunction with support and resistance lines.
Generally the stophunt will go deep below the support or spike much further up the resistance lines to liquidate positions.
Bollinger Bands
Bolling Bands strategy would be to wait until the price breaks out of the band.
Once the wick is formed, it would be an ideal entry point.
Script change
This is an open-source script and feel free to modify according to your need and to amplify your existing strategy.

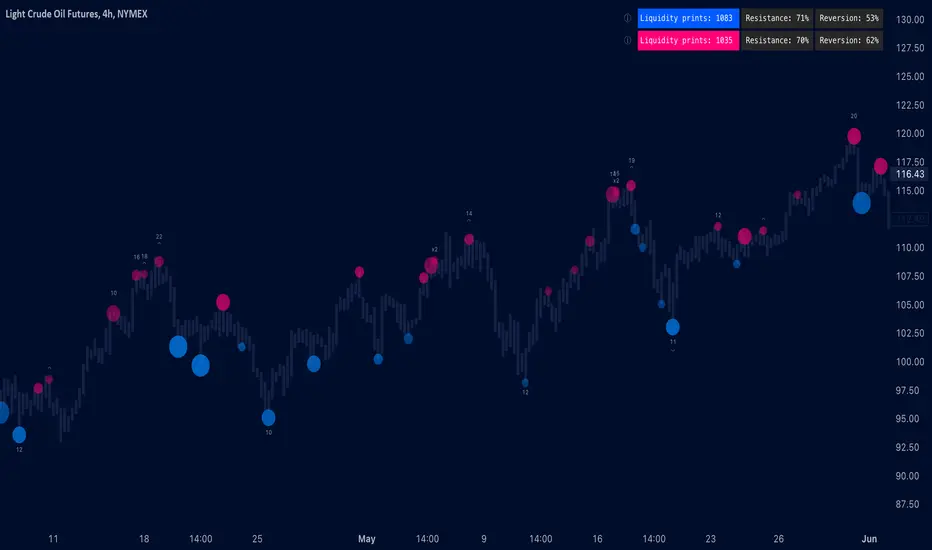
Liquidity prints / quantifytools- Overview
Liquidity prints detect points in price where buyers or sellers are being effectively absorbed, indicative of price being on a path of resistance. In other words, the prints detect points in price where hard way is likely in current motion and easy way in the opposite. Prints with ideal attributes such as prints into extended trends or into a deviation are marked separately as print confluence. Prints with important or multiple confluence factors give further color into potential strength and duration of print influence. Liquidity prints are detected using an universally applicable method based on price action (OHLC). The prints principally work on any chart, whether that is equities, currencies, cryptocurrencies or commodities, charts with volume data or no volume data. Essentially any asset that can be considered an ordinary speculative asset. The prints also work on any timeframe, from second charts to monthly charts. Liquidity prints are activated real-time after a confirmed bar close, meaning they are not repainted and can be interacted with once a confirmation is in place.
Liquidity prints are based on the premise that price acts a certain way when sufficient liquidity is found, in other words when price shows exhaustion of some sort. A simple example of such price action are wicks, attempted moves that were rejected within the same time period where move was initiated. This type of price action typically takes place when price is close to or at meaningful amount of bids in an order book. There's no guarantee the stacked orders can't be just cleared and moved through, but at face value it does not make sense to expect price moving the hard way. When sufficient amount of characteristics in price action are hinting proximate liquidity, a print is activated. As a barometer for print feedback quality, short term impact on price rate of change and likelihood of print lows/highs being revisited during backtesting period are tracked for each print. Peak increase/decrease during backtesting period is also recorded and added to average calculations. Liquidity prints can also be backtested using any script that has a source input, including mechanic strategies utilizing Tradingview's native backtester.
Key takeaways
Liquidity prints are activated when price is showing signs of grind against path of greater resistance, leaving path of least resistance to the opposite direction.
Liquidity prints with ideal attributes are marked separately as print confluence, giving further color into print strength and duration of influence.
Liquidity prints are backtested using price rate of change, print invalidation mark and peak magnitude metrics.
Liquidity prints can be backtested and utilized in any other Tradingview script, including mechanic strategies utilizing Tradingview's native backtester.
Liquidity prints are detected using price action based methodology. They principally work on any chart or timeframe, including charts with no volume data.
Liquidity prints are activated real-time after a confirmed bar close and are not repainted.
For practical guide with practical examples, see last section.
Accessing script 🔑
See "Author's instructions" section, found at bottom of the script page.
Disclaimer
Liquidity prints are not buy/sell signals, a standalone trading strategy or financial advice. They also do not substitute knowing how to trade. Example charts and ideas shown for use cases are textbook examples under ideal conditions, not guaranteed to repeat as they are presented. Liquidity prints notify when a set of conditions (various reversal patterns, overextended price etc.) are in place from a purely technical standpoint. Liquidity prints should be viewed as one tool providing one kind of evidence, to be used in conjunction with other means of analysis.
Liquidity print quality is backtested using metrics that reasonably depict their expected behaviour, such as historical likelihood of price slowing down or turning shortly after a print. Print quality metrics are not intended to be elaborate and perfect, but to serve as a general barometer for print feedback. Backtesting is done first and foremost to exclude scenarios where prints clearly don't work or work suboptimally, in which case they can't be considered as valid evidence. Even when print metrics indicate historical reactions of good quality, price impact can and inevitably does deviate from the expected. Past results do not guarantee future performance.
- Example charts
Chart #1: BTCUSDT
Chart #2: DXY
Chart #3: NQ futures
Chart #4: Crude oil futures
Chart #5: Custom timeframes
- Print confluence
Attributes that make prints ideal in one way or another are marked separately as print confluence, giving clue into potential strength and duration of print influence. Prints with important or multiple confluence factors can be considered as heavier and more reliable evidence of price being on a path of resistance. Users can choose which confluence to show/hide (by default all) and set a minimum amount of confluence for confluence text to activate (by default 1).
Confluence type #1: Trend extensions
Price trending for abnormally long time doesn't happen too often and requires effort to sustain. Prints taking place at extended trends often have a longer duration influence, indicating a potential larger scale topping/bottoming process being close. Trend extension confluence is indicated using a numbered label, equal to amount of bars price has been in a trending state.
Confluence type #2: Consecutive prints
Prints that take place consecutively imply heavier resistance ahead, as required conditions trigger multiple times within a short period. Consecutive prints tend to lead to more clean, aggressive and heavier magnitude reactions relative to prints with no confluence. Consecutive print confluence is indicated using a numbered label with an x in front, equal to amount of prints that have taken place consecutively.
Confluence type #3: Deviations
When price closes above/below prior print highs/lows and closes right back in with a print, odds are some market participants are stuck in an awkward position. When market participants are stuck, potential for a snowball effect of covering underwater positions is higher, driving price further away. Prints into deviations act similarly to consecutive prints, elevating potential for more aggressive reactions relative to prints with no confluence. Deviation confluence is indicated using a label with a curve symbol.
- Backtesting
Built-in backtesting is based on metrics that are considered to reasonably quantify expected behaviour of prints. Main purpose of the metrics is to form a general barometer for monitoring whether or not prints can be viewed as valid evidence. When prints are clearly not working optimally, one should adjust expectations accordingly or take action to improve print performance. To make any valid conclusions of print performance, sample size should also be significant enough to eliminate randomness effectively. If sample size on any individual chart is insufficient, one should view feedback scores on multiple correlating and comparable charts to make up for the loss.
For more elaborate backtesting, prints can be used in any other script that has a source input, including fully mechanic strategies utilizing Tradingview's native backtester. Print plots are created separately for regular prints and prints with each type of confluence.
Print feedback
Print feedback is monitored for 3 bars following a print. Feedback is considered to be 100% successful when all 3/3 bars show a supportive reaction. When 2/3 bars are supportive, feedback rate is 66%, 1/3 bars = 33% and 0/3 = 0%. After print backtesting period is finished, performance of given print is added to average calculations.
Metric #1 : Rate of change
Rate of change used for backtesting is based on OHLC4 average (open + high + low + close / 4) with a length of 3. Rate of change trending up is considered valid feedback for bullish liquidity prints, trending down for bearish liquidity prints. Note that trending rate of change does not always correlate with trending price, but sometimes simply means current trend in price is slowing down.
Metric #2 : Invalidation mark
Print invalidation marks are set at print low/high with a little bit of "wiggle room". Wiggle room applied is always 1/10th of print bar range. E.g. for a bullish print with bar range of 2%, invalidation mark is set to 0.20% below print low. For most prints this is practically at print low/high, but in the case of prints with high volatility a more noticeable excess is given, due to the expectation of greater adverse reaction without necessarily meaning invalidation. A low being above invalidation mark is considered valid feedback for bullish prints and a high being below invalidation mark for bearish prints.
Metric #3 : Peak increase/decrease
Unlike prior two metrics, peak increase/decrease is not feedback the same way, but rather an assisting factor to be viewed with feedback scores. Peak increase/decrease is measured from print close to highest high/lowest low during backtesting period and added to average calculations
Feedback scores
When liquidity prints are working optimally, quality threshold for both feedback metrics are met. By default, threshold is set to 66%, indicating valid feedback on 2/3 of backtesting periods on average. When threshold is met, a tick will appear next to feedback scores, otherwise an exclamation mark indicating suboptimal performance on either or both.
By default, the prints are filtered as little as possible, idea behind being that it is better to have more poor prints filtered with discretion/mechanically afterwards than potentially filtering too much from the get go. Sometimes filtering is insufficient, leading to failed reactions beyond a tolerable level. When this is the case, print sensitivity can be adjusted via input menu, separately for bullish and bearish prints. Print filter sensitivity ranges from 1 to 5, by default set to 1. Lower sensitivity sets looser criteria for print activation, higher sensitivity sets stricter criteria. For most charts and timeframes default sensitivity works just fine, but when this is not the case, filters can be tweaked in search of better settings. If feedback score threshold is met, it's better to keep filter sensitivity intact and use discretion, which is much more nuanced and capable than any mechanical process. If feedback scores are still insufficient after tweaking, depending on the severity of lack, prints should be vetted extra carefully using other means of analysis or simply avoided.
Verifying backtest calculations
Backtest metrics can be toggled on via input menu, separately for bullish and bearish prints. When toggled on, both cumulative and average counters used in print backtesting will appear on "Data Window" tab. Calculation states are shown at a point in time where cursor is hovered. E.g. when hovering cursor on 4th of January 2021, backtest calculations as they were during this date will be shown. Backtest calculations are updated after backtest period of a print has finished (3 bars). Assisting backtest visuals are also plotted on chart to ease inspection.
- Alerts
Available alerts are the following.
- Bullish/bearish liquidity print
- Bullish/bearish liquidity print with specified print confluence
- Bullish/bearish liquidity print with set minimum print confluence amount exceeded
- Visuals
Visual impact of prints can be managed by adjusting width and length via input menu. Length of prints is available in 3 modes (1-3 from shortest to longest) and width in 10 modes (1-10 from narrowest to widest).
Print confluence text can be embedded inside print nodes, eliminating visuals outside the chart.
Metric table is available in two themes, Classic and Stealth.
Metric table can be offsetted horizontally or vertically from any four corners of the chart, allowing space for tables from other scripts.
Table sizes, label sizes and colors are fully customizable via input menu.
-Practical guide
Key in maximizing success with prints is knowing when they are likely reliable and when not. In general, the more volatile and ranging the market regime, the better liquidity prints will work. Any type of volatile spike in price, parabola or a clean range is where liquidity prints provide optimal feedback. On the other hand low volatility and trending environments are suboptimal and tend to provide more mute/lagged or completely failed feedback. Anomalies such as market wide crashes are also environments where prints can't be expected to work reliably.
Being aware of events on multiple timeframes is crucial for establishing bias for any individual timeframe. Not often it makes sense to go against higher timeframe moves on lower timeframes and this principle of timeframe hierarchy also applies to prints. In other words, higher timeframe prints dictate likelihood of successful prints on lower timeframes. If hard way on a weekly chart is up, same likely applies to daily chart during weekly print influence time. In such scenarios, it's best to not swim in upstream and avoid contradicting lower timeframe prints, at least until clear evidence suggesting otherwise has developed.
Points in price where it anyway makes sense to favor one side over the other are key points of confluence for prints as well. Prints into clean range highs/lows with clean taps can be valuable for optimal entry timing. This is especially true if simultaneously previous pivot gets taken out, increasing odds of liquidity indicated by a print being swept stop-losses.
Prints that don't match underlying bias (e.g. bullish prints at range high, bearish prints at range low) should be avoided until clear evidence has developed favoring them, such as a convincing break through a level followed by a re-test.
Prints that are immediately rejected aggressively are more likely prints that end up failing. Next bar following a print closing below print lows/above print highs is a strong hint of print failure. To consider print still valid in such cases, there should be quick and clear defending of print lows/highs. Failed prints are an inevitable bummer, but never useless. Failed prints are ideal for future reference, as liquidity still likely exists there. Re-tests into these levels often provide sensible entries.
Stacked confluence doesn't come too often and is worth paying special attention to, as multiple benefitting factors are in place simultaneously.
From a more zoomed out perspective, any larger zone with multiple prints taking place inside are potential topping/bottoming processes taking place, also worth paying attention to.
Buyside/Sellside Liquidity [Real-Time] (Expo)█ Overview
Buyside/Sellside Liquidity (Expo) is an indicator that identifies buy-side and sell-side liquidity in real time. Buy-side liquidity represents a level on the chart where short sellers will have their stops positioned. Sell-side liquidity represents a level on the chart where long-buyers will place their stops. These levels are found in areas where traders are "proven wrong" and, therefore, want to get out of their trades. Smart money will accumulate or distribute positions near these levels where many stops are placed and absorb all provided liquidity.
█ What is Buy-side and Sell-side liquidity?
Liquidity is the ability of a market to absorb large orders without significantly affecting the asset's price. Buy-side liquidity refers to the ability of buyers to buy large amounts of contracts without significantly affecting the price. Sell-side liquidity refers to the ability of sellers to sell large amounts of contracts without significantly affecting the price. This type of liquidity is important for large institutional investors, such as hedge funds and investment banks, who need to buy/sell large amounts of contracts without significantly affecting the price.
█ How to use
The price will always seek liquidity to either reverse or continue in the current move.
Reversals
Reversals are common around these levels since many traders are forced to close their positions, pushing the price in the other direction. Look for price actions that confirm a reversal around those levels.
Continuations
Liquidity is also a must for a trend to continue. If the price pushes through the liquidity levels and the current order flow structure is intact, traders should look for a continuation setup.
Inducement
Inducement is the act where smart money manipulates the price to access liquidity. Buy-side and Sell-side liquidity levels can be used to identify potential areas of inducement.
-----------------
Disclaimer
The information contained in my Scripts/Indicators/Ideas/Algos/Systems does not constitute financial advice or a solicitation to buy or sell any securities of any type. I will not accept liability for any loss or damage, including without limitation any loss of profit, which may arise directly or indirectly from the use of or reliance on such information.
All investments involve risk, and the past performance of a security, industry, sector, market, financial product, trading strategy, backtest, or individual's trading does not guarantee future results or returns. Investors are fully responsible for any investment decisions they make. Such decisions should be based solely on an evaluation of their financial circumstances, investment objectives, risk tolerance, and liquidity needs.
My Scripts/Indicators/Ideas/Algos/Systems are only for educational purposes!

Liquidity sweep (Redcrabice)This script was created by Redcrabicefx
this indicator was created to indicate price has broken a certain level of HIGH/LOW, this was created to assist me in identifying the Liquidity sweep of internal and external liquidity for entry confirmation.
Green label = sweep 5-10 previous High/Low
Blue label = sweep 15 - 20 previous High/Low
Purple label = sweep 50 previous High/Low
Orange label = sweep 100-200 Previous High/Low
Red/Black label = sweep +500 Previous High/Low
if price has only sweep 75 candles, it will only show purple label (50) since it has not reached Orange level (100) yet
you can also choose your color of choice for the LQ sweep lines in the setting.

ICT LIQUIDITY indicator [Focused Trader]This indicator allows you to draw liquidity according to ICT. Specifically, you can choose to draw liquidity for specific sessions (Asia,New York,London).
Filtering by session
You can chooose to display only liquidities created in specific session. For example, the favourite liquidity is that of Asia. And then, in London market usually grabs it. So you set to display only liquidites of asia.
Session background
You can also display background over specific session, this is very usefull to see how market behaves - liquidity created in Asia is very often taken in London session. You can use any colour you'd like.
Colouring and style of lines
There is an option to choose colour for liquidity lines from different sessions and also choose specific colour for highs and lows. You can also set different styles (dash, dot, arrow, ...) of liquidty lines.
Liquidity Raid - Stop HuntLiquidity Raid - Stop Hunt
The market always seeks liquidity. Liquidity rests above previous highs and below previous lows as many traders see these as obvious points to place their stops. These are areas in the chart where many orders are placed together and serve as tipping points for market makers.
The script marks the breach of a market structure high/low with a vertical line. The script has the option to show the current W,D,4H & 1H market structure high and low.
How to use:
Once a raid occurs, use a higher timeframe to search for high probability supply and demand zones. Price needs to react to something. You may have multiple breaches before a reversal happens as price is likely looking for fresh(untested) zones. So don't trade blindly.
A good understanding of supply and demand concepts, odds enhancers, and how to identify fresh levels is expected to utilise it's full potential.
Lines and colours are all customizable
Alerts function included.
Indicator in use:

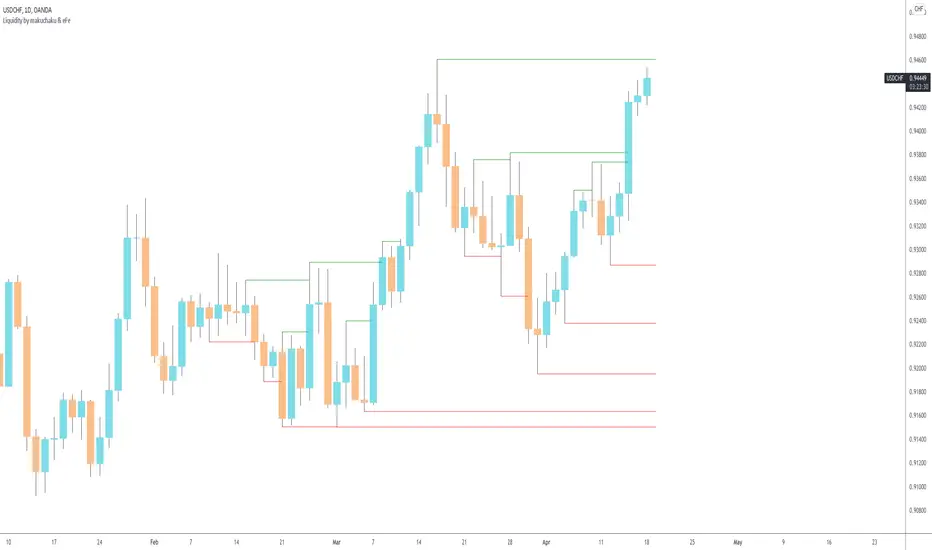
Makuchaku's trading tools - Liquidity visualizerThis indicator plots those pivots/fractals which have not been taken out by price, whereby showing where are the clusters of highs/lows where stop orders (or liquidity) could be hiding.
This is a fantastic tool for taking reversal trades.
Liquidity RaidThe market always seeks liquidity. Liquidity rests above previous highs and below previous lows.
The script highlights the breach of a market structure high or low (W/D/4H/1H), and will alert you on the first fractal break in the opposite direction.
The idea is that the raid happens, and you are only alerted once a candle breaks a fractal and closes in the opposite direction.
When a signal is printed, it does not mean to enter immediately. It just means that there is a fractal break in the opposite direction, and that you will need to assess current price action and market structure for a potential trade on pullback.
You still need to take HTF directional bias, market structure, order blocks and imbalances into consideration.
The script is for trading on on smaller time frames (1/2/3/5m).
Fractal periods, lines and colours are all customizable
