unrealized pnl for btcusdt (or any linear perp)haven't seen this published, so i made it to watch my position while looking at my TV chart
right now, code works for just linear contracts (base currency margined, not quote currency) and i will have to add the code for inverse perps soon in the next update
very simple tool... not much to explain
just enter
long or short
average entry
position size (designed for btc since i'm a maxi, but entering the amount of any base currency should work)
take profit
then you'll get candles for your position and a line for your TP (and its amount)
next version will add a feature to plot inverse perps
(sorry TV if this doesn't abide by the House Rules exactly)
Long!!!!

Cipher Twister - Long and ShortINTRO / NOTES:
This script is based on Market Cipher B Oscillator by Falcon
The difference in this script is that only the useful points are printed on the indicator, namely Long and Short Trade Execution signals to be used by a bot, namely the PT Bot.
The script also differs from the original that it has been upgraded to Pinescript v4
This oscillator can be used with ALL time frames, but generally works the best on 15 minute and 1 hour charts on ANY market, no matter, stock, forex, crypto, spot, futures, derivatives, Nasdaq etc...
DEFINITIONS:
This oscillator forms the foundation of Buy and Exit of Long and Short Trades.
There are 2 'Red' Lines at the top of the channel and 2 Green Lines at the bottom of the channel.
These two channels are set at default to be +53 / -53 and +60 / -60 respectively. These two lines will serve as the threshold point if one is to make cautious trades only.
There is a center line which divides the Oscillator into two parts. Above the center line, the market is in over bought territory and Below the center line is in over sold territory.
'Red' dots are drawn by the indicator to represent a potential Short (or a signal to exit from a Long position)
'Green' dots are drawn by the indicator to represent a potential Long (or a signal to exit from a Short position)
The 'Red' and 'Green' dots are draw when a Cross between both wt1 & wt2 cross, thus providing a fantastic indication of potential trend reversal and entry/exit of a position.
STRATEGY NOTES:
The strategy to use this indicator with for realistic and proper results would be to use it with an automated Trading Bot such as Profit Trailer (PT-BOT)
You could use this strategy manually, however it would mean you would need to sit in front of the screen all day and night long and activate the trades immediately after the 'red'/'green' dots are drawn. Usually this will result in non-optimal entries and exits as well as loss on various instances when a 'red' and 'green' dot are printed close together (which is usually when the market goes into correction/consolidation) and slow entries/exits will result in a loss rather than a small profit or exit at BE (Break Even)
ACTUAL STRATEGY (For use with automated bot)
To be used in conjunction with Heikin Ashi Candles for added cautionary measures
For LONGs ONLY
--------------------
1/ When 'Green' dot is drawn, ACTIVATE Long Position
(Use 1.5% Risk Management for each trade)
(Use Lot size based on 1.5% risk management and xLeverage (if any))
2/ Make sure bot Opens an SL (Stop Loss) value based on 1.5% Risk Management
3/ When 'Red' dot is drawn, CLOSE Long Position.
*If you want to add extra caution to your trade, only activate the trade if the 'Green' dot is BELOW the 'Green' Markers
*For added caution, use color coded Heikin Ashi candles to 'confirm' Activation and Closing of a trade in the bot configuration
---------------------------------------------------------------------------------------------------
For SHORTs ONLY
--------------------
1/ When 'Red' dot is drawn, ACTIVATE Short Position
(Use 1.5% Risk Management for each trade)
(Use Lot size based on 1.5% risk management and xLeverage (if any))
2/ Make sure bot Opens an SL (Stop Loss) value based on 1.5% Risk Management
3/ When 'Green' dot is drawn, CLOSE Short Position
*If you want to add extra caution to your trade, only activate the trade if the 'Red' dot is Above the Red Markers
*For added caution, use color coded Heikin Ashi candles to 'confirm' Activation and Closing of a trade in the bot configuration
---------------------------------------------------------------------------------------------------
Supplementary Notes:
Make sure that your bot configuration will only activate ONE TRADE when the 'Green'/'Red' dot appears.
Occasionally during high volatility , 'red'/'green' dots will appear intermittently before remaining drawn, thus the oscillator 'redraws' the dots during market movement.
There will be times where occasionally a 'green' dot or a 'red' dot will appear, the trade will be opened, but the trade will fail due to the market manipulation (algorithm/market maker bots/fake volume etc), to wipe out those trading on derivatives and futures markets using leverage. Do not worry about this, no bot can make 100% wins, no strategy will achieve 100% win ratio and one necessarily doesn't need a high win ratio when using strict money management practices with your trading for SL and lot size.
If you use this method, you will see great results, but again I must stress, using this method with a fully automated bot is the only way to achieve proper results.

Cheat Code- Example 1; Short-Term; Follow the Trend BINANCE:BTCUSDT ; BINANCE:ETHUSDT ; BINANCE:FILUSDT ;
This strategy is simple and easy to read and takes advantage of conditional signs of trend reversals. It works best in 10-minute time frames for most large and mid-cap crypto. This code is a tutorial for creating a profitable yet easy strategy, and hopefully, it can be put to good use :)
Mean reversionSimple mean reversion strategy.
Strategy aims to find three bullish or bearish candle pattern which ends with strong move. Position will be open until we get close above previous highs.
Strategy uses also simple moving average to filter short positions.
This strategy works well with QQQ and daily time frame but it seems to do fairly well intraday also.
User can modify moving average length and how strong is the move of the last candle.
This strategy is inspired a strategy by hackertrader. The original idea by QuantpT.

Cross 2 Emas + Pullbackhello
it's not financial advice and It's your responsibility to win and lose with this strategy.
also, there is no benefit for publisher at all if you win or lose a trade.
and this strategy is working only in 4h timeframe, and I didn't test or check for other timeframes!
.........
this strategy is based on two EMAS crossing each other and waiting for the price to pull back on fast ema(ema with lower length).
so basically , when EMA 50 crosses up with the EMA 100 , we are looking for a long and waiting for the price to touch the EMA 50.
.........
the Strategy is based on 100% equity because personally I use small budget for each ROBOT(like 100$)
the initial capital = 100$
order size = 100% of equity
commission = 0.1%
trade start time = 2021.1.1
.........
settings
1.Stop loss ATR = (your number * ATR ) + stoploss
2.RR = Risk / Reward
3.ATR length = ATR setting (7,9,14)
4.Emas setting = you can choose the EMA length
for exp : if you want EMA 25 and 75 , fill the fast ema length with 25 and 75 for slow ema length
5.Time : you can tell the strategy to trade from which time to which time
exp : 2021.1.1 to 2022.1.1 or 2019.1.1 to 2021.1.1
6.long or shot : if you deactivate the long , it will trade only short.(same thing for short)(strategy trade both sides by default)
7. you can remove the labels and Table from menu as well
.........
cross
when EMAS cross each other , you will see Dimond shape (as you know you can change the shape and color)
........
Table
when we are in a position , we can see a table like this which shows us the percent and value of the Stop loss and target price.
short
long
........
E/SL/TP
E = Entry Line
SL = Stoploss line
TP = Target Price
(you can also remove labels in setting)
......
my goal is to upgrade this strategy with your ideas.
not financial advice !
please , share your ideas with me to improve the strategy
I would like to see what do you think about this strategy <3
have a great day.

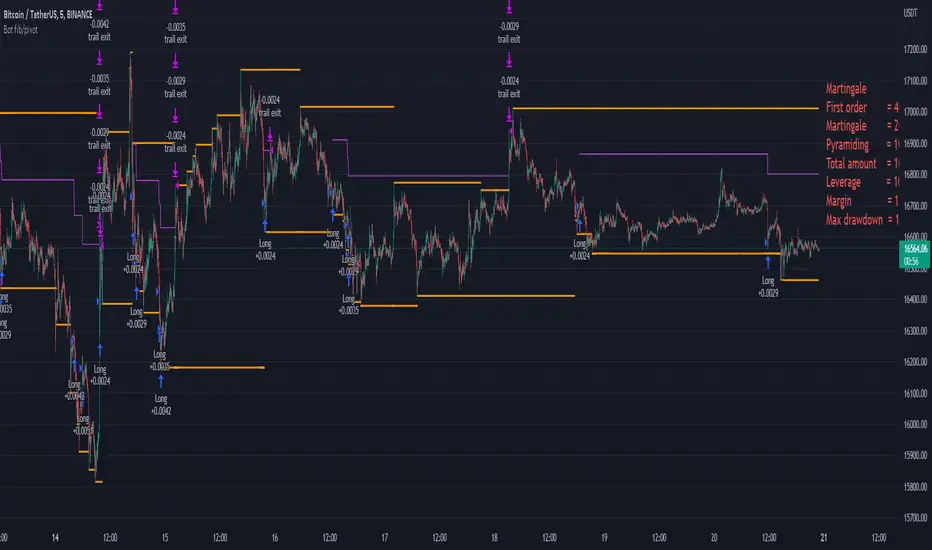
Bot fib/pivot Hello, friends!
This strategy is based on the fibonacci level you choose in the setup and possible pivot points under the control of Williams’ Percent Range.
Williams' Percent Range is a dynamic indicator that detects overbought/oversold conditions.
When the possible reversal points coincide with the fibonacci level, and the high or low points according to Williams also coincide, then an entry occurs.
One of the oldest and most reliable trading tools are widely used support and resistance levels.
In this strategy, we are trying to find these reversal levels based on fibonacci.
//LOGIC ENTRY SETTINGS
Deviation-deviation from the pivot point, the lower this figure, the more entries. The yellow lines on the chart are pivot points.
Fibonacci lvl-fibonacci level, from which the entry will occur, provided that other conditions match
Highest lookback-The setting, which refers to Williams' Percent Range , looks at how many candles ago, was high or low. The smaller the number, the larger, but less accurate inputs.
//AMOUNT(USDT) FIRST ORDER AND > % NEXT
-Martingale first order (the amount of the entrance to the usdt) / next order (Increase of each subsequent order as a percentage)
//EXIT SETTINGS (%, RSI)
-Use RSI for close position? (the position will not be closed if it is in the red, even if the RSI conditions worked)
-Use % for exit? Exit immediately upon reaching the specified percentage
-Use trailing? When the checkbox is checked, the position will be exited by trailing.
Activation trail,after?- When the specified percentage is reached, trailing is activated!
Stop_trail,%- if the last candle falls from the high (after the trailing is activated), the position will be exited.
For example:
We entered the purchase at 100 per asset, activation costs 10, and stop is 2.
the price reached 110, there was an activation, after that it went up to 120, and from the high of the last candle, a 2% drop occurs and the trade is exited.
PS:The default value is 1%, what does this give us? if there is a sharp increase, then we take away all the movement
Use only long?
Allow long?- Only long trades will be displayed
Allow short? Only short trades will be displayed
Allo reverse? Upon receipt of a return signal, the opposite position will be closed.
//MARTINGALE GRID
If there is a check mark in the line "Use martingale and grid?"
then the grid will be active
If there is a check mark in the "Limit each next entry,%?" then, even if the entry from the bot logic is triggered, and the price does not fall by the specified percentage, then there will be no entry!
If there is a check mark in the "Grid,%" column, then purchases with martingale support will be added with a decrease by the specified percentage!
PS: "Grid" always starts anew, as the input from logic triggered!
//FILTER SETTINGS
1) Use filter oscillator? (The filter uses 7 averaged oscillators)
Period-the period for which you will be billing
Upper line-Short entry border.
(if 40, then there will be no entry until it reaches)
Lower line-Long entry border.
(20 until below 20 no entry)
2)Use filter range?
Filter type-moving average selection
Bars back-offset speed based on number of last bars
Period-period to calculate
3)Use filter supertrend?
Supertrend filter with multitimeframe
// How do filters work 2 and 3?
Filters can work either one by one or together.
A trade is entered when conditions from the logic and filters in the red zone are triggered, when there are no entries in the green zone.
//DATA RANGE:
-Testing results for any period of time
//PIRAMIDING
-Also in the settings there is a pyramid of order, keep this in mind. Make a deal for a small part of the deposit, and not for all the money at once!
PS: to use martingale, you need to write in the hook messages:
"amount": "{{strategy.order.contracts}}" (purchases will be in the amount of coins equivalent to USDT)
The default settings for TF are 1 minute, 10 inputs.
You can choose your settings for any TF, but look at different coins to make sure you have good statistics
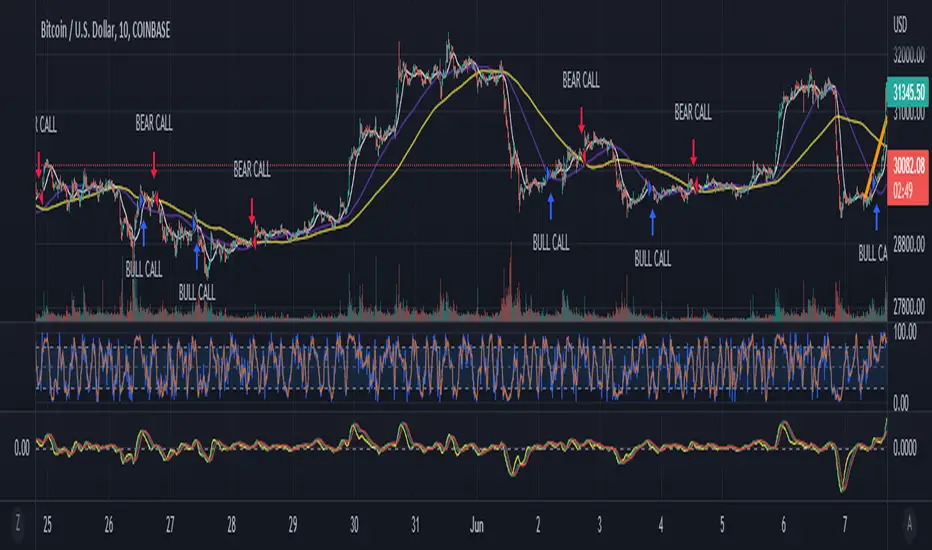
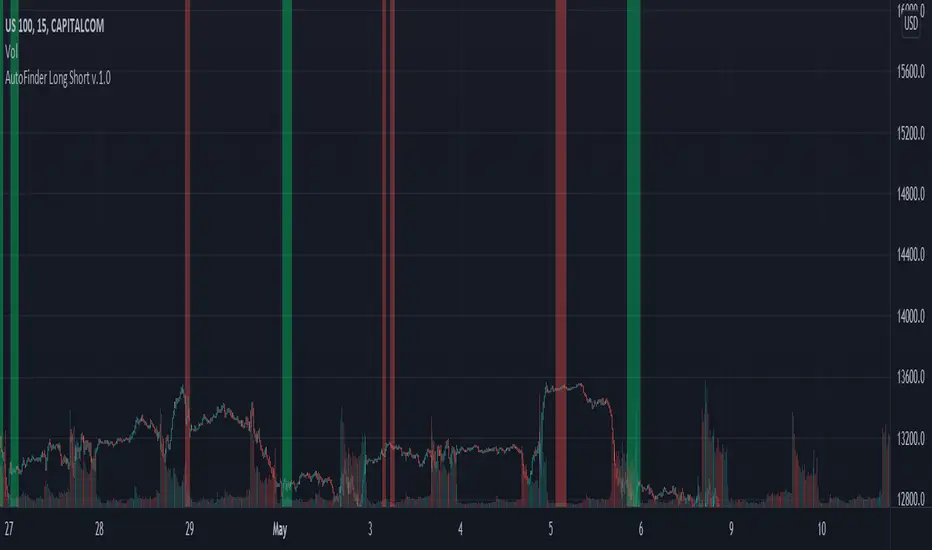
AutoFinder Long ShortAutoFinder Long Short
A simple script. It only advice you when MACD is calling for Long or Short.
You can choose your range period to find highest and lowest moment on MACD. (suggested 150 or more)
Also you can choose % for detect the change of the trend. (suggest between 70-90)
You can test what really happen moving indicator on new panel and enabling MACD Plot from settings.
Enjoy
Pre-ScalperHello all,
It is an artificial intelligence indicator that can generate future predictions based on trend tracking and historical data analysis.
It will be in a period of continuous improvement to achieve the highest success rates.
You can use in all market in all time period.
This indicator does not contain any investment advice, it is only a helpful tool in your investments.
BINANCE:AAVEUSDTPERP

Crypto Correlation Strategy based on Technical Ratings This is a swing trading crypto correlation strategy, based initially on technical ratings but adapted to the entire crypto market environment , by using as a source of calculations the candle values from CRYPTOCAP:TOTAL.
So since TOTAL, is the sum of all the crypto currencies, its going to be our leader. We will get the entries and exits , internally from it and input them into the crypto coins(more than 80-90% of the usdt perpetual pairs are following the same direction but with a higher volatility), and with this in general is going to give us as much better risk/reward than just by trading 1 coin alone.
So this means that all coins will enter and exit at the same time forom a trade. With this, since sometimes we have sudden big changes in the price form one side to another, is going to break a little this effect and since the initial movements were bigger, it would make us lose less. At the same time it can also make us lose more if the changes happen to soon.
One of the things of this particular idea is we dont have to worry about particular optimizations for each asset/coin.
This scenario has been adapted for 30min timeframe, using 0.1% comission per entry and 0.1% comission for exit from the trade.
I have tested so far with most USDT Perpetual Pairs from binance, and it seems to give good results with most of the pairs.
If you have any question please let me know !

LOKEN (v4) BULLISH SMART MONEYThis indicator is based on Smart Money MCDX
(Pine editor @v4)
Indicator built for cryptocurrencies.
Best for day trading.
The coin seems overbought but still pump? Check this indicator
This indicator help you see when institutional buyer enter/exit trade and is a good combination with RSI + Stochastic RSI .
This indicator focus on buying activity by big players and is built for LONG or SPOT, shorter can still use it to determine when to exit short (if smart money appear on a significant TF you may not enter/stay in a short).
Banker plot show strong buyer activities (appear generally when RSI already overbought but still increasing).
It appear as a Histogram with a color code to better see the fading strength of the institutional activity :
Light Blue Bar = Institutional presence ( bullish )
Green Bar = Pump candle (very bullish ), (Banker > Banker MA)
Orange Bar = Retest candle = natural decline after a growth (Banker < Banker MA)
Black Bar = Down candle = progressive exit of institutional leads to this candle, you must have TP before.
Red Bar = Dump candle = steep decline, the institutional take profit hard. You better be out before that one.
Hot-Money plot show momentum and react fast to price action.
It appear as a filled zone (red or green) depending on the plot position compared to its average.
In a downtrend you may only see this one.
Key-Signals:
"Bullish signal 𓃓" = open a long
"Sell signal 💲" = close the long
I recommend you don't keep all the signals enabled at first.
(feel free to ask me the use of the other signals)
It seemed to me that SMART MONEY MCDX was counter-intuitive and archaic,
So i made this one for personal use,
I'm happy if this indicator helps you,
Have a good trade

WIB & 3WTCThis indicator plots the Weekly inside bar and 3 Weekly tight close.
i : Weekly inside bar
- : Weekly tight close
1. Weekly inside bar (WIB)
Which shows the price contraction where the current bar's range is lower than the previous bar's range
Conditions:
Current bar's low is higher than previous low and high less than the previous bar
Range of the current bar should be at least 30% less than the previous bar (Can be modified in the input settings)
Distance between Current bar's low and 50 D Simple Moving average should be at least less than 5% (Can be modified in the input settings)
sometimes low or high of current bar could be few points fluctuated from the previous so tolerance percentage has been set to 1 (Can be modified in the input settings)
Candle range should not be more than 10%. More the compression in the candle better it is for taking a position
Position:
Long could be initiate when the high of the current bar is broken
2. 3 Weeks Tight Close (3 WTC)
where the last three weeks close are within 1.5% range
Conditions:
Last three weeks close is with in 1.5% range (Can be modified in the input settings)
Position:
Long could be initiated current market price
Note: Below conditions apply for both the patterns
Close should be higher than Moving Average(40)
Volume should be less than Volume moving average(10)
Tip
Candle range is visible in the tooltip by hovering over the plots of WIB and WTC characters
Play with Indicator settings for the study purpose

Daily Scalping Moving AveragesThis is a technical analysis study based on the most fit leading indicators for short timeframes like EMA and SMA.
At the same time we have daily channel made from the last 2 weeks of ATR values, which will give us the daily top and bottom expected values(with 80%+ confidence)
We have 3 groups of lengths for short length, medium length and a bigger length.
At the same time we combine it with the daily vwap values .
In the end we are going to have a total of 7 indicators telling us the direction.
The way we can use it :
The max ratings that we can have are +7 for long and -7 for short
In general once we have at least 5 indicators(fast and medium ones) giving us a direction, there is a high chance that we can scalp that trend and then we can exit either when we will be at +7 or close to neutral point
At the same time is very important to be aware of the current position inside of the TOP/BOTTOM channel that we have.
For example lets assume we are at 40k on BTC and our top channel is around 41-42k while the bottom is around 38k. In this case the margin that we have for long is much smaller than for short, so we should be prepared to exit once we reach the top values and from there wait and see if there is a huge continuation or a reversal. If the top channel was hit and the market started the rebounce going downwards and the moving averages confirms it, then we have a huge advantage using the top points as a STOP LOSS and continue the short movements, giving us an amazing risk/reward ratio .
If you have any questions let me know !

Strategy Execution Template - Master PatternThis script is a template to execute your strategy with Stop Loss and Take Profit and showing Trades.
Then, you can write your strategy without taking care of Stop Loss and Take Profit method.
3x Fixed Percent Stop Loss, Trailing Percent Stop Loss, Trailing ATR Stop Loss, Tailing HHLL Stop Loss
3x Fixed Percent, Take Profit

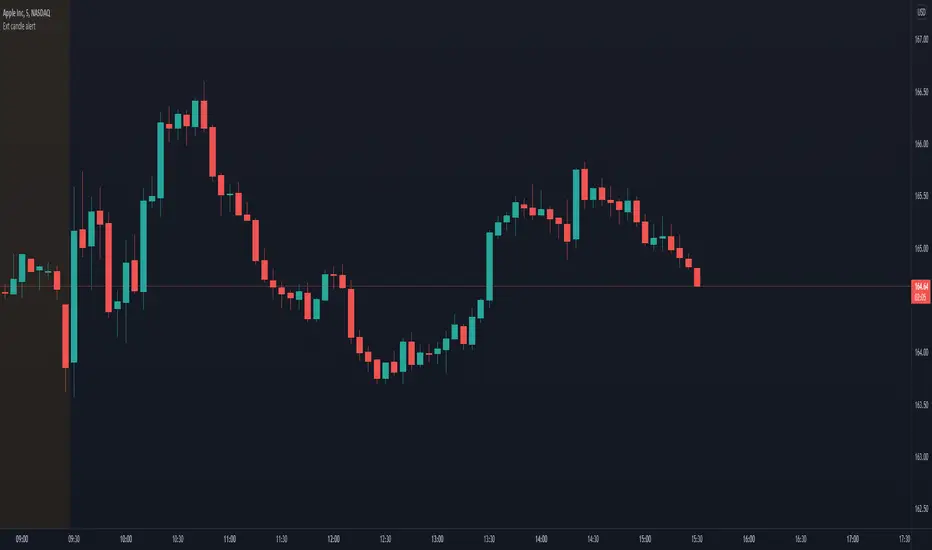
Extended candle alertThis indicator lets you set an alert that triggers when a candle body has got a specific % extension.
Customizable settings
Extension % threshold: the % of the candle extension that has to trigger the alert
Instructions to make it work
Add the indicator to your layout
Set the desidered extension % threshold
Create an alarm (Alt + A)
In the first condition toolbox select "Ext candle alert"
In the second condition toolbox select either long or short condition
Press create (unless you want to change secondary stuff like notification settings)
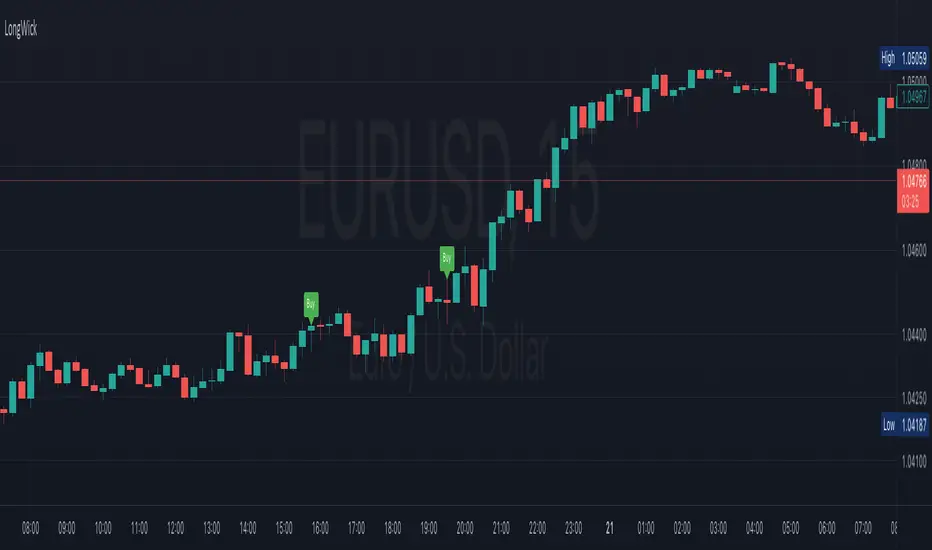
Long WickIt will work on Bank Nifty future only with 2 min time frame. GO Long above candle if the lower wick is more than 50 points and go short below the candle if upper wick is more than 50 points. It will work better with price action.(demand and supply zone)
MoonFlag DailyThis is a useful indicator as it shows potential long and short regions by coloring the AI wavecloud green or red.
There is an option to show a faint white background in regions where the green/red cloud parts are failing as a trade from the start position of each region.
Its a combination of 3 algos I developed, and there is an option to switch to see these individually, although this has lots of info and is a bit confusing.
It does have alerts and there are text boxes in the indicator settings where a comment can be input - this is useful for webhooks bots auto trading.
Most useful in this indicator is that at the end of each green/long or red/short region there is a label that shows the % gain or loss for a trade.
The label at the end of the chart shows the % of winning longs/shorts and the average % gain or loss for all the longs/shorts within the set test period (set in settings)
So, I generally set the chart initially on a 15min timeframe with the indicator timeframe (in settings) set to run on say 30min or 1hour. I then select a long test period (several plus months) and then optimize the wavelcloud length (in settings) to give the best %profit per trade. (Longs always seem to give better results than shorts)
I then, change the chart timeframe to much faster, say 1min or 5min, but leave the indicator timeframe at 1 hour. In this manner - the label only shows a few trades however, the algo is run at every bar close and when this is set to 1min, this means that losses will be minimised at the bot exits quickly. In comparison - if the chart is on a 15min timeframe - it can take this amount before the bot will exit a trade and by then there could be catastrophic losses.
It is quite hard to get a positive result - although with a bit of playing around - just as a background indicator - I find this useful. I generally set-up on say 4charts all with different timeframes and then look for consistency between the long/short signal positions. (Although when I run as a bot I use a fast timeframe)
Please do leave some comments and get in touch.
MoonFlag (Josef Tainsh PhD)

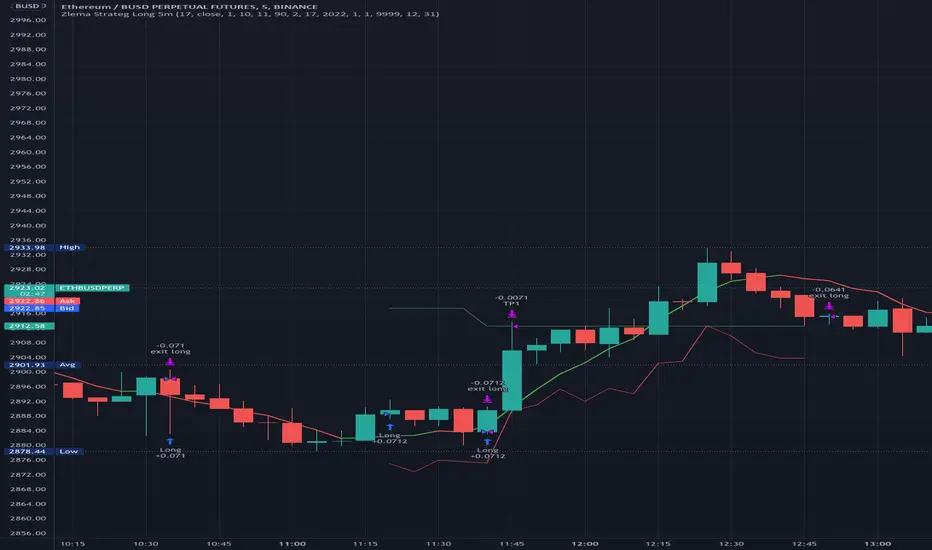
Zlema Strateg Long 5mJust putting this out there.
I created this Strategy based on Everget Zlema.
Opens long trade when Zlema changes color.
It is profitable as it is, but just putting it out to the community to see if someone else has ideas to make it better.
How to make this strategy better?
1. FInd a way to filter ranging bad trades.
2. Trades would be more profitable if entry point had an entry on the candle the zlema changes color.
3. I had to put TP 5 limit, but the optimal would be when the zlema changes color back to red (if ranging trades can we filtered that is).
In any case, just putting it out there, hope it is useful for someone, and I am open to suggestions.
Buy / Sell indicator light version [Crypto_BCT]The indicator is based on the search for the lowest bars in a given period (can be customized).
You can add a search for the highest bars to determine the closed order points.
You can add a filter by the value of the RSI (you can customized it separately for buying and selling).
Alerts for buying and selling are set.
It can be used to work with bots, for example 3COMMAS DCA bot.
--------------------------
Signal Condition Settings:
(Buy) Lowest Bar
The closing of the current bar is lower than the closing of the bars back in this range
(Buy) RSI value <
The RSI index is below this value
(Sell) Highest Bar
The closing of the current bar is higher than the closing of bars in this range
(Sell) RSI value >
The RSI index is higher than this value

BTC 1D Safety tradeImportant: use only the BTC/USD pair on the 1D timeframe
The indicator is designed to determine the zones for entry to buy or sell, as well as for closing deals.
The indicator is based on a moving average with a period of 12.
The parameters are not changeable, since the optimal settings (Safety trade) were used for the BTC/USD pair on the 1D timeframe.
The code is open, please change it according to your parameters.
Upper zones for closing long or opening short.
Lower zones for opening long or closing short.

PriceCatch Bank FD Return LevelHi Tradingview community.
This script would be of interest to those trading Indian stocks in NSE/BSE. It is an open-source script with a simple mandate.
ESTIMATE:
At what price will your long trade yield a return equal to the selected bank's fixed deposit interest rate (1 year).
It will help you to estimate your probable target and whether the set target is at least returning selected bank's fixed deposit interest rate.
USAGE:
Pretty simple. Enter the rate at which you have taken the long entry or drag the price line, any which way. Select the bank whose interest rate you want to calculate the return rate with. Once done, the script will draw a line and give you the price where the return would match the selected bank's fixed deposit interest rate. Then you may manually draw a line at that price level and disable the script.
WHY TO DISABLE?
As the script draws the level on the basis of a particular chosen stock, the line would be irrelevant when you change the instrument. Think of the script as helping you to quickly find the return yield for a specific long trade. Once you know it, no need to keep the script active.
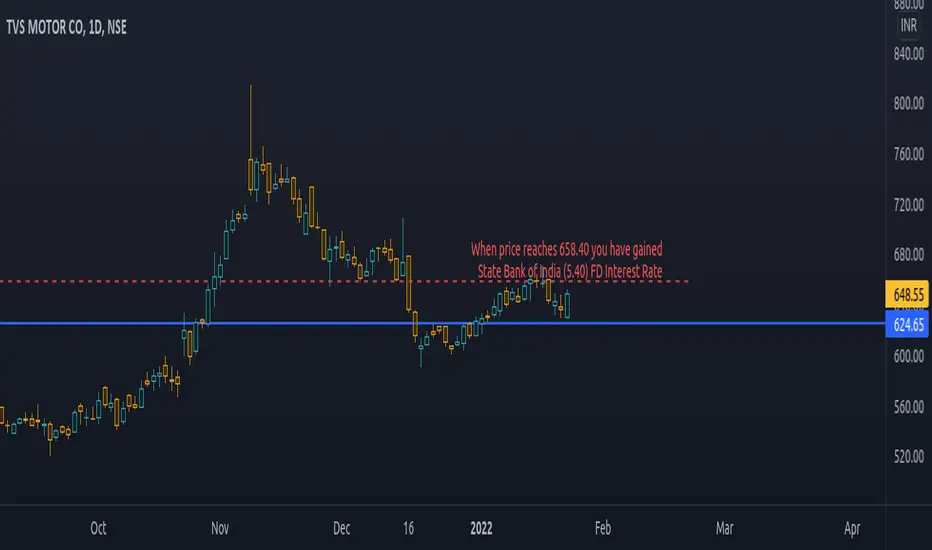
IN THE CHART:
The chart shows that on TVS Motor, a trade taken at 624.65 would have to go up to 658.40 to give State Bank of India's FD interest rate of 5.40 p.a.
Feel free to use and contact if you have any queries/feedback.
All the best with your trading.
PriceCatch
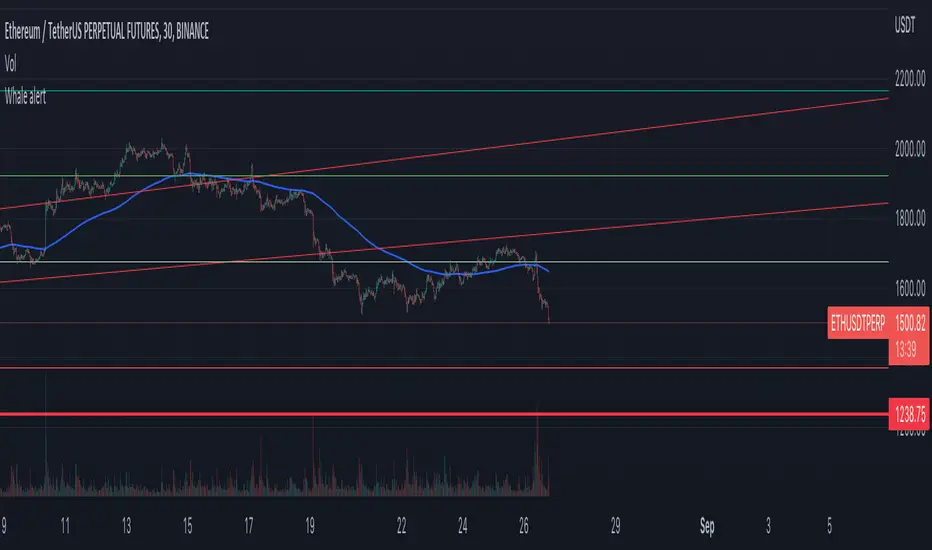
Whale Alert CryptoBase on BTC
Green Tag: Whale buy in/FOMO
Red Tag: Whale build short position (Lighten up)
Purple Tag: just run
Heikin Ashi Candle Startegy for Long PositionThis strategy utilize Heikin-Ashi candlestick chart.
Heikin-Ashi technique is a Japanese candlestick-based technical trading tool that uses candlestick charts to represent and visualize market price data.
Heikin-Ashi candle is essentially taking an average of the movement.
There is a tendency with Heikin-Ashi for the candles to stay red during a downtrend and green during an uptrend.
This strategy only apply for long trading position.
The idea is trader will waiting 3 green candles for validation period (confirmation) before entering long position.
Different timeframe will result different result.
Number of validation period can be changed to see different result
This strategy has parameter for take profit percentage, trailing stop and stop loss.
User can set maximum active position to minimize risk and qty order.
This tool is useful for user who wants to backtest Heikin-Ashi trading strategy.
Script will emit alert when long position is opened and closed.
Warning of Backtesting
Backtesting is backward-looking. As the name implies, you are testing how something would have worked if you traded it perfectly in the past.
Past performance does not indicate future performance and you should not assume it does.
Backtesting assumes you never miss-fire, that you get in and out at the exactly perfect moment each time.
Backtesting assumes you have perfect liquidity, and your limit orders fill at a specific, pre-defined price every time (either the open, close, low, high, or some average of these).
Disclaimer
Do your own research and consider fundamental price of asset.
The indicators provided on this script is for educational purposes only.
Author does not offer advisory or brokerage services, nor does it recommend or advise users to buy or sell particular stocks or securities.
Please examined script and give feedback for further improvement.
Script are open to public, everyone see and clone source code or just apply to chart. Please make comment for improvement.

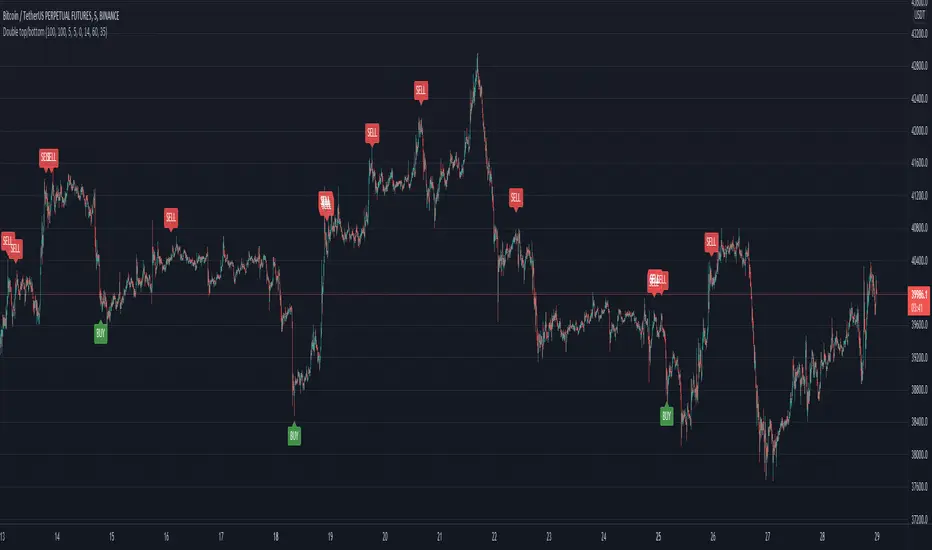
Double top/bottomHello!
This alerts is based on the double bottom pattern - for entering a long position / double top-short
A double bottom pattern is formed when two price bottoms are relatively at the same level and the top acts as resistance. This pattern appears at the end of a downtrend and signals a reversal.
A double top is a bearish reversal pattern that signals the end of an uptrend. It is formed by two price highs forming at the same level and a notch line that acts as local support.
As history and practice show, the double bottom pattern works better. Moreover, in a bull market.
// LOGIC ENTRY:
Period for short and long positions-to search for double bottom as well as double top . the more, the less false.
Change liong and short-channel width for pattern search separately for long and short.
General shift-the overall width of the channel, which changes equally at once for long and short
By default, quiet settings for 1 hour
You can choose the settings you like.
//FILTER SETTING
-RSI
If the checkbox is checked, the filter will be enabled.
The higher the upper bound, the less frequent short entries.
The lower the indicators of the lower border, the less frequent entries to the long