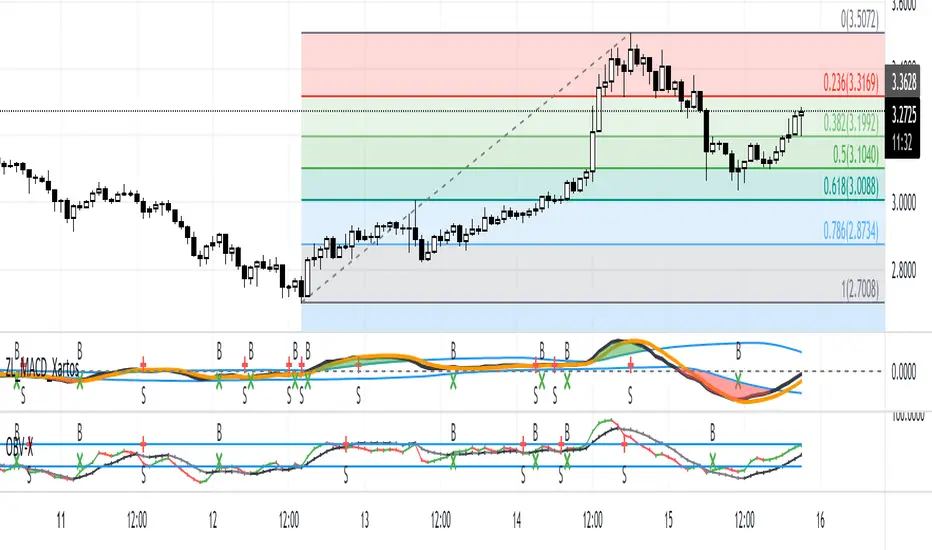
Xartos ZeroLag MACD + MOM Indicatorinspired by Grimmes MACD HIGH LOW indicator,
this script uses ZL MACD for fast adaption to changes. High Low MOM uses EMA instead of sma. HF
平滑异同移动平均线(MACD)
RSI & MACDThis indicator presents standart RSI and MACD indicators in a single indicator. The appearances of these indicators have been modified a little bit and squeezed into one window. To overcome the scale problem the MACD values has expanded with 1000 and divided by the current price to use both indicators in the same scale. Original values could be determined from there. Original Tradingview codes have been used to get full control of graphs.
Bu indikatör RSI ve MACD gösterfgelerini tek bir indikatörde sunuyor. İndikatörlerin görünüşleri bir miktar modifiye edilip iki indikatörğn tek bir pencereden takip edilmesine olanak sağlanmıştır. İki indikatördeki farklı ölçek kullanımından ortaya çıkan ölçek sorunu MACD değerlerinin 1000 ile genişletilip, ürünün güncel fiyatına bölünmesiyle giderilmiştir. Her iki indikatiör için de orjinal Tradingview kodları kullanılmıştır.

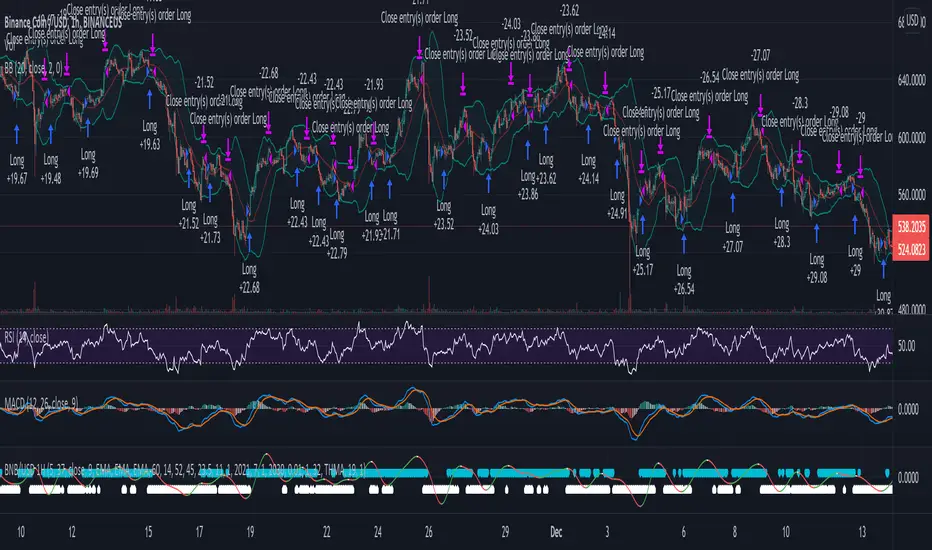
[laoowai]BNB_USDT_3m_3Commas_Bollinger_MACD_RSI_StrategyBNB_USDT _3m
Release Notes:
Time: 3min
Pair: BNB_USDT
Use: {{strategy.order.alert_message}}
What's the difference with 3Commas Bollinger Strategy by tedwardd:
1. Initial capital: 1210 USDT (10$ Base order / 400$*3 Safety order), if you will change, please change JUST safety order volume or number of safety orders 2-3
2. Using just 2(3) safety order (original script 4)
3. More high-performance strategy for BNB_USDT
4. Using MACD to sell order (original script take profit by scale), thanks Drun30 .
5. Using RSI to analyze the market conditions.
Need to change:
bot_id = input(title="3Commas Bot ID", defval=" YOUR DATA ")
email_token = input(title="Bot Email Token", defval=" YOUR DATA ")
---------------------------------------------------------------------------------------------------------------------------------------------------------------------------------------------------
FAQ copy from tedwardd
---------------------------------------------------------------------------------------------------------------------------------------------------------------------------------------------------
This strategy is intended for use as a way of backtesting various parameters available on 3commas.
The primary inputs for the strategy are:
---------------------------------------------------------------------------------------------------------------------------------------------------------------------------------------------------
// USER INPUTS
Short MA Window - The length of the Short moving average
Long MA Window - The length of the Long moving average
Upper Band Offset - The offset to use for the upper bollinger offset
Lower Band Offset - The offset to use for the lower bollinger offset
Long Stop Loss % - The stop loss percentage to test
Long Take Profit % - The Take profit percentage to test
Initial SO Deviation % - The price deviation percentage required to place to first safety order
Safety Order Vol Step % - The volume scale to test
3Commas Bot ID - (self-explanatory)
Bot Email Token - Found in the deal start message for your bot (see link in the previous section for details)
3Commas Bot Trading Pair - The pair to include for composite bot start deals (should match the format of 3commas, not TradingView IE. USDT_BTC not BTCUSDT )
---------------------------------------------------------------------------------------------------------------------------------------------------------------------------------------------------
Start Date, Month, Year and End Date, Month, and Year all apply to the backtesting window. By default, it will use as much data as it can give the current period select (there is less historical data available for periods below 1H) back as far as 2016 (there appears to be no historical data on Trading view much before this). If you would like to test a different period of time, just change these values accordingly.
---------------------------------------------------------------------------------------------------------------------------------------------------------------------------------------------------
Composite bot using a Bollinger band type trading strategy. While its primary intention is to provide users a way of backtesting bot parameters, it can also be used to trigger a deal start by either using the {{strategy.order.alert_message}} field in your alert and providing the bot details in the configuration screen for the strategy or by including the usual deal start message provided by 3commas.
---------------------------------------------------------------------------------------------------------------------------------------------------------------------------------------------------
Original script:
1. 3Commas Bollinger Strategy by tedwardd
2. Momentum Strategy ( BTC /USDT; 1h) - MACD (with source code) by Drun30

CCI Breakout TraderWorks well on Bitcoin or most altcoins on a 15min chart or higher.
What is this exactly?
This is an indicator that uses horizontal RSI + EMA lines with a CCI line on top of it to provide optimal entry and exit positions for trading. There is also a breakout indicator based on the width of Bollinger Bands.
How to use:
If the blue stream passes upwards on the red heading to the white - it's heading towards a good BUY signal. To be safe you wait until it passes above the white line, then BUY LONG. Another signal to buy long is when the blue stream passes above the white and green lines.
Selling is essentially the opposite, if the blue stream is passing down from the green or white lines, then it's time to sell and exit your trade.
If you need help knowing when to enter and exit a trade the indicator will draw a grey candle on your chart to signal it's time to exit a long trade and it will draw a purple candle when it's time to enter a long.
--
Breakout alert:
If you see a green vertical bar it's a warning that there is a potential breakout in price coming for whichever coin you are looking at. The price breakout could go either direction, so make sure you watch the blue stream.
--
Important tips:
The direction of the green/white/red lines are important - if they are heading down that means it might not be the best time to enter your trade, even if the blue stream crosses up on the red and/or white lines.
The colored horizontal lines are there to let you know if the blue stream is near the bottom of those lines (anywhere from hline 15 to 50) and heading upwards, you will more likely have a longer positive trade. If the blue stream is above 60 hline and it looks like a good trade (passing up on the red and white lines), expect to have a shorter trade.
I use this for swing trading various crypto currencies, once you learn how to read it, you can catch amazing uptrends really early and you can exit trades before some big drops happen.

MACD Moving Average Convergence/Divergence - DurbtradeDurbtrade MACD - macd line changes color based on vertical direction. This makes it easier to see and discern movements and also helps the indicator to retain maximum functionality when taking up less chart real estate (also, having the color change really helps me see charts on small screens... such as when it's bright outside and I'm driving in my car and glancing at a chart on my phone... it helps having the info pop visually). A fill option is included to fill the space between the macd and signal lines, though I personally prefer to disable this function. Also, you get a zero line if you want it, and it doesn't extend past the current time, removing unnecessary info and keeping your chart looking a bit cleaner. Finally, there are color-coded, cross-over and cross-under background fills, signaling when the macd line crosses the signal line.
This is my 2nd published script, and 2nd script ever. If you like this style, see my 1st published script: Durbtrade Bollinger Bands Width.
Hope you find this useful.
Feel free to comment.

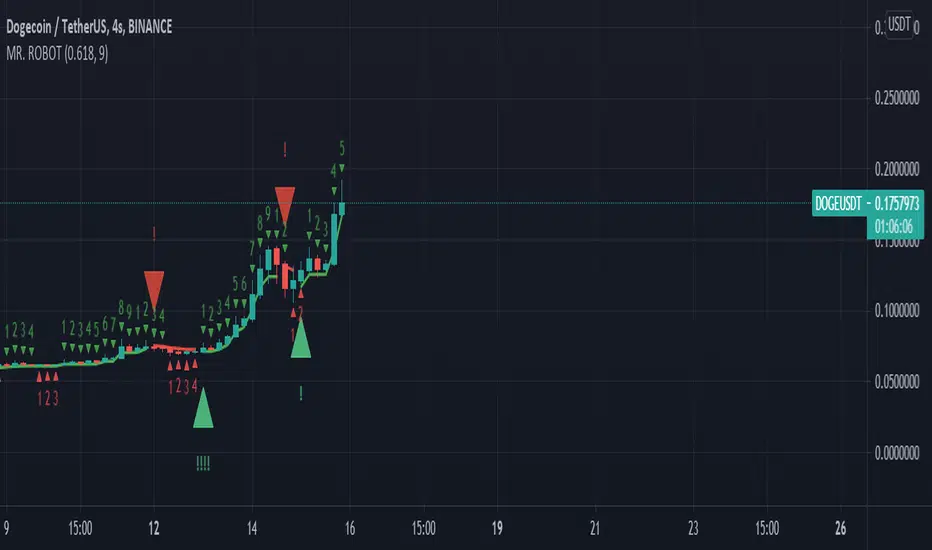
MR. ROBOT v.1.0.0This script consists of a logical blend of TD Sequental, MACD and Stochastic RSI based on the Supertrend function. In addition, these indicators use the golden proportional point of each candle as a source.
The exclamations on the signal indicating signs express the strength of the signal and consist of four levels;
! : Weak level signal
!! : Partial level signal
!!! : Medium signal
!!!! : High level signal
The fact that these interjections refer to four different levels is related to the programmatic consideration of four different indicators and functions. Since the script is based on four different indicators
basically, the exclamation numbers of the signals are related to how many indicators are signaling at the same time. However, it does not always overlap. For example, when 3 indicators signal at the same time, 3 exclamation points may not appear on the signal sign. This is because the script also takes into account special bar algorithms.
The only setting that you can intervene on the script - for now - is the multiplier and length values of the supertrend function. Changing these settings changes the signal strengths and frequencies. The script is based on the supertrend function alone, it is the ability to follow the trend after the signals given by the internal indicators. This situation decreases the rate of false signals and frequent signals in internal indicators.
This script or its author is not responsible in any way for any profits or losses arising from transactions. Does not contain investment advice.
Bollinger Bands strategy with RSI and MACD v1.0 This is a strategy based on the Bollinger Bands, where buy trades are made when the price crosses the lower line of the Bollinger Bands upwards, and sell trades are made when the price crosses the upper line downwards.
In addition, it is possible through the inputs to enable trading with RSI and MACD, so that buy or sell trades are supported by these two indicators.
Trades are partially and fully closed in the following way, a buy trade will close half of the position when the price touches the middle line of the Bollinger bands and will be fully closed when the price touches the upper band. In the case of a sell position, half of the position will be closed if the price touches the middle band and the entire position will be closed when the price touches the lower band. Alternatively, a fixed take profit can be placed. In case the price moves against us, trailing stops can be placed.
In case of selecting to use RSI, MACD, or MACD variation, trades will be executed as long as The Bollinger Bands, and all the above-mentioned indicators give the same signals, either buy or sell.
For example in the case of selecting only Use RSI, buy trades would be made as long as RSI and BB give buy signals.
Strategy inputs:
-BB source: Bollinger Bands price source.
-Bollinger Bands SMA length: Bollinger Bands simple moving average length.
-Bollinger Bands StdDev length: Bollinger Bands standard deviation length.
-Trail Long Loss (%): Distance in percentage at which the stop loss will initially be placed for buy trades.
-Trail Short Loss (%): Distance in percentage at which the stop loss will be initially placed for sell trades.
-Maximum orders: Maximum of simultaneous operations, for example, if it is 3, up to 3 parallel operations of buy and up to 3 parallel operations of sell will be carried out.
-Position size: Number of contracts per trade.
-Use RSI: If selected, the strategy will also trade based on oversold or overbought signals provided by the RSI.
-RSI source: RSI price source.
-RSI period: The RSI period to use.
-RSI value for buy: If the RSI is below this value, it will give a buy signal.
-RSI value for sell: If the RSI value is above this value, it will give a sell signal.
-Use MACD: If selected, buy trades will be made when the MACD crosses 0 upwards, and sell trades will be made when the MACD crosses 0 downwards.
-Use MACD variation: Only available if MACD is previously selected. In this case, buy trades are made if the MACD value in the last 3 candles has been decreasing, and sell trades are made if the MACD value has been increasing.
-MACD source: MACD price source.
-MACD fast length: MACD fast EMA lenght.
-MACD slow length: MACD slow EMA lenght.
-MACD signal length: MACD signal EMA lenght.
-Use maximum TP long: If selected, a fixed take profit will be placed for buy trades. The position could be closed before reaching this take profit if the price touches one of the lower or upper lines first.
-Maximum take profit long (%): Distance in percentage at which the take profit will be placed for buy trades.
-Use maximum TP short: if selected, a fixed take profit will be placed for sell trades. The position could be closed before reaching this take profit if the price touches one of the lower or upper lines first.
-Maximum take profit short (%): Distance in percentage at which the take profit will be set for sell trades.
I hope you like it and as always all feedback is welcome.

Multiple Screeners with AlertsI already published few version of my custom screeners. Unfortunately, because of TradingView's security function call limit you can't use more than 40 stocks in 1 screener.
Fortunately, you can compute multiple values in your function and screen few indicators at once.
In this script I show how you can compute 5 indicators at the same time for 40 instruments. I display then in different labels.
Every label consist of list of instruments satisfying current indicator conditions and a value for it. It can be absolute value as for RSI or -1/1 representing Bullish/Bearish event.
Also you can create 1 alert with result of all screeners inside.
In this example I took 5 indicators with following conditions:
RSI - "RSI < 30" or "RSI > 70"
TSI - "TSI < -30" or "RSI >30"
ADX - "ADX > 40"
MACD - "MACD Bullish Cross" or "MACD Bearish Cross" (1 and -1 in screener)
AO - "AO Crosses 0 UP" or "AO Crosses 0 DOWN" (1 and -1 in screener)
Params
- bars_apart - this parameter define how may bars apart you labels are on your chart. If you see labels overlapping, increase this number.
- Parameters for all used indicators
- 40 symbol inputs for instruments you want to use in this screener
Alerts
You can create an alert from it easily by selecting screener name from the list and then selecting "Any alert() function call".
No additional configuration is required, message and alert on close is generated in the code.
You should better change default name for your alert. Sometimes because of big amount of inputs you might receive an error.
Disclaimer
Please remember that past performance may not be indicative of future results.
Due to various factors, including changing market conditions, the strategy may no longer perform as good as in historical backtesting.
This post and the script don’t provide any financial advice.

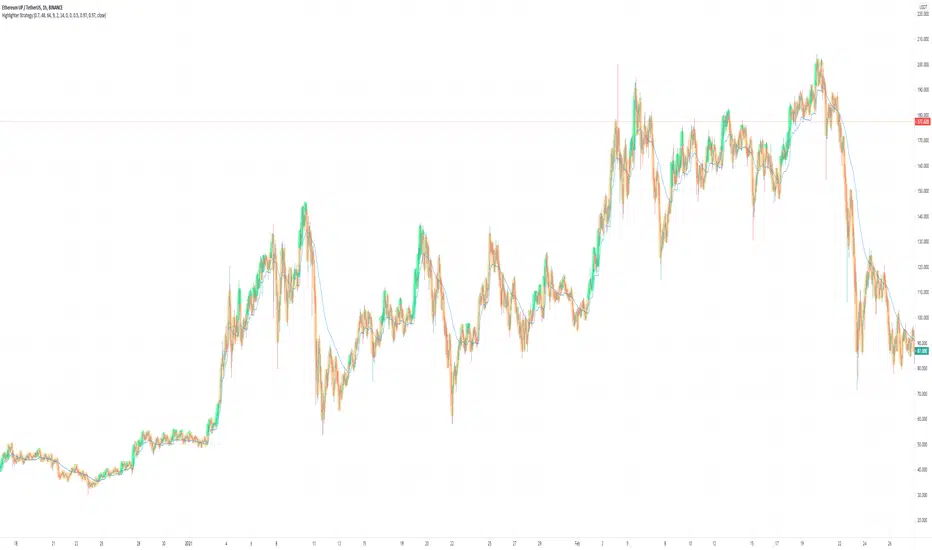
Highlighter Strategy V2// Based on Normalized Smoothed MACD by Dreadblitz
Old one was just an oscillator, I changed a few things
1) It now paints the line green/orange
2) The trigger (green/red) is now based on a signal
3) The signal is basically isUp, but with some additional controls, e.g.
4) (new) There is an embedded stoploss. This is a growth/decay function that decays slower than it grows.
5) Signal is filtered additionally by the stoploss (no green under the decaying line)
Baz: Mcdx+This indicator is based on Relative Strength Index(RSI) with different periods and bases to show the volatility of the price movement. However, this indicator's signal is delayed or based on historical price movement and should not be used as the only buy or sell indicator. Though, it is a useful confimation tool.
*Histogram
Red : Banker volume
Light Red : Weak Banker volume / possibility of unloading
White : Hot money volume
Green : Retailer volume
*MACD crosses
User can choose different type of moving averages and value for fast and slow signal. Default (5ema, 10ema)
Golden cross : Bull force
Dead cross: Bear force
*Diamonds:
Blue : Oversold, RSI < 30
Red : Overbought, RSI > 70
Release Notes:
1. Light red Column to filter out noise
2. Fast and slow moving average signals
3. Disable Offset
4. Enable Banker, Hot money and Retailers moving averages
5. Enable "More Sensitive" Setting
@Credit to Mango2Juice's magic formula

Highlighter StrategyOG COINBASE:BTCUSD
Based on Normalized Smoothed MACD by Dreadblitz
Updated slightly the rules about when it'll take a signal, and made it an overlay so that you see "green" and "red" on the price bar.
Things you might want to do when using it.
- Add a stoploss/trailing stop probably a MA of your choosing.
- Check different time frames to confirm a strong entry

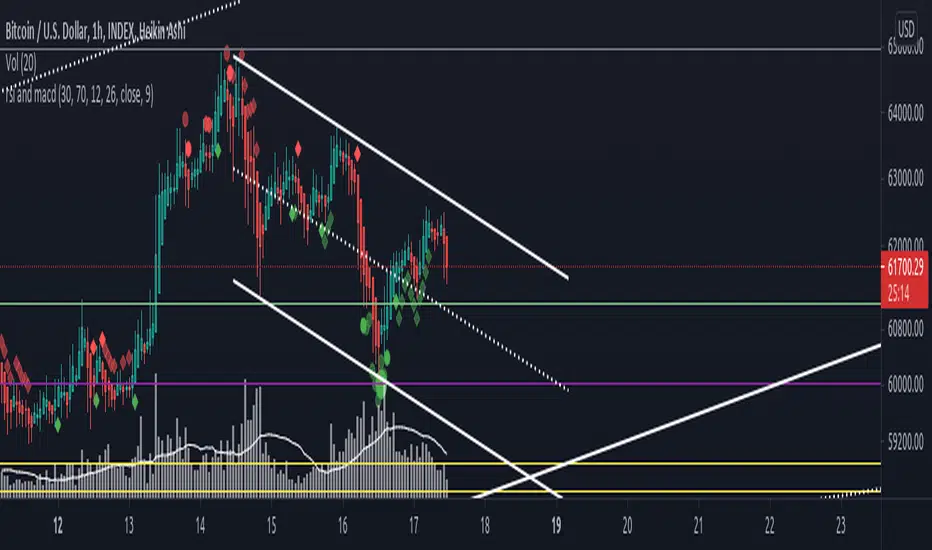
rsi and macdRSI and MACD in the chart:
- small circles -> oversold/overbought
- big circles -> oversold/overbought rising/falling
- small diamonds -> macd over/under signal with macd over/under zero
Please comment if you have an idea to improve it ;)
3commas BNB/USD 1H Strategy*** DISCLAIMER ***
This script is speculative - it uses a highly aggressive model and may not make you money. It has worked well for me so far but you need to do your own DD and make your own decisions. I accept no liability for anything that happens as a result of using this script. Use this at your own caution.
My first published work! I took a few concepts I found in other scripts, tweaked them to match what I had in mind, added some ideas of my own and then added 3commas hooks. Essentially this script is a variable MACD indicator with linear regression and a lot of curve smoothing. It will buy and sell like any other MACD indicator, though it won't exactly match the MACD line you will see on regular MACD indicators due to the smoothing and linear regression. The stop loss should prevent the biggest losses though you will still lose some rounds as this is very aggressive. The parameters I have set up here work best for BNB however feel free to experiment with other coins. The linear regression is set high by default which is what I've found works best for BNB/USD.
Charts should be set to BNB/USD 1HR. I used Binance.us as I was building this but you should have success using other exchanges that offer BNB as well.
This script is set up to use with a 3commas DCA bot though you need access to the entire script in order for that to happen. You can add it and manually place orders or use alarms to test. If you want full access so you can set your 3commas alerts, message me and we can figure something out!
GSO + RSI + MACD + MFI + Bollinger BandsThis script uses a Gann Swing Oscillator , RSI , MACD , MFI and Bollinger Bands to generate long and short signals for cryptocurrencies on the 5 minute chart.
The Gann Swing Oscillator was inspired by HPotter's GSO.
This script is for educational purposes only. This script is NOT to be used as financial advice. I will not accept liability for any losses which may occur as a result of using this script.

MACD oscillator with EMA alert version 4HThis is the study/indicator alert version of the macd + ema strategy.
The strategy details are the following :
Is a simple, yet efficient strategy, which is made from a combination of an oscillator and a moving average.
Its setup for 4h candles with the current settings, however it can be adapted to other different timeframes.
It works nicely ,beating the buy and hold for both BTC and ETH over the last 3 years.
As well with some optimizations and modifications it can be adapted to futures market, indexes(NASDAQ, NIFTY etc), forex( GBPUSD ), stocks and so on.
Components:
MACD
EMA
Time condition
Long/short option
For long/exit short we enter when we are above the ema , histogram is positive and current candle is higher than previous.
For short /exit long , when close below ema , histo negative and current candles smaller than previous
If you have any questions please let me know !

MACD oscillator with EMA strategy 4H This is a simple, yet efficient strategy, which is made from a combination of an oscillator and a moving average.
Its setup for 4h candles with the current settings, however it can be adapted to other different timeframes.
It works nicely ,beating the buy and hold for both BTC and ETH over the last 3 years.
As well with some optimizations and modifications it can be adapted to futures market, indexes(NASDAQ,NIFTY etc), forex(GBPUSD), stocks and so on.
Components:
MACD
EMA
Time condition
Long/short option
For long/exit short we enter when we are above the ema, histogram is positive and current candle is higher than previous.
For short /exit long , when close below ema, histo negative and current candles smaller than previous
If you have any questions please let me know !

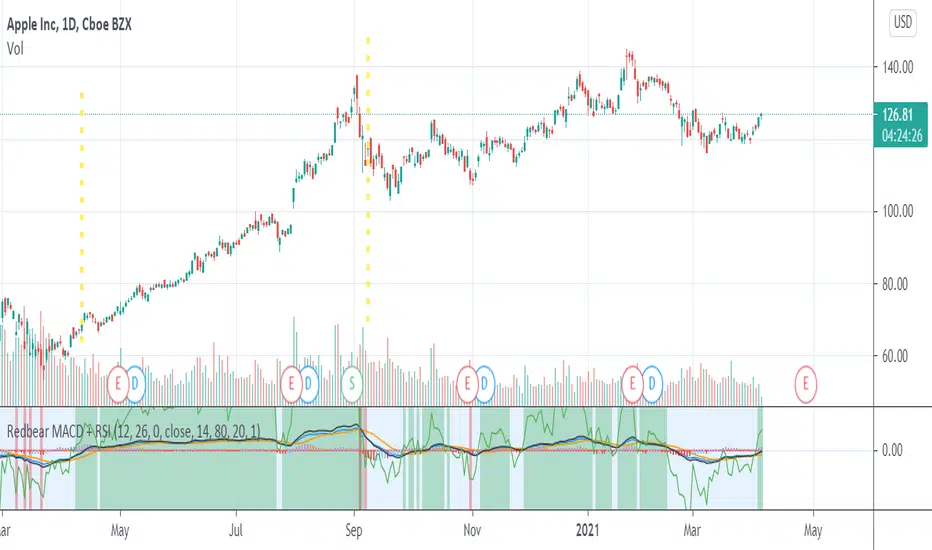
Redbear MACD + RSIHello . I make script that combine MACD and RSI
Green area is BUY SELL signal when rsi >45
you can custom parameter .
Avatar trading indicatorIndicator description:
The Avatar indicator is to provide trading insights including trend and momentum, reversal points, Fibonacci retracement, and projections of future reversal or breakout levels.
Avatar is four indicators built into one.
Trend power: shows strength of trend and a change in momentum.
Red: The trend has been determined and is short
Lime: The trend has been determined and is long
Aqua: Continuation of the down trend, but showing down trend is in weakness.
Fuchsia: Continuation of the up trend, but showing up trend is in weakness
Yellow: Trend is reversing or trend is missing direction
Zig Zag: is used to help identify price trends. It plots points on a chart whenever prices reverse.
Major
The trend is graphed based on changes in price. The major trend should be used in deciding which way to enter the trade.
Minor
The minor trend is similar to the major but it is used to determine your entry point. It is easy to spot higher highs or lower lows. Take not when the minor trend fails to set a new high or a new low.
Channels : are price ranges that can provide useful trading information.
These dotted lines are provided as a quick guide to determine where the trend is headed. They show if price is getting squeezed and we should look for a break out using a flag or pennant pattern or is there an ever widening channel creating a broadening wedge . Look for hesitation or a reversal near the channel lines.
Fibonacci base on Zigzag
The Fibonacci retracement is created by taking two reverse points of major Zig Zag on a stock chart and dividing the vertical distance by the key Fibonacci ratios of 0%, 50%, and 100%.
Strategies for using the indicator
To be decided by traders. You are welcome to discuss trading strategies base on Avatar indicator, if your strategies are really good, we can write codes and do backtest on it.
Notes:
1) The code use 'valuewhen' feature which will cause repaint.
2) You can not use it to setup alerts.

Log MACDThis is just a MACD indicator using the log of the closing price rather than the normal closing price. Useful for exponentially growing stocks and cryptocurrency.

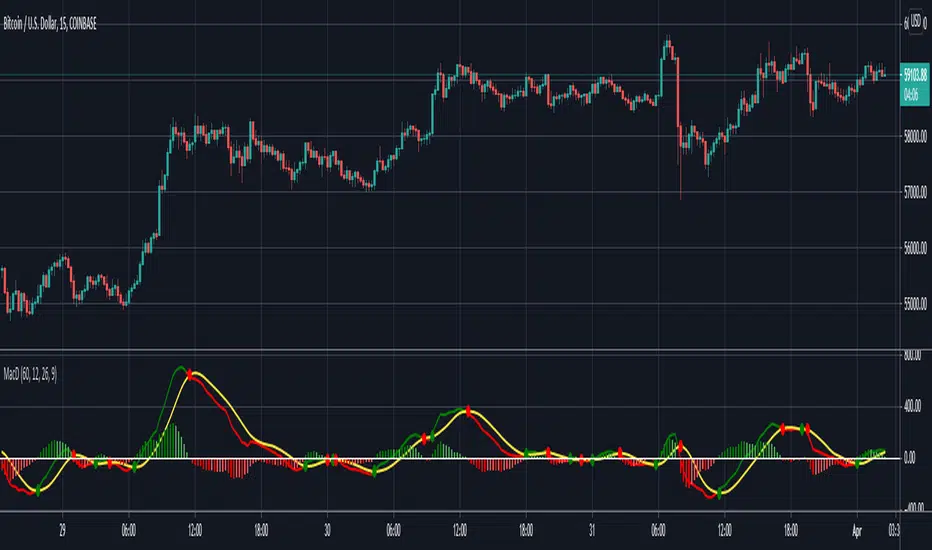
MACD Multi-Timeframe IndicatorHello everyone, this is indicator has always been my go-to MACD indicator for many years. It is such a beautiful easy to understand indicator. You can also view different timeframe resolutions which is helpful. When the MACD crosses up the signal line it is green, and when it crosses below the signal line it is red. The signal line is the constant yellow line. MACD histogram is dark green when increasing buying momentum, and you'll see the green get lighter when buy momentum is decreasing. As well, MACD histogram is dark red when increasing sell momentum, and you'll see the red get lighter when sell momentum is decreasing. I hope you guys love this macd design. Happy trading!
The MACD indicator can be used in many ways but my favorite way to use MACD by itself is by going long when macd < 0 & macd crosses above signal line, and going short when macd > 0 & macd crosses below signal line. I added those alerts for anyone interested.
MACD + PSAR SetupThis indicator combines 3 elements:-
1. MACD which will act as a source of potential Buy Signal
2. PSAR which provides the confirmation for buy signal and for potential Buy on Dip Strategy
3. Breakout candles which provides the confirmation signal for Buy on Breakout strategy
4. The direction of the trend is provided by the Exponential Moving Average
The strategy is to have any counters which has triggered the MACD Golden Cross signal. These counters are to be out under watchlist for further confirmation.
The Buy Signal is confirmed when:-
1. Price is above EMA Direction(standard is set at 200)
2. PSAR has given the Buy Signal OR a Breakout Candle occurs.
Buy Signal is shown with a Green Diamond symbol whilst the Sell Signal is shown in Red Diamond Symbol.
The bullish and bearish condition is set via a green and red background
The MACD and PSAR codes are derived from the standard codes which is available in tradingview.

cheesywedges MTF MACD+Stoch+Ichi+PSARThis is a heatmap created to show 4 key indicators MACD, Stochastic, Ichimoku and PSAR. Adjust TF accordingly. Default is incremental by 45 minutes.
One advantage is you can see as the indicator current candles change from green to red or the other way round as the current trend changes. Eg. MACD attempting to cross Signal and the candle will flicker red to green and you can see it happen on multiple TF.
Standard Settings
PSAR - Start, Increment and Max Value
Stochastic - K,D,Smooth, Upper and Lower
MACD - Fast, Slow and Smooth
Ichimoku - Conversion Line, Base Line Periods, Lagging Span and Displacement
Advanced Settings (MACD)
MACD/Signal Crossover , eg. Long = MACD > Signal
MACD/Signal + Histogram Crossover , eg. Long = MACD > Signal and Hist > 0 and Signal > 0
MACD/Signal Crossing, eg. Long = MACD > Signal and previous MACD < previous Signal
MACD/Signal + Histogram Crossing, eg. Long = MACD > Signal and previous MACD < previous Signal and Hist > 0 and Signal > 0 and previous Hist > previous Signal
For normal usage, just use MACD/Signal Crossover
Recommended Settings
Ichimoku 20, 60, 120, 30
If customized enhancement required drop a message and I'll see what I can do.

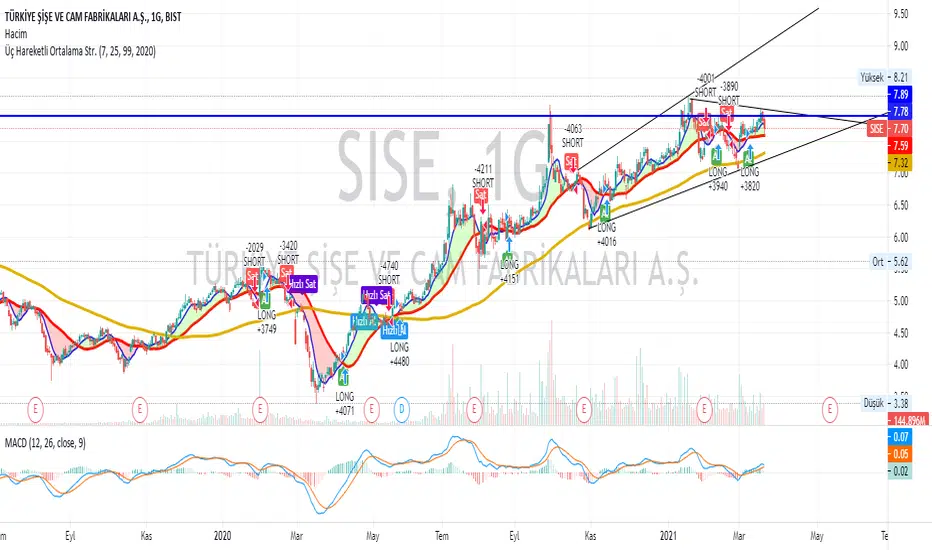
Three moving average strategies
If the short term (Default 7) moving average cuts the medium term (default 25) moving average, BUY. Conversely, it generates the SELL signal. If the long term (Default 99) moving average cuts its short term moving average, Quick SELL. Conversely, it can be interpreted as Fast SELL. You can change the moving average and the number of days as you wish, and you can trade in the short or long term. I hope it was useful.