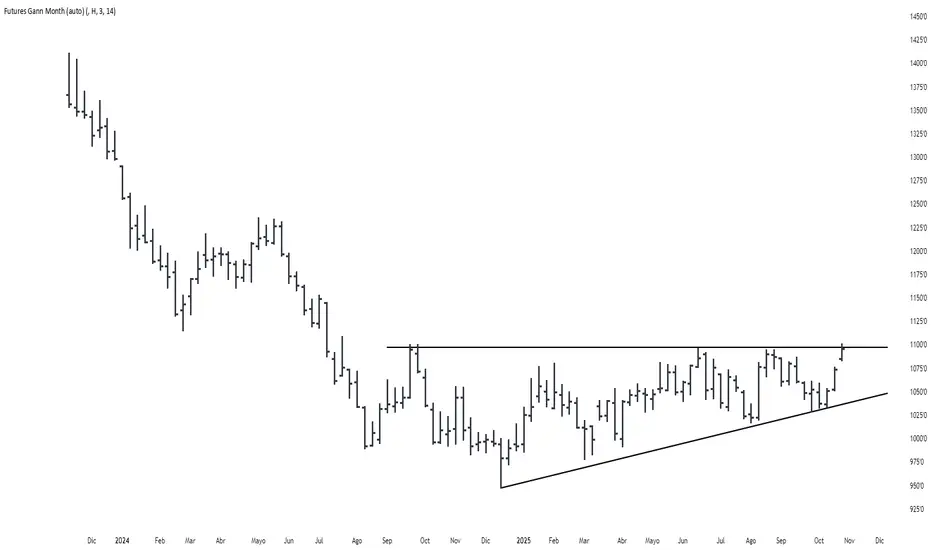
Futures Gann MonthBuilds a a continuous chart of the same month for a futures contract (e.g. ZSH2026).
This means such a chart consists of March '22, March '23, March '24, March '25, March '26...
The script goes back 20 years at most (depending on the current ticker selected in TradingView).
Multitimeframe
PDB - RSI Based Buy/Sell signals with 4 MARSI Based Buy/Sell Signals on Price chart + 4 MA System
This indicator plots RSI-based Buy & Sell signals directly on the price chart , combined with a 4-Moving-Average trend filter (20/50/100/200) for higher accuracy and cleaner trade timing.
The signal triggers when RSI reaches user-defined overbought/oversold levels, but unlike a standard RSI, this version plots the signals **on the chart**, not in the RSI window — making entries and exits easier to see in real time.
RSI Levels Are Fully Customizable
The default RSI thresholds are 30 (oversold) and 70 (overbought).
However, you can adjust these to fit your trading style. For example:
> When day trading on the 5–15 min timeframe, I personally use 35 (oversold) and 75 (overbought) to catch moves earlier.
> The example shown in the preview image uses 10-minute timeframe settings.
You can change the RSI levels to trigger signals from **any value you choose**, allowing you to tailor the indicator to scalping, day trading, or swing trading.
4 Moving Averages Included:
20, 50, 100, 200 MAs act as dynamic trend filters so you can:
✔ trade signals only in the direction of trend
✔ avoid false reversals
✔ identify momentum shifts more clearly
Works on all markets and timeframes — crypto, stocks, FX, indices.

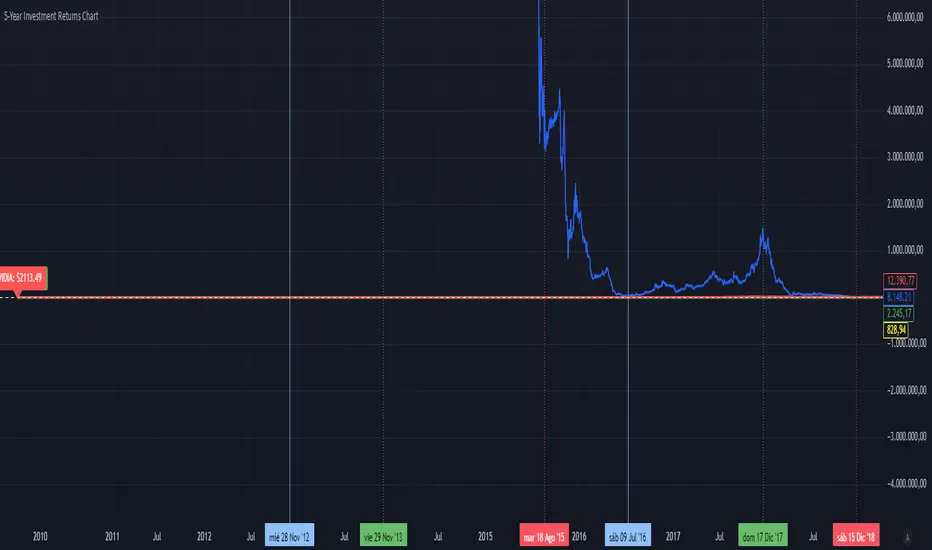
5-Year Returns Chart BTCvsSPXvsGOLDvsNVDACompare between thes 4 assets:
BTC
NVDA
SPX
GOLD
With an initial 1000$ investment in the last 5 years each return
NY, Asia & London Session Lines + NY First HourEUR/USD last session OHLC Asia + London and first hour NY. defaults to last session if market closed. publishing to save for my self, nothing groundbreaking

EMA HeatmapEMA Heatmap — Indicator Description
The EMA Order Heatmap is a visual trend-structure tool designed to show whether the market is currently trending bullish, trending bearish, or moving through a neutral consolidation phase. It evaluates the alignment of multiple exponential moving averages (EMAs) at three different structural layers: short-term daily, medium-term daily, and weekly macro trend. This creates a quick and intuitive picture of how well price movement is organized across timeframes.
Each layer of the heatmap is scored from bearish to bullish based on how the EMAs are stacked relative to each other. When EMAs are in a fully bullish configuration, the row displays a bright green or lime color. Fully bearish alignment is shown in red. Yellow tones appear when the EMAs are mixed or compressing, indicating uncertainty, trend exhaustion, or a change in market character. The three rows combined offer a concise view of whether strength or weakness is isolated to one timeframe or broad across the market.
This indicator is best used as a trend filter before making trading decisions. Traders may find more consistent setups when the majority of the heatmap supports the direction of their trade. Green-dominant conditions suggest a trending bullish environment where long trades can be favored. Red-dominant conditions indicate bearish momentum and stronger potential for short opportunities. When yellow becomes more prominent, the market may be transitioning, ranging, or gearing up for a breakout, making timing more challenging and risk higher.
• Helps quickly identify directional bias
• Highlights when trends strengthen, weaken, or turn
• Provides insight into whether momentum is supported by higher timeframes
• Encourages traders to avoid fighting market structure
It is important to recognize the limitations. EMAs are lagging indicators, so the heatmap may confirm a trend after the initial move is underway, especially during fast reversals. In sideways or low-volume environments, the structure can shift frequently, reducing clarity. This tool does not generate entry or exit signals on its own and should be paired with price action, momentum studies, or support and resistance analysis for precise trade execution.
The EMA Order Heatmap offers a clean and reliable way to stay aligned with the broader market environment and avoid lower-quality trades in indecisive conditions. It supports more disciplined decision-making by helping traders focus on setups that match the prevailing structural trend.

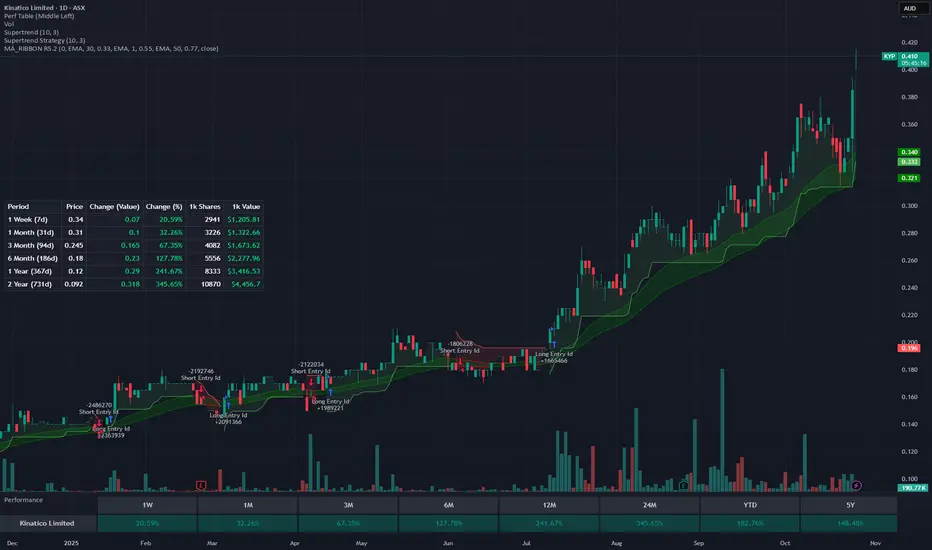
Rolling Performance Metrics TableRolling Performance Metrics Table
A clean, customizable table overlay that displays rolling performance metrics across multiple time periods. Perfect for quickly assessing price momentum and performance trends at a glance.
FEATURES:
- Displays performance across 5 time periods: 1 Week, 3 Month, 6 Month, 1 Year, and 2 Year
- Shows historical price at the start of each period
- Calculates both absolute price change and percentage change
- Color-coded results: Green for positive performance, Red for negative performance
- Fully transparent design with no background or borders - text floats cleanly over your chart
- Customizable table position (9 placement options)
DISPLAY COLUMNS:
1. Period - The lookback timeframe
2. Price - The historical price at the start of the period
3. Change (Value) - Absolute price change from the period start
4. Change (%) - Percentage return over the period
CUSTOMIZATION:
- Adjust the number of bars for each period (default: 1 Week = 5 bars, 3 Month = 63 bars, 6 Month = 126 bars, 1 Year = 252 bars, 2 Year = 504 bars)
- Choose from 9 table positions: Top, Middle, Bottom combined with Left, Center, Right
- Default position: Middle Left
USAGE:
Perfect for traders who want to quickly assess momentum across multiple timeframes. The transparent overlay design ensures minimal obstruction of chart analysis while providing critical performance data at a glance.
NOTE:
- The table only appears on the last bar of your chart
- Customize bar counts in settings to match your specific timeframe needs (e.g., daily vs hourly charts)
- "N/A" appears when historical data is insufficient for the selected period
DG Market Structure (Inspired By Deadcat)MS Indicator taken from Deadcat and enhanced a little bit
I added CHoCH and BOS to better tell the story of why price is moving a certain way. Also made a lot more of the values Input based for testing.
I tried to add in retracement values on the MTF chart but I don't think the math is right, maybe someone can figure out the math.

Previous Period High/Low LevelsThis indicator plots the previous day, week, and month high and low levels to highlight key liquidity levels.
Perfect for traders using market structure, liquidity, or SMC concepts.
Features:
Auto-plots PDH/PDL, PWH/PWL, and PMH/PML
Adjustable line styles, widths, and label sizes
Toggle price display on or off
Accurate UTC offset handling

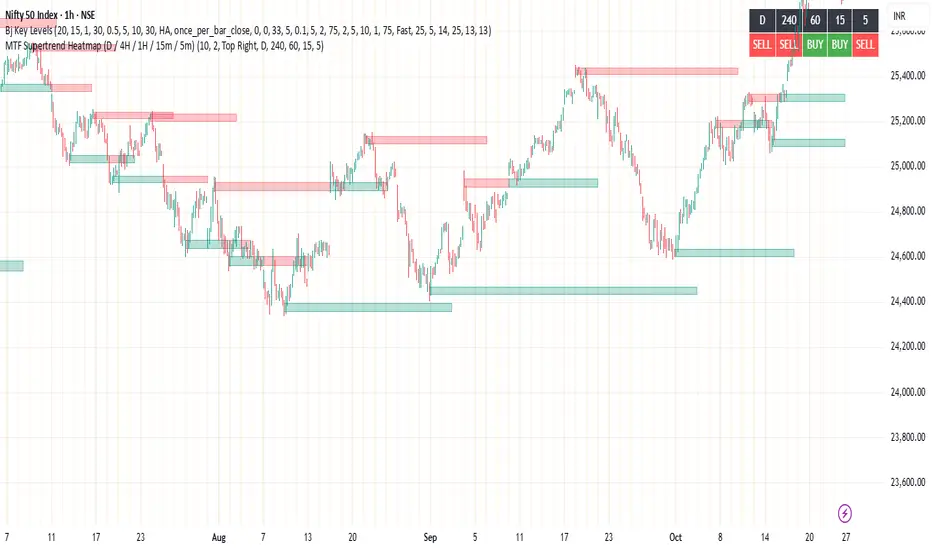
MTF Supertrend Heatmap (D / 4H / 1H / 15m / 5m)MTF Supertrend Heatmap (D / 4H / 1H / 15m / 5m)
A clean dashboard that tells you whether the same Supertrend (ATR Length, Multiplier) is BUY or SELL across five timeframes—all on one chart. Higher-TF values are fetched with request.security() and, when Confirm HTF bar close is ON, they do not repaint after that bar closes.
Optional toggles let you plot the current-TF Supertrend line and show bar-anchored flip markers (BUY/SELL) for each timeframe. Includes alerts for ALL-TF alignment and MAJORITY (≥3/5) agreement. Timeframes and Supertrend parameters are fully configurable. Use the heatmap for quick confirmation, reduce noise by keeping markers off unless needed.
ema200 plus Description:
This advanced indicator displays Exponential Moving Averages (EMA) across multiple timeframes to help traders identify trend direction and strength across different market perspectives.
Key Features:
Multi-Timeframe EMA Analysis:
Plots 200-period EMA on four different timeframes: 30-minute, 1-hour, 4-hour, and Daily
Each timeframe is displayed with distinct colors for easy visual identification
Visual Elements:
Chart Lines: Four colored EMA lines plotted directly on the price chart
Price Labels: Clear labels showing each EMA's current value at the latest bar
Color-coded Table: Comprehensive data table showing price position relative to each EMA
Trend Identification:
Bullish Signal: When price closes above an EMA (green background in table)
Bearish Signal: When price closes below an EMA (dark background in table)
Helps identify confluence when multiple timeframes align in direction
Customizable Settings:
Adjustable EMA length (default: 200 periods)
Customizable line width and offset
Flexible table positioning (top/middle/bottom, left/center/right)
Configurable table cell size and text appearance
Swing traders analyzing multiple timeframes
Position traders looking for trend confirmation
Technical analysts seeking confluence across time horizons
This indicator provides a comprehensive view of market trends across different time perspectives, helping traders make more informed decisions based on multi-timeframe analysis.
This indicator does not provide trading advice. It is for educational and informational purposes only.
**指标名称:多时间框架200 EMA**
**描述:**
这款高级指标在多个时间框架上显示指数移动平均线(EMA),帮助交易者识别不同市场视角下的趋势方向和强度。
**主要特点:**
1. **多时间框架EMA分析:**
- 在四个不同时间框架上绘制200周期EMA:30分钟、1小时、4小时和日线
- 每个时间框架使用独特颜色显示,便于视觉识别
2. **视觉元素:**
- **图表线:** 在价格图表上直接绘制四条彩色EMA线
- **价格标签:** 清晰显示最新K线处各EMA的当前值
- **颜色编码表格:** 综合数据表格显示价格相对于各EMA的位置
3. **趋势识别:**
- **看涨信号:** 当价格收于EMA上方时(表格中显示绿色背景)
- **看跌信号:** 当价格收于EMA下方时(表格中显示深色背景)
- 帮助识别多个时间框架方向一致时的共振信号
4. **可自定义设置:**
- 可调整EMA长度(默认:200周期)
- 可自定义线宽和偏移量
- 灵活的表格定位(上/中/下,左/中/右)
- 可配置表格单元格大小和文本外观
**适合人群:**
- 分析多时间框架的摆动交易者
- 寻求趋势确认的头寸交易者
- 寻找不同时间维度共振信号的技术分析师

VWAP Composites📊 VWAP Composite - Advanced Multi-Period Volume Weighted Average Price Indicator
═══════════════════════════════════════════════════════════════════
🎯 OVERVIEW
VWAP Composite is an advanced volume-weighted average price (VWAP) indicator that goes beyond traditional single-period VWAP calculations by offering composite multi-period analysis and unprecedented customization. This indicator solves a common problem traders face: traditional VWAP resets at arbitrary intervals (session start, day, week), but significant price action and volume accumulation often spans multiple periods. VWAP Composite allows you to anchor VWAP calculations to any timeframe—or combine multiple periods into a single composite VWAP—giving you a true representation of average price weighted by volume across the exact periods that matter to your analysis.
═══════════════════════════════════════════════════════════════════
⚙️ HOW IT WORKS - CALCULATION METHODOLOGY
📌 CORE VWAP CALCULATION
The indicator calculates VWAP using the standard volume-weighted formula:
• Typical Price = (High + Low + Close) / 3
• VWAP = Σ(Typical Price × Volume) / Σ(Volume)
This calculation is performed across user-defined time periods, ensuring each bar's contribution to the average is proportional to its trading volume.
📌 STANDARD DEVIATION BANDS
The indicator calculates volume-weighted standard deviation to measure price dispersion around the VWAP:
• Variance = Σ / Σ(Volume)
• Standard Deviation = √Variance
• Upper Band = VWAP + (StdDev × Multiplier)
• Lower Band = VWAP - (StdDev × Multiplier)
These bands help identify overbought/oversold conditions relative to the volume-weighted mean, with high-volume price excursions having greater impact on band width than low-volume moves.
📌 COMPOSITE PERIOD METHODOLOGY (Auto Mode)
Unlike traditional VWAP that resets at fixed intervals, Auto Mode creates composite VWAPs by combining the current period with N previous periods:
• Period Span = 1: Current period only (standard VWAP behavior)
• Period Span = 2: Current period + 1 previous period combined
• Period Span = 3: Current period + 2 previous periods combined
• And so on...
Example: A 3-period Weekly composite VWAP calculates from the start of 2 weeks ago through the current week's end, creating a single VWAP that represents 21 days of continuous price and volume data. This provides context about where price stands relative to the volume-weighted average over multiple weeks, not just the current week.
═══════════════════════════════════════════════════════════════════
🔧 KEY FEATURES & ORIGINALITY
✅ DUAL OPERATING MODES
1️⃣ MANUAL MODE (5 Independent VWAPs)
Define up to 5 separate VWAP calculations with custom start/end times:
• Perfect for anchoring VWAP to specific events (earnings, Fed announcements, major reversals)
• Each VWAP has independent color settings for lines and deviation band backgrounds
• Individual control over calculation extension and visual extension (explained below)
• Useful for tracking multiple institutional accumulation/distribution zones simultaneously
2️⃣ AUTO MODE (Composite Period VWAP)
Automatically calculates VWAP across combined time periods:
• Supported periods: Daily, Weekly, Monthly, Quarterly, Yearly
• Configurable period span (1-20 periods)
• Always up-to-date, recalculates on each new bar
• Ideal for systematic analysis across consistent timeframes
✅ DUAL EXTENSION SYSTEM (Manual Mode Innovation)
Most VWAP indicators only offer "on/off" for extending calculations. This indicator provides two distinct extension options:
🔹 EXTEND CALCULATION TO CURRENT BAR
When enabled, continues including new bars in the VWAP calculation after the defined end time. The VWAP value updates dynamically as new volume enters the market.
Use case: You anchored VWAP to a major low 3 weeks ago. You want the VWAP to continue evolving with new volume data to track ongoing institutional positioning.
🔹 EXTEND VISUAL LINE ONLY
When enabled (and calculation extension is disabled), projects the "frozen" VWAP value forward as a reference line. The VWAP value remains fixed at what it was at the end time, but the line and deviation bands visually extend to current price.
Use case: You want to see how price is behaving relative to the VWAP that existed at a specific point in time (e.g., "Where is price now vs. the 5-day VWAP that existed at last Friday's close?").
This dual system gives you unprecedented control over whether you're tracking a "living" VWAP that incorporates new data or using historical VWAP levels as static reference points.
✅ CUSTOMIZABLE STANDARD DEVIATION BANDS
• Adjustable multiplier (0.1 to 5.0)
• Independent background colors with opacity control for each VWAP
• Dashed band lines for easy visual distinction from main VWAP
• Bands extend when visual extension is enabled, maintaining zone visibility
✅ COMPREHENSIVE LABELING SYSTEM
Each VWAP displays:
• Current VWAP value
• Upper deviation band value (High)
• Lower deviation band value (Low)
• Extension status indicator (Calc Extended / Visual Extended)
• Color-coded for quick identification
═══════════════════════════════════════════════════════════════════
📖 HOW TO USE THIS INDICATOR
🎯 SCENARIO 1: EVENT-ANCHORED VWAP (Manual Mode)
Use case: A stock gaps down 15% on earnings and you want to track where institutions are positioning during the recovery.
Setup:
1. Switch to Manual Mode
2. Enable VWAP 1
3. Set Start Time to the earnings gap bar
4. Set End Time to current time (or leave far in future)
5. Enable "Extend Calculation to Current Bar"
6. Watch how price respects the VWAP as a dynamic support/resistance
Interpretation:
• Price above VWAP = buyers in control since the event
• Price testing VWAP from above = potential support
• Volume-weighted standard deviation bands show normal price range
• Price outside bands = potential exhaustion/mean reversion setup
🎯 SCENARIO 2: MULTI-WEEK INSTITUTIONAL ACCUMULATION ZONE (Auto Mode)
Use case: You trade swing setups and want to identify where institutions have been accumulating over the past 3 weeks.
Setup:
1. Switch to Auto Mode
2. Select "Weekly" period type
3. Set Period Span to 3
4. Enable standard deviation bands
Interpretation:
• 3-week composite VWAP shows the true average institutional entry
• Price bouncing off VWAP repeatedly = strong support (institutions defending their average)
• Price breaking below VWAP on high volume = potential distribution
• Deviation bands contracting = consolidation; expanding = volatility increase
🎯 SCENARIO 3: COMPARING MULTIPLE TIME HORIZONS (Manual Mode)
Use case: You want to see short-term vs medium-term vs long-term VWAP alignments.
Setup:
1. Switch to Manual Mode
2. VWAP 1: Last 5 trading days (blue)
3. VWAP 2: Last 10 trading days (orange)
4. VWAP 3: Last 20 trading days (purple)
5. Enable "Extend Calculation" for all
6. Set different background colors for visual separation
Interpretation:
• All VWAPs aligned upward = strong trend across all timeframes
• Price between VWAPs = finding equilibrium between different trader timeframes
• Short-term VWAP crossing long-term VWAP = momentum shift
• Price rejecting at higher-timeframe VWAP = that timeframe's traders defending their average
🎯 SCENARIO 4: HISTORICAL VWAP REFERENCE LEVELS (Manual Mode)
Use case: You want to see where the 1-month VWAP was at each month-end as static reference levels.
Setup:
1. Switch to Manual Mode
2. VWAP 1: Set to last month's start/end dates
3. VWAP 2: Set to 2 months ago start/end dates
4. VWAP 3: Set to 3 months ago start/end dates
5. Disable "Extend Calculation"
6. Enable "Extend Visual Line Only"
Interpretation:
• Each VWAP represents the volume-weighted average for that complete month
• These become static support/resistance levels
• Price returning to old monthly VWAPs = institutional memory/gap fill behavior
• Useful for identifying longer-term value areas
═══════════════════════════════════════════════════════════════════
🎨 CUSTOMIZATION OPTIONS
GENERAL SETTINGS
• Show/hide labels
• Line style: Solid, Dashed, or Dotted
• Standard deviation multiplier (impacts band width)
• Toggle standard deviation bands on/off
MANUAL MODE (Per VWAP)
• Custom start and end times
• Line color picker
• Background color picker (with transparency control)
• Extend calculation option
• Extend visual option
• Show/hide individual VWAPs
AUTO MODE
• Period type selection (Daily/Weekly/Monthly/Quarterly/Yearly)
• Period span (1-20 periods)
• Line color
• Background color (with transparency control)
═══════════════════════════════════════════════════════════════════
💡 TRADING APPLICATIONS
✓ Mean Reversion: Use deviation bands to identify stretched prices likely to return to VWAP
✓ Trend Confirmation: Price sustained above VWAP = bullish bias; below = bearish bias
✓ Support/Resistance: VWAP often acts as dynamic S/R, especially on higher volume periods
✓ Institutional Positioning: Multi-day/week VWAPs show where large players have established positions
✓ Entry Timing: Wait for pullbacks to VWAP in trending markets
✓ Stop Placement: Use VWAP ± standard deviation as volatility-adjusted stop levels
✓ Breakout Confirmation: Breakouts from consolidation with price reclaiming VWAP = stronger signal
✓ Multi-Timeframe Analysis: Compare short vs long-period VWAPs to gauge momentum alignment
═══════════════════════════════════════════════════════════════════
⚠️ IMPORTANT NOTES
• The indicator redraws on each bar to maintain accurate visual representation (uses `barstate.islast`)
• Maximum lookback is limited to 5000 bars for performance optimization
• Time range calculations work across all timeframes but are most effective on intraday to daily charts
• Standard deviation bands assume volume-weighted distribution; extreme events may violate assumptions
• Auto mode always calculates to current bar; use Manual mode for fixed historical periods
═══════════════════════════════════════════════════════════════════
This indicator is open-source. Feel free to examine the code, learn from it, and adapt it to your needs.

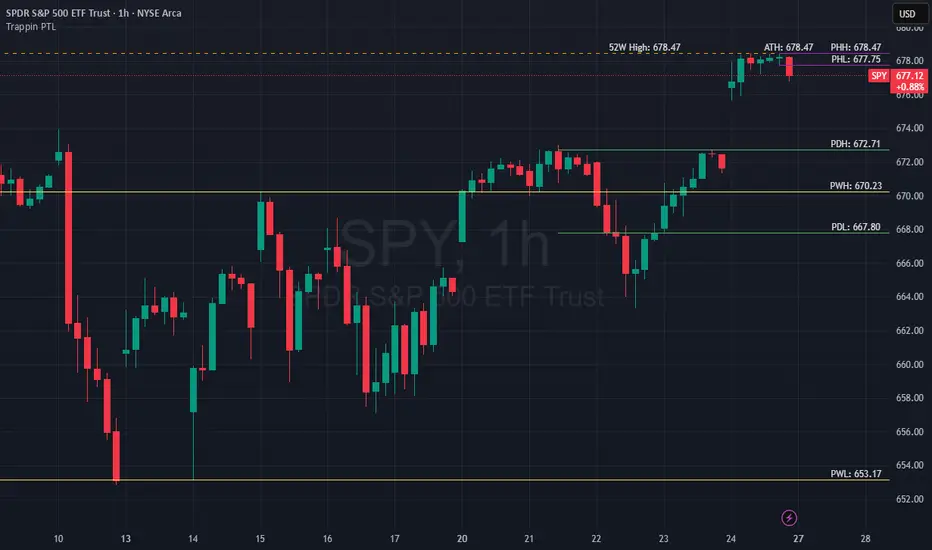
Trappin Previous Timeframe LevelsTrappin Previous Timeframe Levels (Trappin PTL)
Overview
Trappin PTL is a comprehensive multi-timeframe support and resistance indicator that displays key price levels from multiple timeframes on a single chart. This indicator helps traders identify critical price zones where reversals or breakouts are likely to occur, making it ideal for both intraday and swing trading strategies.
💡 Origin Story
I got tired of manually drawing these lines that I learned from watching Wallstreet Trapper on Trappin Tuesdays YouTube live streams. After repeatedly marking the same previous timeframe levels on every chart, I decided to automate the process. Hope it helps you as much as it helps me!
Key Features
📊 Multiple Timeframe Levels
The indicator tracks and displays high/low levels from:
Previous Hour (PHH/PHL) - Purple lines
Previous Day (PDH/PDL) - Green lines
Previous Week (PWH/PWL) - Yellow lines
Previous Month (PMH/PML) - Blue lines
All-Time High (ATH) - Red line
52-Week High - Orange line
🎨 Fully Customizable
Colors - Change the color of each timeframe independently
Line Styles - Choose between Solid, Dashed, or Dotted lines
Line Widths - Adjust thickness from 1-4 pixels
All settings organized in intuitive groups for easy access
📍 Smart Line Extension
Lines extend back to show when the level was established
Lines project forward to show current relevance
Historical context helps identify key support/resistance zones
🏷️ Clear Price Labels
Each level displays its exact price value (no currency symbols)
Labels positioned horizontally to avoid overlap
Adaptive text color for visibility on any chart theme (dark or light mode)
Why "Trappin"?
The name is a tribute to Wallstreet Trapper and his Trappin Tuesdays YouTube live streams, where I learned the importance of marking previous timeframe levels. The name also reflects the indicator's purpose: identifying price levels where traders often get "trapped" - whether it's bulls getting trapped below resistance or bears getting trapped above support. These levels represent zones where significant order flow and liquidity exist, making them prime areas for reversals or breakouts.
Credits
Created by resoh
Inspired by Wallstreet Trapper and Trappin Tuesdays YouTube live streams
This indicator is provided for educational and informational purposes. Always practice proper risk management and conduct your own analysis before making trading decisions.
Version History
v1.0 - Initial Release
Multi-timeframe high/low levels
All-time high tracking
52-week high tracking
Fully customizable colors, styles, and widths
Adaptive labels with price display
Smart line extension showing historical context

Choppiness Index | CipherDecodedThe Choppiness Index is a multi-timeframe regime indicator that measures whether price action is trending or consolidating.
This recreation was inspired by the Choppiness Index chart from Checkonchain, with full credit to their team for the idea.
🔹 How It Works
CI = 100 * log10( SUM(ATR(1), n) / (highest(high, n) – lowest(low, n)) ) / log10(n)
Where:
n – lookback length (e.g. 14 days / 10 weeks / 10 months)
ATR(1) – true-range of each bar
SUM(ATR(1), n) – total true-range over n bars
highest(high, n) and lowest(low, n) – price range over n bars
Low values → strong trend
High values → sideways consolidation
Below is a simplified function used in the script for computing CI on any timeframe:
f_ci(_n) =>
_tr = ta.tr(true)
_sum = math.sum(_tr, _n)
_hh = ta.highest(high, _n)
_ll = ta.lowest(low, _n)
_rng = _hh - _ll
_rng > 0 ? 100 * math.log10(_sum / _rng) / math.log10(_n) : na
Consolidation Threshold — 50.0
Trend Threshold — 38.2
When Weekly CI < Trend Threshold, a trending zone (yellow) appears.
When Weekly CI > Consolidation Threshold, a consolidation zone (purple) appears.
Users can toggle either background independently.
🔹 Example Background Logic
bgcolor(isTrend and Trend ? color.new(#f3e459, 50) : na, title = "Trending", force_overlay = true)
bgcolor(isConsol and Cons ? color.new(#974aa5, 50) : na, title = "Consolidation", force_overlay = true)
🔹 Usage Tips
Observe the Weekly CI for regime context.
Combine with price structure or trend filters for signal confirmation.
Low CI values (< 38) indicate strong trend activity — the market may soon consolidate to reset.
High CI values (> 60) reflect sideways or range-bound conditions — the market is recharging before a potential new trend.
🔹 Disclaimer
This indicator is provided for educational purposes.
No trading outcomes are guaranteed.
This tool does not guarantee market turns or performance; it should be used as part of a broader system.
Use responsibly and perform your own testing.
🔹 Credits
Concept origin — Checkonchain Choppiness Index

Liquidity Swap Detector Ultimate - Cedric JeanjeanAdvanced Smart Money Concepts indicator designed to detect high-probability liquidity sweeps and institutional order flow reversals. This professional-grade tool combines multiple ICT (Inner Circle Trader) strategies to identify optimal entry points.
═══════════════════════════════════════════════════════
📊 KEY FEATURES:
✅ Smart Swing Detection
- Identifies confirmed swing highs and lows using adaptive lookback periods
- Eliminates false signals through double-confirmation logic
- Detects liquidity grabs at key market structure points
✅ Fair Value Gap (FVG) Analysis
- Multi-timeframe FVG detection for enhanced accuracy
- Filters imbalances by minimum size threshold
- Combines current timeframe and higher timeframe FVGs
✅ Advanced Volatility Filter
- ATR-based volatility analysis to avoid low-quality setups
- Adjustable volatility threshold (default 0.35%)
- Ensures entries during optimal market conditions
✅ Precision Signal Generation
- LONG signals: Confirmed swing lows + FVG + volatility confirmation
- SHORT signals: Confirmed swing highs + FVG + volatility confirmation
- Clear visual markers with price labels
✅ Comprehensive Alert System
- Three alert types: Simple, Detailed, JSON (for webhooks)
- Separate LONG/SHORT alert controls
- Compatible with MT5 integration via webhooks
- TradingView native alertcondition support
✅ Professional Dashboard
- Real-time ATR monitoring
- Volatility percentage display
- FVG status indicator
- Alert status tracker
═══════════════════════════════════════════════════════
⚙️ CUSTOMIZABLE PARAMETERS:
🔹 Lookback Swing (1-50): Defines swing detection sensitivity
🔹 ATR Multiplier: Controls wick filter strength
🔹 Volatility Filter: Minimum required market volatility (%)
🔹 FVG Filter: Minimum fair value gap size (%)
🔹 FVG Timeframe: Higher timeframe for multi-TF analysis
🔹 Visual Options: Toggle swing marks, FVG zones, labels
🔹 Alert Controls: Enable/disable LONG/SHORT notifications
═══════════════════════════════════════════════════════
📈 HOW IT WORKS:
1. The indicator scans for confirmed swing points using a robust double-confirmation algorithm
2. Simultaneously analyzes Fair Value Gaps on both current and higher timeframes
3. Validates market volatility to ensure sufficient price movement
4. Generates precise entry signals when all conditions align
5. Triggers customizable alerts for instant notification
═══════════════════════════════════════════════════════
🎯 BEST PRACTICES:
- Use on liquid markets (Forex majors, indices, crypto)
- Recommended timeframes: 15m, 1H, 4H
- Combine with support/resistance for confirmation
- Adjust lookback period based on market volatility
- Test alert settings before live trading
- Use JSON alerts for automated trading integration
═══════════════════════════════════════════════════════
⚡ ALERT CONFIGURATION:
1. Click the Alert icon (bell) in TradingView
2. Select "Liquidity Swap Detector Ultimate - TITAN v6"
3. Choose your preferred alert condition:
- LONG Signal: Only bullish setups
- SHORT Signal: Only bearish setups
- ANY Signal: All trading opportunities
4. Set expiration and notification preferences
5. For MT5 integration: Select "JSON" message type and configure webhook URL

Timeframe LiquidityTimeframe Liquidity – Multi-Timeframe Highs & Lows by
Timeframe Liquidity automatically plots previous day, week, month, and year highs and lows, key liquidity zones used by smart money and price-action traders. These levels extend into the future and can automatically stop once price wicks through, showing clear liquidity sweeps and tested zones.
Perfect for traders using ICT / SMC concepts, liquidity theory, or market structure analysis. Instantly see where liquidity rests, where it’s been taken, and how price reacts at major support and resistance.
Features:
Auto-plots PDH/PDL, PWH/PWL, PMH/PML, PYH/PYL
Custom line styles, colors, and label sizes
Option to stop line on wick (liquidity sweep)
Smart timeframe visibility (hides same-TF levels)
Accurate UTC offset handling
Identify liquidity pools fast, trade cleaner charts, and track where smart money hunts liquidity.
Built for precision, clarity, and confluence.


Name of tickerDescription:
This indicator displays the instrument’s ticker symbol and the current chart timeframe at the top center of the chart.
Features:
• Shows the ticker (e.g., BTCUSDT, AAPL, etc.).
• Displays the current timeframe (1m, 5m, 1H, 1D, etc.).
• Positioned at the top center of the chart for easy reference.
• Transparent background for minimal interference with price action.
• Lightweight and simple, no extra settings required.
Usage:
• Works with any instrument: stocks, crypto, futures.
• Useful for traders who want to always see the ticker and timeframe while analyzing the chart.
Settings:
• Text size can be adjusted in the script (text_size).
• Text and background colors can be customized (text_color, bgcolor).

Asia & London Session High/Low – EOD Segments (v4.5)What it does
Plots the Asia and London session high & low each day.
When a session ends, its high/low are locked (non-repainting) and drawn as horizontal segments that auto-extend to the end of that same day (no infinite rays).
Optional labels show the exact level at session close.
Toggle whether to keep prior days on the chart or auto-clear them on the first bar of a new day.
Why traders use it
Quickly see overnight liquidity levels that often act as magnets or barriers during the U.S. session.
Map session range extremes for breakout/reversal planning, partials, and invalidation.
Works great alongside VWAP, 8/20/200 MAs, or your NY session tools to build confluence.
How it works
You define the session windows (defaults: Asia 00:00–06:00, London 07:00–11:00).
While a session is active, the script tracks running high/low.
On the bar after the session ends, the level is finalized and drawn; the segment’s right edge updates each bar until EOD, then stops automatically.
Inputs
Session Timezone: “Exchange”, UTC, or a specific region (set this to match your venue).
Asia / London Session: editable HHMM-HHMM windows.
Show Asia / Show London: enable either/both sessions.
Keep history: keep or auto-delete previous days.
Show labels: price labels at session close.
Colors & width: customize high/low colors and line width.
Best practices
Use on intraday timeframes (1–60m).
For equities/futures, set timezone to your exchange (e.g., America/New_York). For FX/crypto, pick what matches your workflow.
Common tweak: London 08:00–12:00 local; Asia 00:00–05:00 or your broker’s definition.
Notes
Non-repainting: levels only print once the session is complete.
Designed to be light and reliable—no boxes, just clean lines and labels.
If you want NY session levels, midlines (50%), anchored stop-time, or alerts on touches, this script can be extended.
For educational use only. Not financial advice.

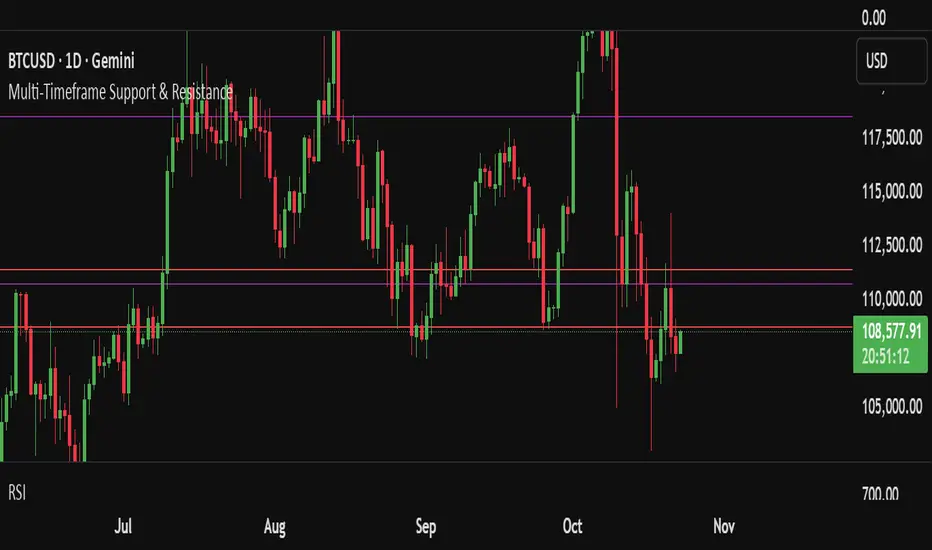
Multi-Timeframe Support & ResistanceThis indicator automatically plots dynamic support and resistance levels across multiple timeframes — including 1H, 4H, 1D, 1W, 1M, and the current chart timeframe. Each level is color-coded for clarity and extends across the chart to highlight key price zones.
**Key Features:**
- ⏱ Multi-timeframe analysis: 6 configurable timeframes
- 🎨 Custom color and style settings for each timeframe
- 📏 Adjustable number of levels per timeframe
- 🧼 Clean chart layout with no duplicate lines
- 🔄 Auto-refresh every 10 bars for up-to-date levels
Support and resistance levels are calculated using historical high/low ranges and evenly distributed across the selected lookback period. This helps traders identify confluence zones, breakout targets, and reversal areas with precision.
RSI to Price Projection PanelThis indicator calculates the current RSI based on the closing price and projects estimated prices for user-defined RSI target levels. Results are displayed in a table at the top-right corner of the chart.

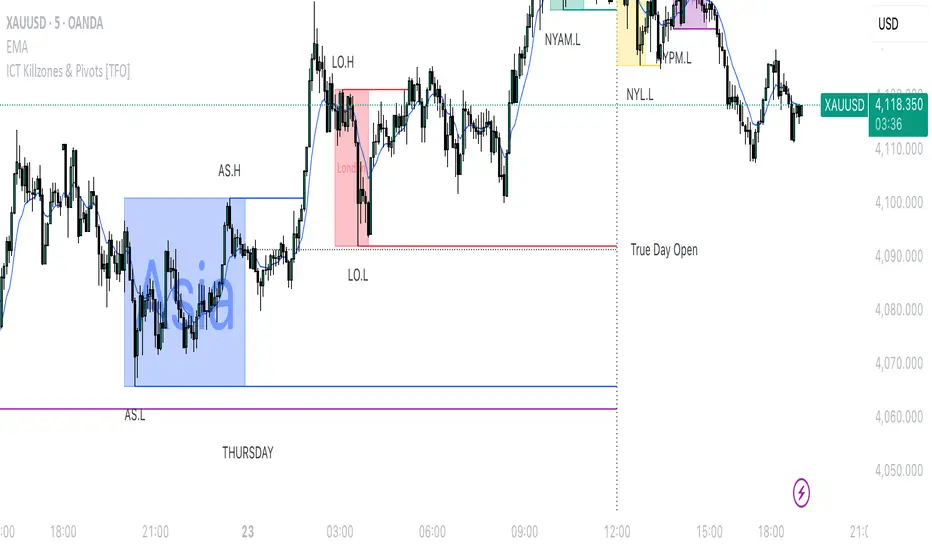
LANZ Origins🔷 LANZ Origins – Multi-Framework Liquidity, Structure & Risk Management Overlay
LANZ Origins is an advanced multi-framework visualization toolkit that unifies key institutional concepts into one efficient interface. Designed for professional traders, it merges session mapping, liquidity analysis, imbalance detection, multi-account risk control, and higher-timeframe candle tracing — all in a single overlay.
🧩 Core Components
🈵 Asian Range Liquidity
Automatically detects and projects the Asian session range (19:00–02:00 NY) with an optional mid-price line (50 %). This provides visual context for intraday liquidity and manipulation zones commonly referenced in ICT-style analysis.
📊 Imbalance Detector
Highlights Fair Value Gaps (FVG), Opening Gaps (OG), and Volume Imbalances (VI) directly on-chart, using separate color schemes for bullish and bearish inefficiencies. Each element can be customized by width, ATR filter, and extension length.
🕯️ Higher-Timeframe Candles (ICT Style)
Displays multi-timeframe candles (HTF1–HTF6) simultaneously — e.g., 5 m, 30 m, 1 h, 4 h, 1 D, 1 W — each rendered with independent wick, border, and fill settings. Includes remaining-time counters, timeframe labels, and optional imbalance shading between bodies.
📈 Market Structure (ZigZag 30 m)
Replicates 30-minute swing structure to all active timeframes, producing dynamic pivots with live extension. Ideal for contextualizing BOS/CHoCH events across multiple scales.
💸 Multi-Account Lot Size Panel
Calculates position size for up to five accounts simultaneously, using your defined capital, risk %, and fixed SL distance (in pips). Results appear in a clean table at the bottom-right corner of the chart.
🎨 Session Visualization
Colored backgrounds mark key trading phases:
🟢 Day division
🔴 No-action zone
🔵 Kill-zone
🟡 Hold session
⚙️ Customization & Performance
Every module can be toggled individually, with full color, opacity, and style control. The script is optimized for overlay use and supports up to 500 boxes, lines, and labels with efficient resource handling.
🧠 Best Use Case
LANZ Origins is ideal for traders who follow:
Smart Money Concepts / ICT methodology
Liquidity & Imbalance-based trading
Multi-timeframe confluence setups
Risk-based position sizing workflows
Use it to observe how price interacts with liquidity pools, higher-timeframe candles, and imbalances within key sessions — while monitoring lot size risk in real time.
📌 Recommended Setup
Timeframes: 30m - 5m – 3m
Pairs: FX
Session Timezone: New York (EST/EDT)
Combine with: LANZ Strategy series for execution and journaling
💬 Note
This indicator does not generate buy/sell signals. It’s a visual and analytical tool built to support your own decision-making process.
