Pine Script®指标
Options

TWIX TRAP V2 - Ultimate Signal Engine# TWIX TRAP V2 - Ultimate Signal Engine
## 🎯 Professional Multi-Layer Trading System
TWIX TRAP V2 is a sophisticated trading signal system that combines **liquidity analysis**, **exhaustion detection**, and **momentum triggers** to identify high-probability trade setups.
---
## 🔥 How It Works
The indicator uses a **4-step confirmation process** before generating any signal:
**Step 1: Liquidity Purge Detection**
Monitors key price levels (Daily, Weekly, Monthly highs/lows) and detects when smart money hunts stop losses.
**Step 2: Exhaustion Analysis (Heavy Matrix)**
Uses weighted Z-score calculations to identify when the market is overextended and due for a reversal.
**Step 3: Ready State Confirmation**
Only when BOTH liquidity purge AND exhaustion align does the system enter a "ready" state.
**Step 4: Precision Trigger (Light Matrix)**
Times the exact entry when momentum begins reversing, ensuring optimal entry points.
---
## ⚡ Key Features
✅ **4 Quality Modes** - From Sniper (1 signal/week) to Scalper (10+ signals/day)
✅ **Multi-Timeframe Liquidity** - Tracks Monthly, Weekly, Daily, 4H, and 1H levels
✅ **Dynamic Zones** - Self-adjusting thresholds based on market conditions
✅ **Signal Strength Rating** - 1-4 rating based on liquidity level significance
✅ **Visual Dashboard** - Real-time status of all system components
✅ **Strong Signal Alerts** - Special markers for high-probability setups
---
## 📊 Signal Quality Options
| Quality Mode | Signals | Best For |
|--------------|---------|----------|
| Sniper (1/week) | ~1/week | Swing trading, major reversals |
| High (1/day) | ~1/day | Day trading (recommended) |
| Medium (3-5/day) | 3-5/day | Active trading |
| Scalper (10+/day) | 10+/day | Scalping, high frequency |
---
## 🎨 Visual Guide
- **X Marker (Green/Red)** - Liquidity purge detected
- **Background Color** - Green = BUY ready, Red = SELL ready
- **Triangle** - Normal signal (strength 1-2)
- **Dot + Label** - STRONG signal (strength 3-4) ⭐
---
## 📈 Works Best On
- Cryptocurrencies (SOL, BTC, ETH)
- Forex pairs
- Indices
- Any liquid market
**Recommended Timeframes:** 15m, 30m, 1H, 4H
---
## ⚠️ Risk Disclaimer
This indicator is a trading tool, not financial advice. Always manage your risk properly and never trade with money you cannot afford to lose. Past performance does not guarantee future results.
---
## 🔑 Access
This is an **invite-only** indicator. Contact me for access details.
---
**Happy Trading! 🎯**
Pine Script®指标

Options Liquidity Meter (OLM)❓ The question behind this indicator
When trading options, it is common to experience situations where price moves in the expected direction, yet the option contract does not increase in value as anticipated.
This typically happens when one or more of the following conditions is missing:
Insufficient liquidity participation
Lack of volatility expansion
Weak or passive order flow
Options Liquidity Meter (OLM) was created to address this specific question:
“If price moves from here, are there conditions for option premiums to actually expand?”
🎯 What this indicator does
Options Liquidity Meter is a context tool, not a trading system.
It evaluates whether the current market environment is favorable for option premium expansion , based on three core engines:
Liquidity (Relative Volume)
Measures whether price movement is supported by meaningful participation.
Volatility State
Identifies compression, release, and expansion phases, where options tend to respond differently.
Order Flow Activity (OBV-based)
Acts as a proxy for active vs. passive participation, helping filter hollow moves.
These components are combined into a single, easy-to-read options context.
🟢🟡🔴 Options Context Output
The indicator displays one consolidated state:
RED — NO EXPANSION
Price may move, but option premiums often do not respond.
YELLOW — BUILDING
Liquidity or volatility is developing. Conditions are improving but not fully aligned.
GREEN — EXPANSION LIKELY
Liquidity, volatility expansion, and active flow are aligned.
This is a favorable environment for option premium expansion.
The same logic is reflected visually through the background color and summarized in the dashboard.
📊 How to read the dashboard
The dashboard shows:
Liquidity: LOW / OK / HIGH
Volatility: COMPRESSED / RELEASED / EXPANDING
Order Flow: FLAT / ACTIVE
Options Context: NO EXPANSION / BUILDING / EXPANSION LIKELY
Below, a Background Color Meaning section explains what each color represents, making the indicator intuitive and educational.
📍 Where to apply this indicator
Options Liquidity Meter must be applied to the underlying asset chart, such as:
Indices (SPY, SPX, QQQ, etc.)
Stocks
Futures
ETFs
It is not designed to be applied to option contracts themselves.
The indicator evaluates the market conditions of the underlying, which are the drivers that influence option premium behavior.
Contract selection (strike, delta, gamma, expiration) remains the trader’s responsibility.
🧠 How to use it
Use your own methodology to define:
Direction
Structure
Entries and exits
Use Options Liquidity Meter to evaluate:
Whether the current environment supports option premium expansion
If the context is RED, be cautious — price may move without rewarding options.
If the context is GREEN, the environment is statistically more favorable for options responsiveness.
🔗 Complementary tools
Options Liquidity Meter is designed to complement, not replace, other tools.
It works well alongside:
Opening Path Selector (EMA200 Context Tool)
For deciding which asset offers the cleanest directional context.
Multi-Tool VWAP + EMAs (Multi-Timeframe) + Key Levels
For in-chart structure, bias, and reference levels.
Each tool addresses a different stage of the decision process and can be used independently.
⚠️ Important notes
This indicator provides context only
It does not generate trading signals
No indicator guarantees results
Use at your own risk.
Pine Script®指标

Weekly Debit Spread VWAP + Prior Day + Dual ConfirmOpen Debit Spreads using previous day and current vwap
Pine Script®指标

Newton Pulse Pro AI Exclusive – Newton
Next-Generation Trend Intelligence & Smart Range Filtering
Introduction Newton is the newest powerhouse in the AI Exclusive series, specifically engineered to master trend dynamics. While most indicators fail during choppy, sideways markets, Newton uses advanced AI logic to distinguish between a true trending move and a high-risk range. It is designed for traders who value quality over quantity, providing signals only when the market has clear momentum.
Key Benefits
✅ Smart Range Filtering: Automatically detects sideways markets and remains silent to protect you from "choppy" price action.
✅ Pure Trend Following: Focuses exclusively on high-probability Buy and Sell entries within established trends.
✅ Noise Reduction: Eliminates false signals by ignoring minor price fluctuations that do not lead to real moves.
✅ Strategic Patience: Encourages disciplined trading by only appearing when the market conditions are optimal.
✅ Universal Application: Optimized for Forex, Crypto, Stocks, and Commodities.
General Specifications
Product Name: Newton (Powered by AI Exclusive)
Trading Style: Trend Following & Momentum
Signal Type: Non-Repaint (Signals are fixed once the candle closes)
Market Phase Detection: Intelligent Range/Trend differentiation
Visual Design: Clean, minimalist interface focused on entry execution
Individual Product Presentation: Newton (Trend Master)
Overview: An AI-driven indicator that specializes in identifying the "Law of Motion" in the market. It provides Buy/Sell signals only when a trend is confirmed, staying completely inactive during ranging phases to prevent capital erosion.
Benefits:
Avoids "Death by a Thousand Cuts" in sideways markets.
Provides clear, decisive entry points for Buy and Sell orders.
Simplifies the chart by removing unnecessary clutter and noise.
Features:
Proprietary Trend Logic: Analyzes market structure to ensure signals are backed by real volume and momentum.
Zero-Signal Range Mode: The indicator remains quiet when the market lacks a clear direction—one of its most powerful features.
Visual Precision: High-contrast labels and signals for instant decision-making.
Compatibility: Works seamlessly across all timeframes, from 1-minute scalping to weekly swing trading.
⚙️ Installation & Activation Guide
Secure Your License Purchase the Newton indicator or the full AI Exclusive Package through our official website.
Submit Your TradingView Details After purchase, send your TradingView email address to our support team for authorization.
Account Verification Our team will process your request and grant access to the proprietary script.
Activation & Use * Open TradingView.
Navigate to Indicators → Invite-Only Scripts.
Select AI Exclusive: Newton to apply it to your chart.
Pro Tip: When Newton is not showing signals, it is a signal in itself—it's telling you to stay on the sidelines and wait for a high-probability breakout.
Pine Script®指标

Options Gamma Flip Zones [BackQuant]Options Gamma Flip Zones
A market-structure style “gamma flip” mapper that builds adaptive strike-like zones, scores how price interacts with them, then promotes the strongest candidates into confirmed flip zones. Designed to highlight pinning, failed breaks, and rotational behavior without needing live options chain data.
What this indicator does
This script identifies price levels that behave like “strike magnets” during conditions that resemble options pinning, then draws dynamic zones around those levels.
Instead of assuming every round number matters, it:
Creates a strike ladder (auto or manual step).
Applies a regime filter that looks for “pin-friendly” market conditions.
Tracks and scores repeated interactions with the level.
Upgrades a zone from candidate to confirmed when enough evidence accumulates.
Invalidates zones when price achieves sustained acceptance away from them.
The output is a set of shaded boxes (zones) centered on strike-like levels, with text readouts that show the current state of each zone.
Key concept: “Gamma proxy”
A true gamma flip requires options positioning data. This indicator does not use options chain gamma.
Instead, it uses a proxy approach:
When markets have elevated volatility relative to their recent baseline AND trend strength is weak, price often behaves “sticky” around key levels.
In those conditions, repeated touches and failed escapes around a level behave similarly to pinning around strikes.
So this tool is best read as:
“Where would a strike-like magnet likely exist right now, based on price behavior and regime conditions?”
How zones are created
Zones only start forming when the script detects a pin-friendly regime.
1) Strike Ladder (level selection)
Auto Strike Step selects a step size based on current price magnitude (bigger price, bigger step).
Manual Strike Step lets you force a fixed increment.
The current “active level” is the nearest rounded level to price.
Major Level Every optionally marks major ladder levels (multiples of step).
2) Band construction (zone thickness)
Each zone is a symmetric band around the level, using one of two modes:
ATR mode scales thickness with volatility.
Percent mode scales thickness as a fraction of price.
This matters because “pin behavior” is not a single tick. It’s a region where price repeatedly probes and rejects.
Regime filter (when the script is allowed to believe in pinning)
A zone is only eligible to form and strengthen when Pin Regime is active. Pin Regime is a conjunction of:
1) IV proxy (ATR z-score)
Uses ATR as a volatility proxy.
Converts ATR% into a z-score relative to a long lookback.
IV Proxy Threshold controls how elevated volatility must be before the script considers pinning likely.
2) Weak trend requirement
The script also requires price action to be non-trending:
EMA spread must be small (fast vs slow EMA not diverging strongly).
ADX must be below a ceiling, confirming weak directional trend strength.
Interpretation:
High “IV proxy” + weak trend is where pin-like behavior is most common.
If trend is strong, zones are less meaningful because price is more likely to accept away from levels.
Flip confirmation logic (what upgrades a zone)
A zone is not “confirmed” just because price is near it once. The script builds conviction via evidence accumulation.
Evidence types:
Touches : price comes close to the level within tolerance.
Failed escapes : price pushes outside the band but closes back inside (rejection).
Acceptance run : consecutive closes outside the band, suggesting price is accepting away from the zone.
Protections:
Touch Cooldown prevents counting the same micro-chop as multiple touches.
Acceptance Bars defines what “real acceptance” means, so the zone does not get invalidated by one noisy bar.
A zone becomes confirmed when:
Touches meet the “evidence” requirement.
Failed escapes meet the “rejection” requirement.
The regime filter still says the market is pin-friendly.
That is important, it avoids promoting levels that only worked briefly in a trending tape.
Zone scoring and lifecycle
Each zone maintains a score that evolves over time. Think of score as “how much this level has recently behaved like a magnet.”
Score dynamics:
Decay per bar : score fades over time if price stops respecting the zone.
+ per touch : repeated proximity increases score.
+ per failed escape : rejections add stronger reinforcement.
- per acceptance bar : sustained trading outside reduces score.
Min score to draw : prevents clutter from weak, low-confidence zones.
Invalidation:
If the score becomes very weak AND price achieves sustained acceptance away from the zone, the zone is deleted.
This keeps the chart clean and ensures zones represent current market behavior, not ancient levels.
How to read the plot on chart
1) Zone fill and border
Each zone is drawn as a box extended to the right.
Fill opacity adapts to zone strength, strong zones are visually more prominent.
Border color encodes the current directional context and special events.
2) Bullish vs bearish coloring
A zone is colored bullish when price is currently trading above the zone’s mid-level.
A zone is colored bearish when price is currently trading below it.
This is not a trade signal by itself, it is a state cue for “which side is in control around the level.”
3) Failed escape highlighting
If price attempts to break above the band and fails, the border temporarily highlights as a failed up escape.
If price attempts to break below the band and fails, the border temporarily highlights as a failed down escape.
These are the moments where pin behavior is most visible:
Break attempt.
Immediate rejection.
Return to the band.
4) Midline (optional)
The zone midline is the strike-like level itself.
It is dotted to distinguish it from price structure lines.
5) Optional strike ladder overlay
When enabled, the script draws major and minor ladder lines near current price.
Major levels are thicker and less transparent.
This is a visualization aid for “where the algorithm is rounding,” not a prediction tool.
On-chart text readout (what the box text means)
Each box prints a compact state summary, designed for fast scanning:
Γ CANDIDATE means the zone is being tracked but not yet validated.
Γ FLIP (PROXY) means the zone has met confirmation requirements.
BULL/BEAR indicates which side price is on relative to the mid-level.
L prints the level value.
T is touch count, repeated proximity events.
F is fail count, rejected escape attempts.
IVz is the volatility proxy z-score at the moment.
ADX is the trend strength context.
Practical use cases
1) Pinning and range trading context
Confirmed zones often act like gravity wells in sideways or rotational regimes.
When price repeatedly fails to escape, fading outer edges can be reasonable context for mean reversion workflows.
2) Breakout validation
If price achieves acceptance outside the band for multiple bars, that is stronger breakout context than a single wick.
Zones that invalidate cleanly can mark transitions from pinning to directional move.
3) Time your “do nothing” periods
When Pin Regime is active and a zone is confirmed, the tape often becomes sticky and inefficient for trend chasing.
This helps avoid taking trend entries into a pin environment.
Alerts
Standalone alertconditions are included:
Zone Confirmed : a candidate becomes confirmed.
Zone Touch : price touches an active zone within tolerance.
Zone Invalidated : the zone loses relevance and is removed.
Tuning guidelines
Sensitivity vs quality
Lower Touches Needed and Failed Escapes Needed creates more zones faster, but with lower quality.
Higher values create fewer zones, but the ones that remain are more behaviorally “proven.”
Band width
ATR mode adapts to volatility and is typically safer across assets.
Percent mode is consistent visually but can feel too tight in high vol or too wide in low vol if not tuned.
Regime thresholds
If you want fewer zones, raise IV proxy threshold and tighten weak-trend filters.
If you want more zones, lower IV proxy threshold and loosen weak-trend filters.
Limitations
This is a proxy model, not live options gamma.
In strong trends, pinning assumptions can break, the regime filter is there to reduce that risk, but not eliminate it.
Auto strike step is designed for typical market ranges, manual step is recommended for niche tick sizes or custom markets.
Disclaimer
Educational and informational only, not financial advice.
Not a complete trading system.
Always validate settings per asset and timeframe.
Pine Script®指标

Pine Script®指标

0DTE Credit-Spread Morning FilterUPDATE: NATIVE ALERTS ADDED!
You asked, we delivered. You no longer need to sit and stare at the dashboard waiting for a green signal.
1. New "Trade Entry Signal" Alert:
I have added a custom alert condition to the code. This triggers the exact moment the dashboard flips from "NO TRADE" to "GREEN" (Strategy Found).
2. How to set it:
Simply click the "Create Alert" button (clock icon) in TradingView, select this indicator, and choose "Trade Entry Signal" from the list.
Now you can get notified on your phone or desktop instantly when the market conditions align for a 0DTE play.
Happy Trading!
Pine Script®指标

LQL Legend TableFollowing me on X - x.com
LQL Legend Table draws a small legend table on your chart (overlay) so you can label your plotted lines/levels with:
• a color swatch (matches your line color)
• a label text (Column 1)
• an optional extra text (Column 2)
It’s meant to act like a persistent “key” for multi-line indicators (so users don’t have to guess what each color means).
Smart behavior
• Only renders on the last bar (so it doesn’t waste work on every historical bar).
• Automatically hides the “Extra” column if none of the enabled rows use it (so you get a cleaner 2-column layout by default).
• Only shows enabled rows, and packs them together (no gaps).
Options available (Inputs)
General
• Version (read-only display): shows the script version in settings.
• Show Legend Table: master toggle on/off.
• Top Buffer Rows (0–5): adds empty spacer rows above the legend.
• Bottom Buffer Rows (0–5): adds empty spacer rows below the legend.
Layout
• Table Position:
• Top Left / Top Center / Top Right
• Bottom Left / Bottom Center / Bottom Right
Styling
• Table Background: background color for the text cells.
• Font Color: text color.
• Font Size: Tiny / Small / Normal / Large
Pine Script®指标

DAILY INTRADAY KEY LEVELS by TenAMTrader📌 DAILY INTRADAY KEY LEVELS — by TenAMTrader
DAILY INTRADAY KEY LEVELS is a precision-built intraday mapping tool designed to keep traders aligned with the most important price references used by institutions and active day traders.
This indicator automatically plots Previous Day RTH levels, Overnight levels, and the Opening Range (ORB) using New York session timing, so your levels remain consistent and reliable across all intraday timeframes.
🔑 Levels Included
Previous Day (RTH)
PDH – Previous Day Regular Trading Hours High
PDL – Previous Day Regular Trading Hours Low
(Locked at the RTH close for accuracy)
Overnight Session (16:00–09:30 NY)
ONH – Overnight High
ONL – Overnight Low
(Tracks live overnight and finalizes at the cash open)
Opening Range (09:30–09:45 NY)
ORBH – Opening Range High
ORBM – Opening Range Midpoint
ORBL – Opening Range Low
🎯 Why These Levels Matter
These price levels frequently act as:
Liquidity targets
Support & resistance
Decision points for continuation vs. rejection
Bias filters for trend days vs. range days
The Opening Range, in particular, is a cornerstone of many institutional and professional trading models.
⚙️ Customization & Controls
Toggle each level on/off independently
Choose solid lines or line-with-breaks
Adjustable line width and colors
Optional future-extending rays
Clean single-label system (no clutter)
Text-only or boxed labels
Configurable label side, size, and offsets
Optional current-day-only view to keep charts clean
All values remain timeframe-independent, meaning your levels will not change when switching chart intervals.
📈 Best Use Cases
Futures, Index, and Equity day trading
Opening drive & ORB strategies
Fade vs. continuation decision-making
Level confluence with VWAP, trend, or volume tools
⚠️ Disclaimer
This indicator is for educational and informational purposes only. It does not constitute financial advice or trade recommendations. Trading involves risk, and past performance is not indicative of future results. Always manage risk and trade according to your own plan.
Built for traders who plan first, execute second, and respect key levels.
— TenAMTrader
Pine Script®指标

Max Pain Options [QuantLabs] v5 (Balanced)Institutional Grade Options Analysis: Max Pain, Gamma & Pin Risk
For years, TradingView users have been flying blind without access to Options Chain data. QuantLabs: Max Pain & Gamma Exposure changes that. This is not just a support/resistance indicator—it is a sophisticated, algorithmic model that reverse-engineers the incentives of Market Makers using synthetic Black-Scholes logic.
This tool visualizes the "invisible hand" of the market: the hedging requirements of large dealers who are forced to buy or sell to keep their books neutral.
CORE FEATURES:
🔴 Max Pain Gravity Model The bright red line represents the "Max Pain" strike—the price level where the maximum amount of Options Open Interest (Calls + Puts) expires worthless.
Theory: As OpEx (Expiration) approaches, Market Makers maximize profits by pinning the price to this level.
Strategy: Use this as a mean-reversion target. If price is far away, look for a snap-back to the red line.
🟣 Gamma Exposure Profiles (The Purple Lines) These neon histograms show you the estimated "Gamma Walls."
Long Gamma: Dealers trade against the trend (stabilizing price).
Short Gamma: Dealers trade with the trend (accelerating volatility).
Visual: The larger the purple bar, the harder it will be for price to break through that level.
📦 Algorithmic "Pin Risk" Zones The dashed red box highlights the "Kill Zone." When price enters this area near expiration, volatility often dies as dealers pin the asset to kill retail premiums.
Warning: Do not expect breakouts while inside the Pin Zone.
📊 Institutional HUD A clean, non-intrusive dashboard provides real-time Greeks and risk analysis:
Pin Risk: High/Medium/Low probability of a pinned close.
Exp Mode: Detects if the market is in "Short Gamma" (Squeeze territory) or "Long Gamma" (Chop territory).
HOW IT WORKS (The Math): Since live options data is not available via Pine Script, this engine uses a proprietary Synthetic OI Distribution Model. It inputs Volume, Volatility (IV), and Time-to-Expiry into a modified Black-Scholes equation to probability-map where the heavy open interest likely sits.
SETTINGS & CUSTOMIZATION:
Responsiveness: Tuned for the "Goldilocks Zone" (Spread: 12, Decay: 22) to catch local liquidity walls without over-fitting.
Visuals: Designed for Dark Mode. High-contrast Neon aesthetics for maximum readability.
Pine Script®指标

Option Price SR (csgnanam)## ⚖️ Disclaimer
This script is provided for **educational and analytical purposes only**.
It does not constitute financial advice.
Use proper risk management and trade responsibly.
---
## 📌 Indicator Concept & Trading Logic
This is a rule-based reference indicator designed to interpret **option price behavior** using **previous-day derived equilibrium levels**.
The indicator helps traders classify the market into **range-bound, breakout, or invalid trade zones** by observing how **ATM Call (CE) and Put (PE)** prices react around these levels.
All levels are **fixed for the trading day** and recalculated only on the next session.
---
## 📊 Core Levels Explained
The indicator plots the following **daily-anchored reference levels**:
* **PDH / PDL** – Previous Day High / Low of the option
* **PDC** – Previous Day Close
* **100% AVG (Breakout Zone)**
Average of previous-day CE and PE prices for the same strike
* **75% AVG (Midzone)**
Balance / decision zone
* **50% AVG (Support Zone)**
Lower acceptance / decay boundary
These levels act as **reaction zones**, not prediction lines.
---
## 🧠 Market Interpretation Logic
### 1️⃣ Range-Bound Market Condition
* When **both ATM CE and ATM PE** are **trading within the 100% AVG (Breakout) level**,
the market has a **high probability of remaining range-bound**.
* Premium expansion is limited on both sides.
* Ideal environment for **non-directional strategies**.
---
### 2️⃣ Breakout Validation
* A **true directional move** requires **asymmetry** between CE and PE.
* If **one side moves into breakout**, the **opposite side must stay suppressed**.
**Example:**
* If **CE breaks down below Midzone**,
then **PE must be above Breakout or at least above Midzone**.
* The same logic applies inversely for PE breakdowns.
This confirms **capital rotation**, not random premium decay.
---
### 3️⃣ Midzone (75%) – Reversal Watch Area
* The **Midzone** is a **high-probability reaction area**.
* Many intraday reversals initiate from this level.
* Price acceptance or rejection here defines:
* Continuation
* Mean reversion
* Failed breakout
This zone should be **closely monitored for structure and volume behavior**.
---
### 4️⃣ Support Zone (50%) – Trade Invalidation
* When an option price trades **below the Support (50%) level**:
* That option side becomes **non-tradable**
* Premium strength is lost
* Risk increases significantly
Trades **below support** are considered **low probability** and should be avoided.
---
## ⚠️ Important Usage Notes
* This indicator is **not a buy/sell signal generator**
* It is a **context and decision-filter tool**
* Best used in combination with:
* Price action
* Structure
* Spot/index behavior
* Time-of-day context
All levels are **session-anchored** and do **not repaint intraday**.
---
## 🎯 Intended Use Case
* Intraday option traders
* ATM / near-ATM focus
* Range vs directional market identification
* Premium behavior analysis
* Trade filtering and risk control
---
Pine Script®指标

ETF-Futures Opening Ratio (Table)This indicator calculates the opening price ratio between an ETF and its corresponding futures contract using the 9:30 AM New York (RTH) opening price.
The ratio is locked at the official market open and remains fixed throughout the session, providing a stable reference for:
Translating ETF price levels into futures equivalents
Comparing relative value and premium/discount behavior
Maintaining consistent cross-instrument analysis during the trading day
The output is displayed in a simple on-chart table for quick reference and minimal chart clutter.
Pine Script®指标

NY Open First Candle (9:30 AM EST) - 15m/1H/4H + FibNY Open First Candle (9:30 AM EST) - 15m/1H/4H + Fib
Pine Script®指标

NSE Option Strike Prices by GoldenJetNSE Option Strike Prices Dashboard by GoldenJet
This Pine Script indicator is designed specifically to assist option buyers in making more informed decisions when trading NSE index options (NIFTY, BANKNIFTY, FINNIFTY, and MIDCAP NIFTY).
Key Benefits for Option Buyers:
It displays live Last Traded Prices (LTP) for 7 key strikes around a reference ATM level: 3 strikes below, the ATM, and 3 strikes above.
Helps buyers prioritize In-The-Money (ITM) strikes, which generally offer higher delta and better probability of profit compared to At-The-Money (ATM) or Out-Of-The-Money (OTM) options.
OTM strike prices are intentionally highlighted in RED color (with smaller font) to visually discourage selection of lower-probability OTM options, encouraging buyers to focus on ITM strikes for safer premium decay and directional plays.
The ATM strike is prominently highlighted for quick reference.
Real-time spot price is used to identify the true ATM, ensuring the dashboard reflects current market conditions.
This tool promotes disciplined strike selection by making it easy to spot premium levels across relevant strikes, reducing the risk of overpaying for OTM options with low intrinsic value.
How to Use:
Apply the indicator to any chart (preferably the underlying index chart, e.g., NSE:NIFTY).
Manual Inputs Required:
Spot Symbol: Choose from NIFTY, BANKNIFTY, FINNIFTY, or MIDCAP.
Strike Interval:
NIFTY: 50
BANKNIFTY: 100
FINNIFTY: 50
MIDCAP NIFTY: 25
Expiry Date: Enter Day (e.g., 23), Month (e.g., 12), Year (e.g., 25) for the target weekly/monthly expiry (format: DD MM YY).
Reference ATM Strike: Manually enter the approximate current ATM strike (e.g., closest strike to spot price). This anchors the 7 strikes displayed.
Customize layout: Dashboard position (e.g., bottom_right) and font size for better visibility.
The dashboard appears as a clean table overlay with columns for CE LTP, Strike, and PE LTP, updated in real-time.
Ideal for intraday or expiry-day option buyers looking to avoid common pitfalls like chasing cheap OTM premiums.
Feel free to use and share — happy trading!
Pine Script®指标

InCrypto WatermarkInCrypto Watermark
A customizable overlay indicator that displays essential trading information directly on your TradingView charts. This tool helps traders quickly access key market data without cluttering the chart interface.
KEY FEATURES:
• Symbol Information: Displays current trading pair and active timeframe
• Price Display: Optional current price with smart precision formatting
• Price Change: Optional price change percentage over 24 bars with color-coded indicators
• Date & Time: Multiple format options for date (DD/MM/YYYY, MM/DD/YYYY, YYYY-MM-DD, DD.MM.YYYY) and time (HH:MM, HH:MM:SS)
• Custom Text: Customizable title and subtitle text
• Full Customization: Adjustable positioning, colors, sizes, alignment, and opacity for all elements
• Visibility Controls: Show/hide individual elements independently
• Background Options: Customizable background color, opacity, and optional borders
SETTINGS:
The indicator is organized into logical groups:
- Text Content: Title and subtitle customization
- Visibility: Individual show/hide controls for each element
- Watermark Position: Flexible placement options
- Symbol Info Position: Separate positioning controls
- Cell Size: Width and height adjustments
- Title/Subtitle/Symbol Info Settings: Color, size, alignment, and opacity controls
- Background Settings: Background color, opacity, and border options
USE CASES:
• Chart branding for trading groups or channels
• Quick reference for essential trading information
• Professional-looking charts for screenshots
• Multi-timeframe analysis assistance
TECHNICAL DETAILS:
• Pine Script v6
• Overlay indicator
• Works on all TradingView-supported markets and timeframes
• Real-time updates
HOW TO USE:
1. Add the indicator to your chart
2. Customize title and subtitle in Text Content settings
3. Adjust positioning for watermark and symbol info sections
4. Enable/disable individual information elements as needed
5. Fine-tune colors, sizes, and opacity to match your chart style
The indicator automatically adjusts price precision based on the asset's price level. Price change is calculated over 24 bars of the current timeframe (not 24 hours).
DISCLAIMER:
This indicator is for informational purposes only. It does not constitute investment advice, financial advice, trading advice, or any other type of advice. Past performance does not guarantee future results. Always conduct your own research and risk management before making trading decisions. Trading involves substantial risk of loss and is not suitable for every investor.
Pine Script®指标

ORB 5 Min Break & Retest + Alerts By Khan 0.1 verORB 5-Minute Break & Retest Indicator
This indicator plots the high and low of the first 5-minute candle of the trading session (Opening Range). It then monitors price for a breakout above or below the ORB levels and triggers an alert when price retests the broken level and holds.
Designed to help identify high-probability ORB continuation setups with clear visual levels and TradingView alerts.
Pine Script®指标

XSP 5 DTE Combo: Safe & AggressiveStrategy Document: XSP 5 DTE Trend-Follower
Objective: Systematic capital growth using weekly XSP (Mini-SPX) Options while maintaining a high-interest cash reserve.
1. The Core Philosophy
The strategy is built on three pillars: Directional Trend Following, Volatility Filtering, and Capital Preservation. Unlike "Buy & Hold," this system only risks capital when the market shows clear momentum. By using XSP Options, we gain leveraged exposure with a defined maximum risk (the premium paid).
2. Capital Management (The 70/30 Rule)
70% Safety Reserve: Held in low-risk, interest-bearing instruments (e.g., US Treasury Bills or Money Market Funds). This acts as a collateral base and generates a steady 4–5% yield, offsetting trading costs and providing a psychological "anchor."
30% Active Trading Capital: Used for purchasing XSP Options.
Scaling: Start with 1 contract. Increase position size by 1 contract for every $10,000 of account growth.
3. Execution Rules
Trading Day: Every Thursday.
Entry Time: 15:30 – 16:00 CET (Wall Street Open).
Instrument: XSP Index Options (Standard Delta 50 / At-The-Money).
Expiration: 5 Days to Expiration (DTE) – typically the following Tuesday.
Exit: Hold to expiration (maximum gain) or close manually at +100% ROI.
Technical Script Description: "ATR Pro Trend Combo"
The Pine Script (v6) serves as a binary gatekeeper. It suppresses trades during low-probability environments and highlights entries during high-conviction trends.
Key Indicators & Logic:
Trend Filter (EMA 50): Determines the "Primary Trend." We only buy Calls if the price is above the 50-period EMA, and Puts if it is below. This prevents trading against the institutional flow.
Momentum Switch (SuperTrend): Acts as a trailing volatility-based confirmation. The script requires the SuperTrend to align with the EMA direction (Green for Calls, Red for Puts).
Volatility Threshold (ATR): Filters out "flat" markets. A trade is only signaled if the current Average True Range (ATR) is at least 80–90% of its long-term average. This ensures there is enough "swing" in the market to overcome the Theta (time decay) of the options.
Seasonal Overlay: An automated hard-stop for January and September, months that historically exhibit high randomness and trend reversals.
Multi-Mode Functionality:
Safe Mode: Uses a tighter 2.0 SuperTrend multiplier and 0.9 ATR threshold. Best for accounts under $15,000 to maximize Capital Preservation.
Aggressive Mode: Uses a 2.5 multiplier and 0.8 ATR threshold. Increases trade frequency to accelerate compounding once a capital buffer is established.
How to use this in TradingView:
Copy the latest code provided into the Pine Editor.
Add to Chart and ensure you are on the Daily (1D) or 4-Hour (4H) timeframe for the best signal quality.
Check the Dashboard on the top right for the current Season and Trend status before executing your Thursday trade.
Pine Script®指标

CGM - Options Trial [Basic] - by ChartGptMarathiCGM - Options Premium Trial - by ChartGptMarathi
Description:
The CGM - Options Premium Trial is the introductory version of the advanced CGM Sniper suite, designed specifically for Option Buyers who need clarity in a chaotic market.
This indicator allows you to plot and compare Call (CE) and Put (PE) option charts simultaneously on a single pane, providing a direct view of premium behavior without switching tabs. It includes essential trend-following tools to help you identify momentum shifts instantly.
Key Features:
Dual Charting: Visualizes both Call and Put option candles on one screen for real-time comparison.
Trend Confirmation: Includes a built-in 8 EMA to gauge short-term momentum.
Volume Analysis: Integrated VWAP (Volume Weighted Average Price) for institutional level tracking.
Spot Tracking: Monitors the underlying Spot symbol (e.g., NIFTY/BANKNIFTY) data for better context.
Visual Clarity: Clean, color-coded candles (Green/Red) with customizable widths and visibility toggles.
How to Use:
Add the indicator to your chart.
In the settings, select your Call (CE) and Put (PE) symbols (e.g., NIFTY24000CE, NIFTY24000PE).
Select the Spot Symbol (e.g., NSE:NIFTY) for underlying data reference.
Use the EMA and VWAP lines to determine trend direction. If the premium price is above both lines, the momentum is bullish for that option.
Disclaimer:
This indicator is for educational and analytical purposes only. It does not constitute financial advice. Trading options involves significant risk. Please perform your own due diligence before executing any trades.
All rights reserved with ChartGptMarathi. For any feedback or support, contact at: chartgptmarathi@gmail.com
Pine Script®指标

Magical Lines (Dot-to-Dot)Fill the value of Support/Resistance as you like.
This Indicator calculates some Targets for you as Magical Lines.
This Indicator works with any Instruments such Stock/F&O/Index/Commodity.
Note: Use value of ORB 10-15 min or Nearest HH/HL/LH/LL as Support/Resistance.
Pine Script®指标

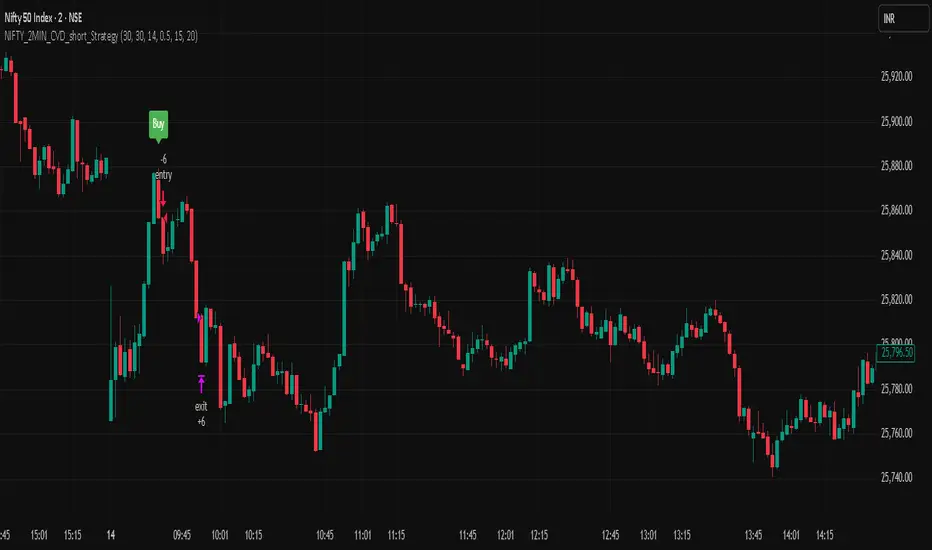
NIFTY_2MIN_CVD_short_StrategySummary
This strategy is an intraday system designed for the Nifty index on a 2-minute timeframe, focusing exclusively on identifying high-probability short (sell) entries. It utilizes a combination of rapid price action and Cumulative Volume Delta (CVD) to detect "Buying Absorption" at local peaks.
Concept & Core Logic
The strategy is engineered to identify "Inverted V-shaped" reversals where aggressive buying pressure is exhausted and absorbed by large-scale limit orders from sellers.
Price Action Trigger: The strategy looks for a specific two-part sequence:
Sudden Bullish Movement: A rapid upward move that often traps late buyers or triggers short-covering.
Sudden Reversal: Immediately followed by a strong, high-momentum bearish (red) candle, signaling a swift rejection of the higher prices.
CVD Absorption Filter: To confirm the validity of the reversal, the strategy analyzes the Cumulative Volume Delta (CVD). It identifies instances where the relative movement of the CVD is significantly higher than the corresponding price movement. This specific divergence highlights "Buying Absorption"—a market condition where aggressive market buy orders are being filled by passive limit sell orders, preventing further price appreciation and creating a heavy ceiling for the reversal.
Risk Management
To maintain a disciplined approach, the strategy employs fixed exit parameters based on the underlying Nifty price:
Take Profit: 25 points.
Stop Loss: 30 points.
Intended Use
This tool is intended for traders who study mechanical, rule-based systems and order flow dynamics. It provides a structured framework for observing how volume delta divergence (CVD) and rapid price rejections interact at potential market turning points.
Disclaimer: This script is for educational and informational purposes only. It is not financial advice. All trading involves risk, and past performance is not indicative of future results. Please conduct your own research and backtesting before making any trading decisions.
Pine Script®策略
Nifty_2MIN_Rangereversal_Short_StrategySummary
This strategy is an intraday trend-following system designed for the Nifty index on a 2-minute timeframe, focusing exclusively on short (sell) entries. It is engineered to identify failed bounces within established bearish trends.
Concept & Core Logic
The strategy uses a multi-layered approach to confirm downward momentum before triggering an entry:
Trend Confirmation: The script analyzes the slope and positioning of the 20-period and 200-period Exponential Moving Averages (EMA). Short signals are only valid when the EMA configuration confirms a prevailing bearish trend.
Retracement Zone Filtering: To optimize entry pricing, the strategy monitors the daily price range. It looks for the market to be within the 35% to 75% range of the day's movement, specifically identifying a temporary upward "relief rally" or bounce after a significant fall.
Candlestick Trigger: The execution occurs when a specific bearish reversal pattern appears during the relief rally:
Two consecutive bullish candles (representing the temporary bounce).
Followed by a strong, high-momentum bearish candle (signaling the resumption of the primary downtrend).
Risk Management
The strategy utilizes fixed exit parameters based on the underlying Nifty price points:
Take Profit: 28 points.
Stop Loss: 30 points.
Intended Use
This tool is intended for traders who study mechanical, rule-based systems. It demonstrates how moving average trends can be combined with range analysis and price action sequences to time entries during market retracements.
Disclaimer: This script is for educational and informational purposes only. It is not financial advice. All trading involves risk, and past performance is not indicative of future results. Please conduct your own research and backtesting before making any trading decisions.
Pine Script®策略

Nifty_2MIN_ Rangereversal_Long _StrategySummary
This strategy is an intraday trend-following system designed for the Nifty index on a 2-minute timeframe. It focuses exclusively on long entries, seeking to identify high-probability recovery points within an established uptrend.
Concept & Core Logic
The strategy identifies entries based on a confluence of trend direction, price recovery levels, and specific candlestick patterns:
Trend Confirmation: The script utilizes the slope and positioning of the 20-period and 200-period Exponential Moving Averages (EMA). A long signal is only considered when the trend is determined to be positive, ensuring trades align with the broader market momentum.
Recovery Zone Filtering: To avoid buying at local peaks, the strategy filters for entries that occur when the market has retraced but is showing signs of recovery. Specifically, it looks for price to be within the 35% to 75% recovery range relative to the day's high.
Candlestick Trigger: The actual entry trigger is a "Bullish Reversal" sequence:
Two consecutive bearish candles (representing a minor pullback).
Followed immediately by a strong bullish candle (representing the resumption of strength).
Risk Management
The strategy uses fixed point-based exits to maintain a disciplined approach:
Take Profit: 30 points (underlying Nifty price).
Stop Loss: 35 points (underlying Nifty price).
Intended Use
This script is designed for traders interested in mechanical trend-following systems. It provides a structured way to observe how moving average slopes and specific price action sequences interact during intraday recoveries.
Disclaimer: This script is for educational and informational purposes only. It is not financial advice. All trading involves risk, and past performance is not indicative of future results. Please conduct your own research and backtesting before making any trading decisions.
Pine Script®策略
