No Gaps - JizzanyNo Gaps – Jizzany
Fill the blanks. Own the patterns.
Don’t let thin futures feeds or blazing-fast 1 s bars break your flow—this overlay stitches every missing pixel back into your chart so you can:
🔍 Analyze low-liquidity markets (futures, exotic FX, crypto alt-pairs) without awkward jumps
⏱️ Trade ultra-low timeframes (1 s, tick charts) with full confidence in every wick
📈 Spot price patterns seamlessly, even when your broker’s feed skips a beat
How it works: Auto-detects gaps between sessions or feeds, then draws miniature candles from the prior close to the current open—using real intrabar highs/lows—so nothing ever goes unseen.
Perfect for scalpers, day traders, and anyone who demands continuity in every bar. Try it on your next chart and rediscover the story in every candle.
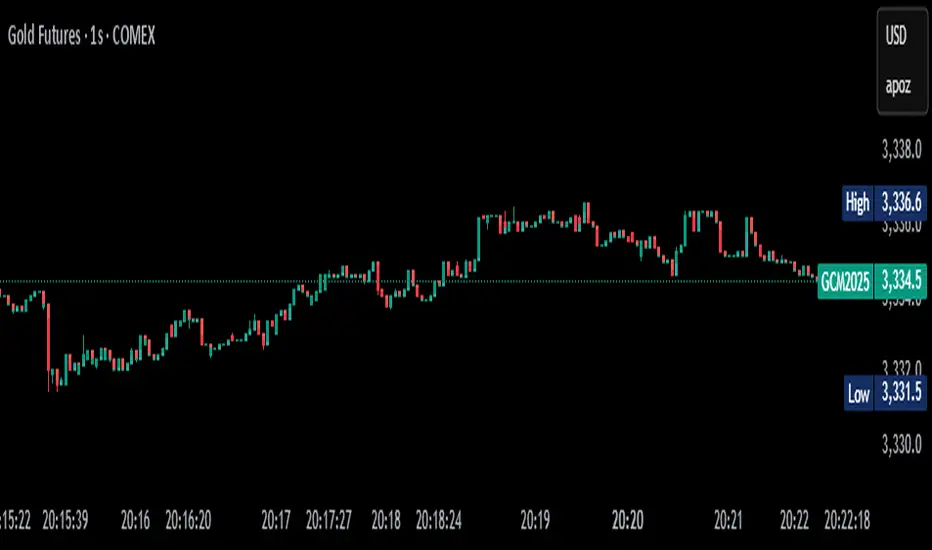
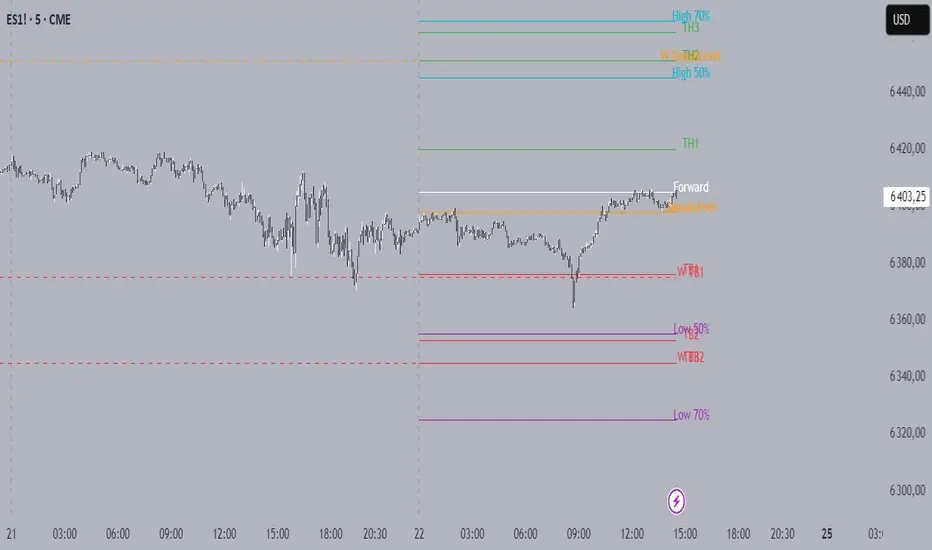
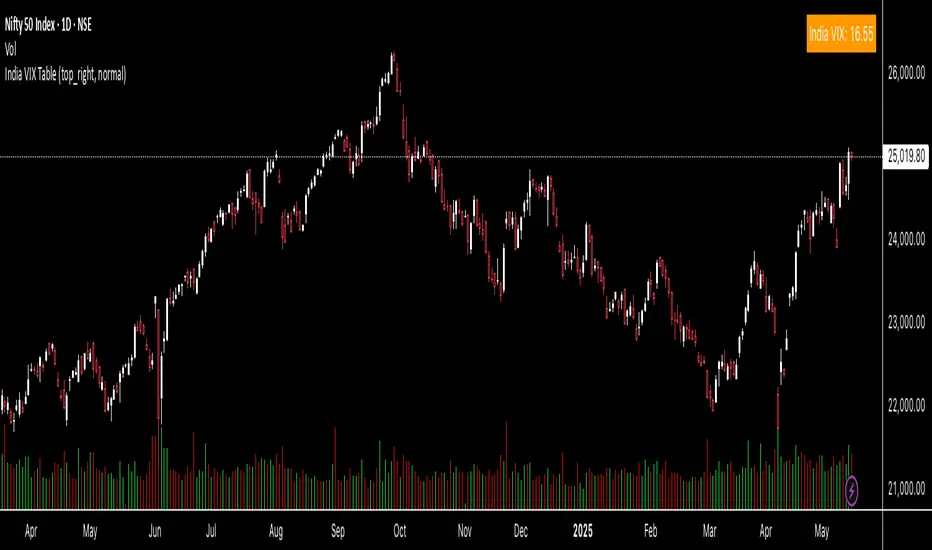
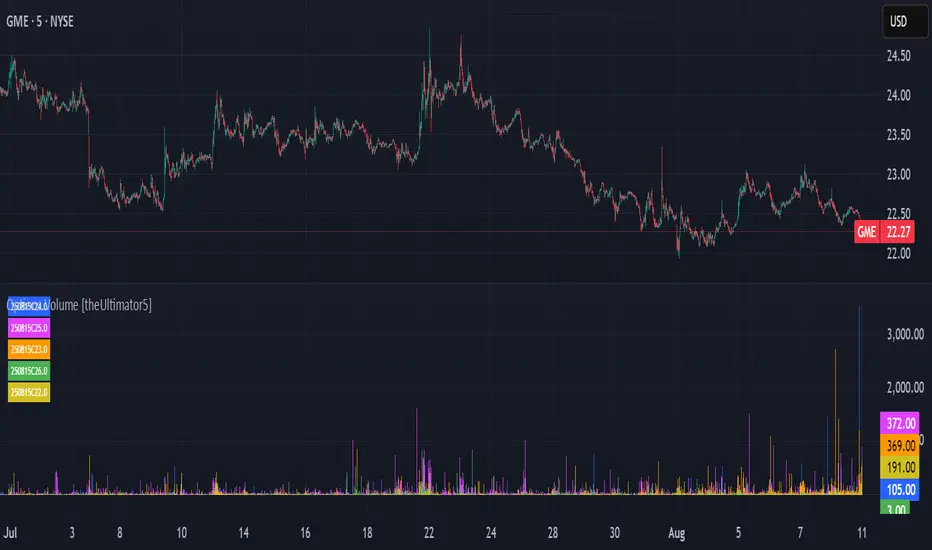
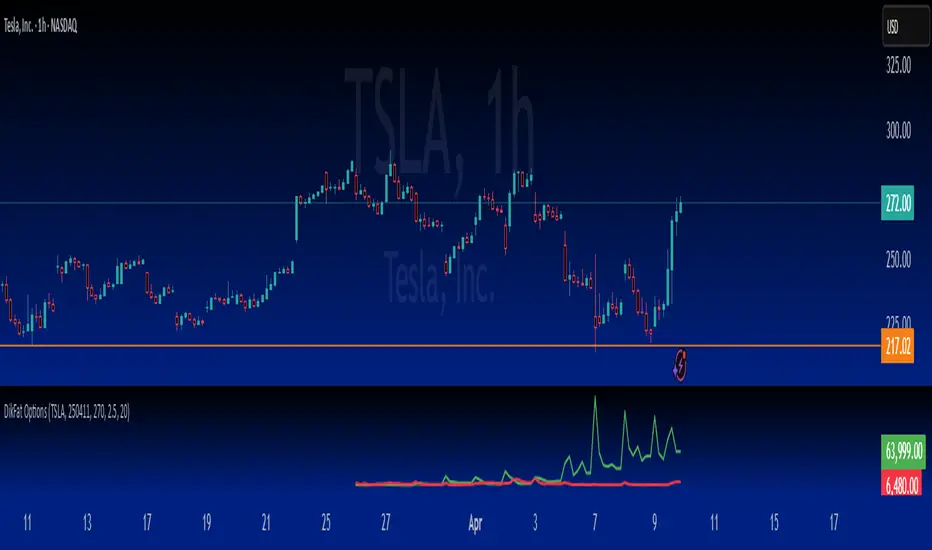
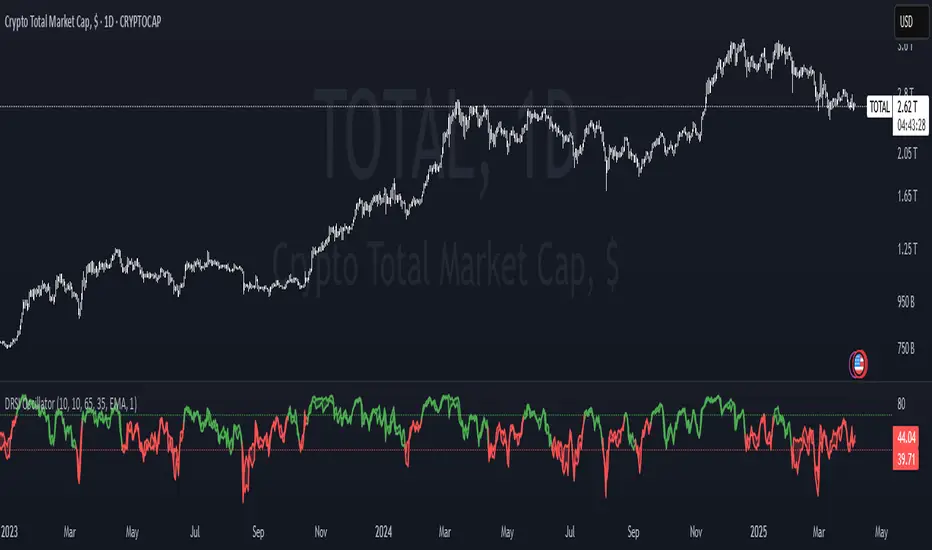
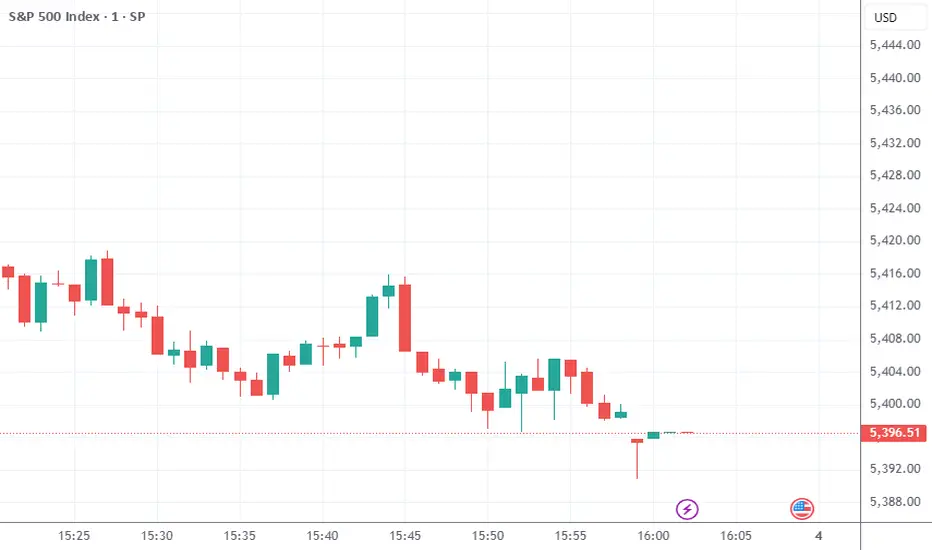
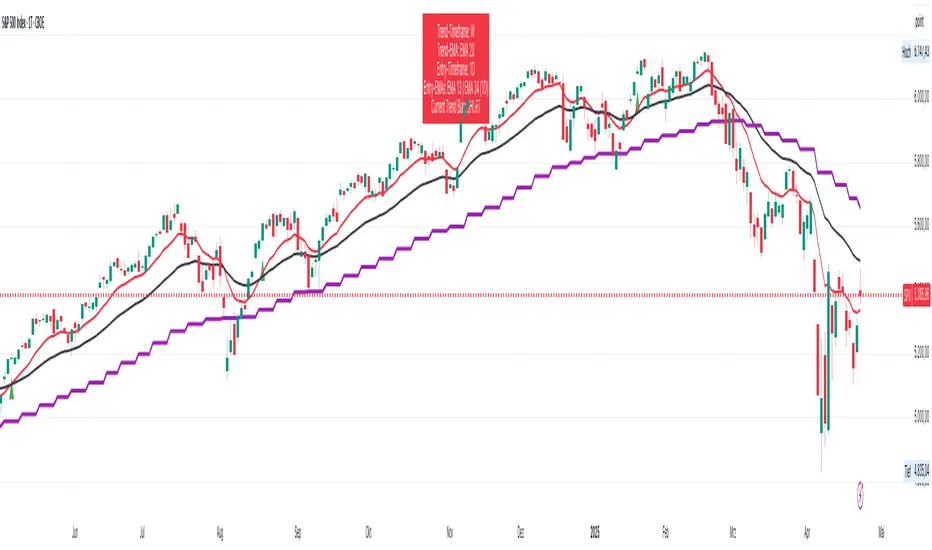
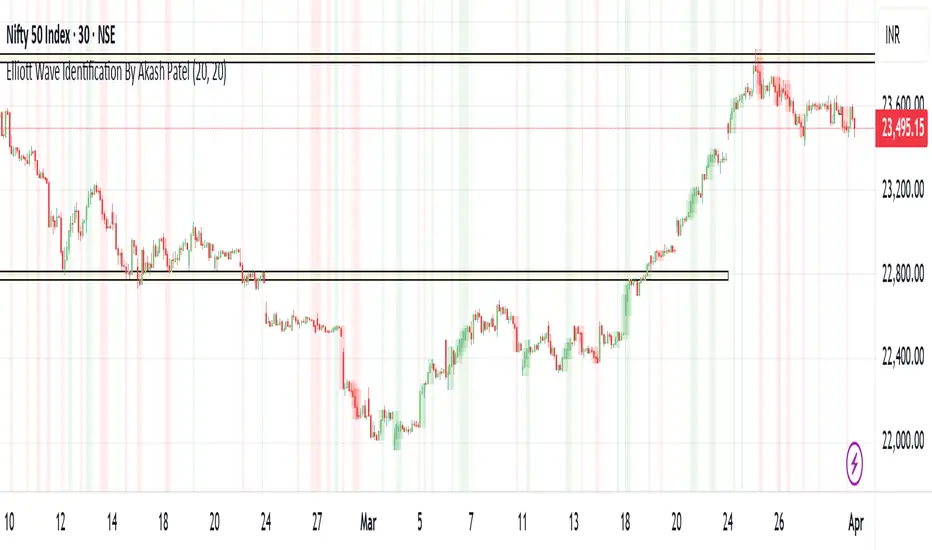
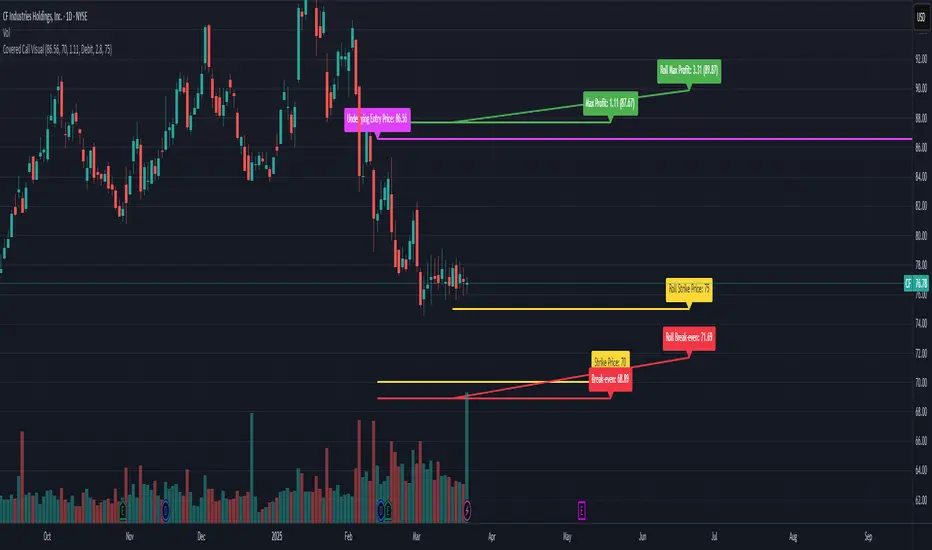
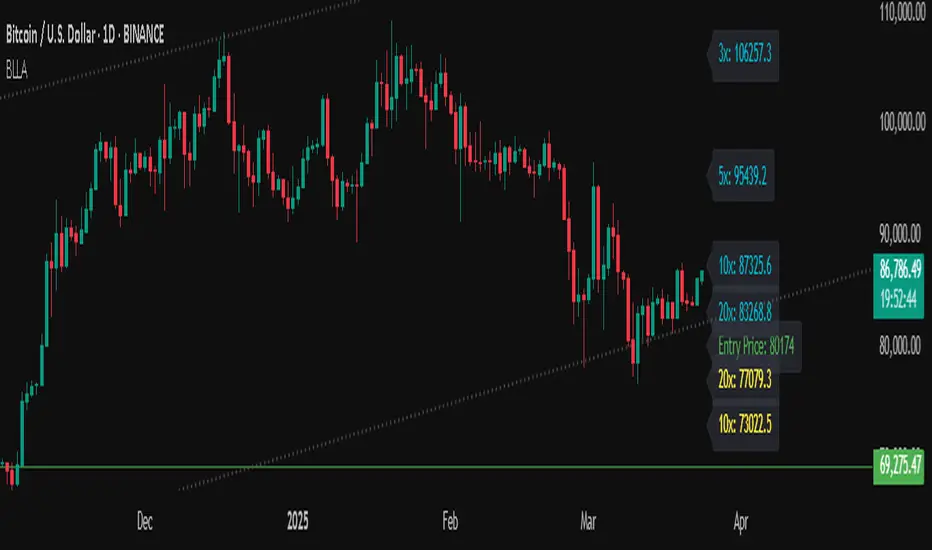
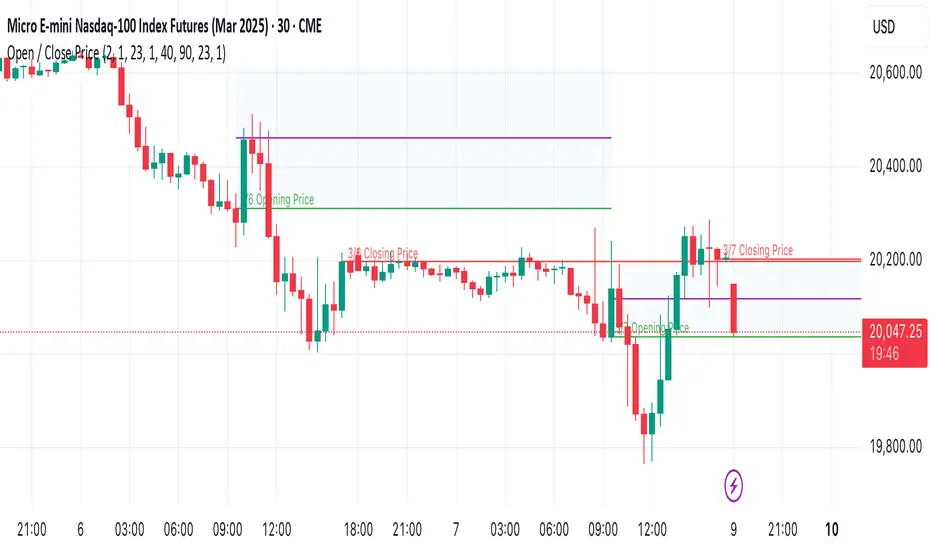
Turn This
Into This
This
Into
Pine Script®指标