MACD ModifiedIn an attempt to improve the MACD for trading, I have added an alternative way to calculate the MACD Line and Overbought/Oversold (OB/OS) lines to filter signals.
The alternate calculation I named "Modified" and put the option to select it under "MACD Calculation" in the input menu. Traditionally the MACD is calculated as fastEMA - slowEMA, for "Modified" I changed the calculation to ((fastEMA - slowEMA) / slowEMA * 100). The goal of this change is to view the difference in MA as a percent of the slow. The hope is that this will compensate for securities that have had major gains or losses in their history.
For the OB/OS lines, I coded in three different ways to calculate them. Users can select which method they prefer in the input menu. The first is through pivot points. The script records the pivot points into an array and takes the average of the array. There are two arrays, one for the OB line and one for the OS line. I also added filters so it will only record pivots above/below a specific value. The crosses on the indicator are for debugging purposes only. They mark the pivots that were recorded into the arrays. The crosses are offset by the pivot strength and do not provide timely indications. All inputs are adjustable for the pivots in the "Pivots" section of the input menu. The second method for the OB/OS lines I added is Bollinger Bands. The user can choose to put it around the Signal or MACD line. The final method added is simply using the previous high/low pivot of the MACD line.
Overbought-oversold

Rsi/W%R/Stoch/Mfi: HTF overlay mini-plotsOverlay mini-plots for various indicators. Shows current timeframe; and option to plot 2x higher timeframes (i.e. 15min and 60min on the 5min chart above).
The idea is to de-clutter chart when you just want real-time snippets for an indicator.
Useful for gauging overbought/oversold, across timeframes, at a glance.
~~Indicators~~
~RSI: Relative strength index
~W%R: Williams percent range
~Stochastic
~MFI: Money flow index
~~Inputs~~
~indicator length (NB default is set to 12, NOT the standard 14)
~choose 2x HTFs, show/hide HTF plots
~choose number of bars to show (current timeframe only; HTF plots show only 6 bars)
~horizontal position: offset (bars); shift plots right or left. Can be negative
~vertical position: top/middle/bottom
~other formatting options (color, line thickness, show/hide labels, 70/30 lines, 80/20 lines)
~~tips~~
~should be relatively easy to add further indicators, so long as they are 0-100 based; by editing lines 9 and 11
~change the vertical compression of the plots by playing around with the numbers (+100, -400, etc) in lines 24 and 25

Williams % Range overlay mini plotPlots Williams Percent Range over bought/oversold indicator as a small overlay in top right corner.
De-clutter chart when all you're interested in is the real-time W%R to 'give permission' to enter a trade.
i.e. to remove the Williams %R lower pane from the above chart completely.
~~User Inputs~~
~W%R length
~Number of bars to show (default is last 6 bars)
~Plot offset (horizontal position of the plot; can be negative)
~Line color and thickness
~Show/hide plot title
~~tips~~
~in line 26, edit the multiplier (3*), to compress/expand the vertical size of the plot

EMCHO Stochastic RangeCustom Stochastic Oscillator with range plot. Can be used to better identify overbought/oversold conditions within a single bar. In addition to the default Stochastic:
%K line smoothing algorithm selection;
%D line smoothing algorithm selection;
%K line high/low plotting;
%K line high/low calculation factor (in bars, default 1).

RSI MTF Ob+OsHello Traders,
This indicator use the same concept as my previous indicator "CCI MTF Ob+Os".
It is a simple "Relative Strength Index" ( RSI ) indicator with multi-timeframe (MTF) overbought and oversold level.
It can detect overbought and oversold level up to 5 timeframes, which help traders spot potential reversal point more easily.
There are options to select 1-5 timeframes to detect overbought and oversold.
Aqua Background is "Oversold" , looking for "Long".
Orange Background is "Overbought" , looking for "Short".
Have fun :)

CCI MTF Ob+OsHello Traders,
This is a simple Commodity Channel Index (CCI) indicator with multi-timeframe (MTF) overbought and oversold level.
It can detect overbought and oversold level up to 5 timeframes, which help traders spot potential reversal point more easily.
There are options to select 1-5 timeframes to detect overbought and oversold.
Green Background is "Oversold" , looking for "Long".
Red Background is "Overbought" , looking for "Short".
Have fun :)

Double Basics - Identify Overbought & Oversold - MultitimeframeI believe that everyone should monitor the basic indicators; EMA/SMA cross, BB and RSI on at least TWO timeframes before making any trading decisions. And because that is only possible on paid subscriptions, I created this indicator for people just getting started.
It allows you to plot all of the mentioned AND 2 weeklies of your choice on 1 chart INCLUDING a higher timeframe, using only 1 indicator.
The EMA's are plotted as ORANGE and the SMA's as BLACK, you can distinguish them by the line size, thin is current chart, thick is higher timeframe.
Same for the Bollinger Bands, Upper lines are red (overbought = sell signal) and bottom lines are green (oversold = buy signal)
The RSI, normally plotted in its own window, are plotted on the scale of the BB of the 2nd timeframe, where the bottom line = 0, upper line = 100 and middle (think black) line = 50. The thin purple line is the RSI of the chart resolution, the thicker purple line is the RSI of the 2nd timeframe.
Finally, the two weeklies are plotted as thick black lines.
Enjoy, and let me know your feedback!

Multi-Timeframe RSI GridThe relative strength index (RSI) is a momentum indicator that measures the magnitude of recent price changes to evaluate overbought or oversold conditions. The RSI is normally displayed as an oscillator separately from price and can have a reading from 0 to 100. This indicator displays the current RSI levels at up to 6 timeframes (of your choosing) in a grid. If the RSI levels reach overbought (above 70) or oversold (below 30) conditions, it changes the color to help you see that RSI has reached extreme levels. Note that in TradingView, when the chart is on a higher timeframe, the lower timeframe RSI levels don't calculate properly. If those conditions are met, this indicator will hide those values in the grid. If none of your selected values are available, it hides the table completely. There are configuration options, like:
Position the grid in any corner of the screen
Style customization (color, size)
Customize RSI length

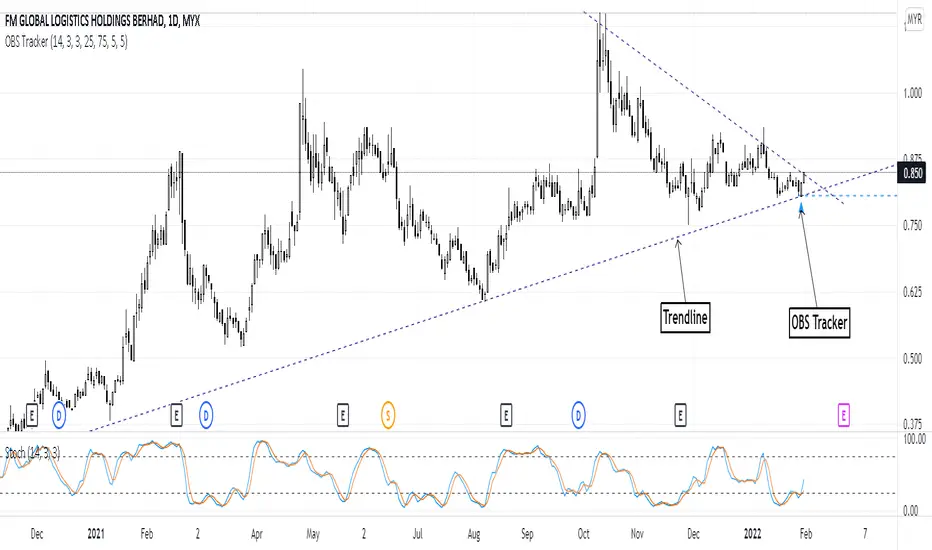
Overbought & Oversold TrackerAbout this indicator:
- This indicator is basically a stochastic indicator that shows to you the crossover in an Overbought or Oversold area DIRECTLY on the chart
How does it works:
- When Stochastic crosses at Oversold area, a Blue Triangle will appear below the candle with a Blue Dotted Line at the low of the current candle
- The Blue Triangle is to help you to see easily the candle where the crossover is occurring
- At the same time, the Blue Dotted Line will act as a minor Support for the current price
- If the current candle breaks the Blue Dotted Line (minor Support), the candle will be displayed in a red color
- Same things will occur if Stochastic crosses at the Overbought area, but at this time, a Red Triangle with Red Dotted Line will appear just to differentiate between Overbought and Oversold crossover
The advantage of using this indicator:
- You can easily see the point of stochastic crossover DIRECTLY on the chart without analyzing the stochastic indicator
- At the same time, it helps you to see clearly either the price is at the bottom / reversal by combining it with S&R / trendlines or other indicators
Personally, I will combine this indicator with:
a. Support and Resistance or Trendlines
b. Fibonacci retracement
c. Candlestick indicator (see my script list)
d. Ultimate MACD (see my script list)
e. Volume indicator
These combinations personally increase the possibility for me to buy exactly at the point of reversal in a pullback
- This indicator is preset at the value of 25 (oversold) and 75 (overbought) k line, it's my own preference. You can change these values at the setting menu to suit your trading style.
- Once again, I am opening the script for anyone to modify/alter it based on you own preference. Have a good day!
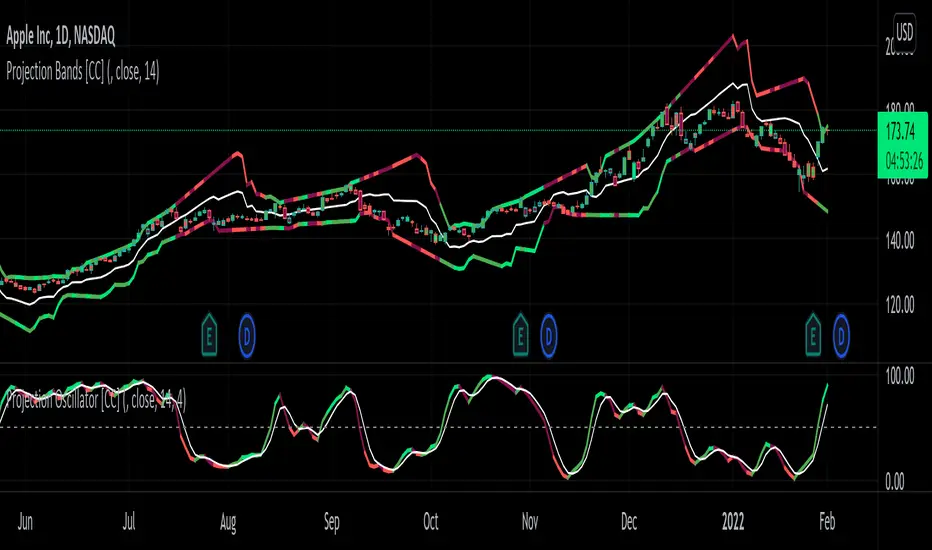
Projection Oscillator [CC]The Projection Oscillator was created by Mel Widner (Stocks and Commodities Jul 1995) and this is another hidden gem that is of course a great complementary indicator to my previous Projection Bands . I would recommend to use both on the same chart so you get the full array of information. This indicator tells you where the current price falls between the bands and the higher the oscillator is, the closer the price is to the upper band and vice versa. Now since the price never falls outside of the bands, the indicator is limited from 0 to 100. You will notice that with this indicator it gives even earlier signals than the Projection Bands so a very useful indicator indeed. I have included strong buy and sell signals in addition to normal ones so strong signals are darker in color and normal signals are lighter in color. Buy when the line turns green and sell when it turns red.
Let me know if there are any other indicators or scripts you would like to see me publish!
Mobility Oscillator [CC]The Mobility Oscillator was created by Mel Widner (Stocks and Commodities Feb 1996) and this is another of my ongoing series of undiscovered gems. I would say this is probably the most complicated script I have written for an indicator. It is extremely complicated to calculate comparing to other indicators but this is essentially an overbought and oversold indicator that uses a very unique technique to calculate overbought and oversold levels and overall upward or downward momentum there is in the underlying stock. It uses a price distribution function to determine how often the current prices fall within the current trend which tells us how strong the momentum for the current trend actually is. I had to customize this indicator a bit to give clear buy and sell readings so I had to introduce a lag in exchange for clearer signals. This indicator ranges between +100 and -100 and when it stays at the +100 level for example then this means a sustained uptrend and vice versa. I have included strong buy and sell signals in addition to normal ones so strong signals are darker in color and normal signals are lighter in color. Buy when the line turns green and sell when it turns red.
Let me know if there are any other scripts or indicators you would like to see me publish!

Relative Strength Exponential Moving Average [CC]The Relative Strength Exponential Moving Average was created by Vitali Apirine (Stocks and Commodities Jan 2022 pgs 22-25) and this is a handy moving average that combines a typical overbought/oversold mechanic with an overall trend indicator. Even though the typical length is so large it reacts extremely quickly when the stock becomes overbought or oversold. Because of this the indicator by itself doesn't work as well during choppy periods so Vitali recommends using a moving average crossover system during choppy so do one indicator with the default length of 50 and use a different length of 10 so when the shorter length crosses over the longer length then buy and vice versa you would sell. Generally speaking buy when the line turns green and sell when it turns red. I have used strong buy and sell signals in addition to normal signals so strong signals are darker in color and normal signals are lighter in color.
Let me know if there are any other scripts or indicators you would like me to publish!

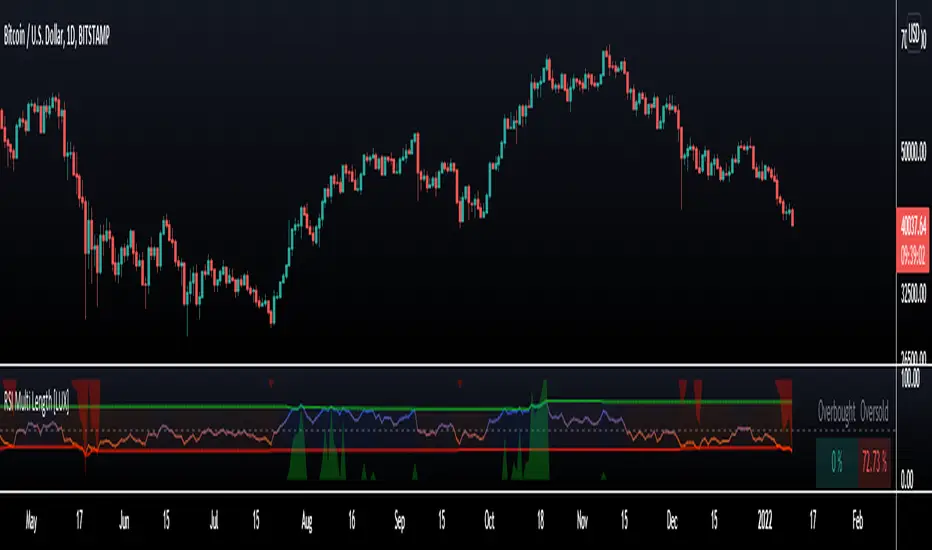
RSI Multi Length [LuxAlgo]The following indicator aims to return information over RSIs using multiple periods, including the percentage of RSIs of different periods being overbought/oversold, as well as the average between these multiple RSIs.
The percentage of RSIs of different periods being overbought/oversold is additionally used to return adaptive overbought/oversold levels.
Settings
Maximum Length: Maximum period of the RSI used for the indicator calculation
Minimum Length: Minimum period value of the RSI used for the indicator calculation
Overbought: Value of the overbought level
Oversold: Value of the oversold level
Src: Input source of the indicator
Usage
The main element of the indicator is given by the multi-length RSI average, returning an oscillator similar to a fixed-length RSI. Because of its multiple length nature, the indicator can reflect shorter to longer-term price variations depending on the Maximum/Minimum length range defined by the user.
The green area indicates the percentage of RSIs over the user-defined overbought level. The red area indicates the percentage of RSIs under the user-defined oversold level, this percentage is inverted for ease of visualization. Additionally, a dashboard at the top right of the indicator pane indicates these percentages for the most recent bar.
A lower percentage of overbought/oversold RSIs can indicate a potential shorter-term retracement.
These percentages are used to construct adaptive overbought/oversold levels for the average multi-length RSI. The overbought level will be easier to reach if the percentage of overbought RSI's is high, the same logic applies to the adaptive oversold level.
Cyclic RSI High Low With Noise Filter█ OVERVIEW
This indicator displays Cyclic Relative Strength Index based on Decoding the Hidden Market Rhythm, Part 1 written by Lars von Thienen.
To determine true or false for Overbought / Oversold are unnecessary, therefore these should be either strong or weak.
Noise for weak Overbought / Oversold can be filtered, especially for smaller timeframe.
█ FEATURES
Display calculated Cyclic Relative Strength Index.
Zigzag high low based on Cyclic Relative Strength Index.
Able to filter noise for high low.
█ LEGENDS
◍ Weak Overbought / Oversold
OB ▼ = Strong Overbought
OS ▲ = Strong Oversold
█ USAGE / TIPS
Recommend to be used for Harmonic Patterns such as XABCD and ABCD.
Condition 1 (XABCD) : When ▼ and ▲ exist side by side, usually this outline XA, while the next two ◍ can be BC.
Condition 2 (ABCD) : When ▼ and ▲ exist side by side, usually this outline AB, while the next one ◍ can be BC, strong ABCD.
Condition 3 (ABCD) : When ▼ or ▲ exist at Point A, the next two ◍ can be Point B and Point C, medium ABCD.
Condition 4 (ABCD) : When ◍ exist at Point a, the next two ◍ can be Point b and Point c, weak ABCD usually used as lower case as abcd.
█ CREDITS
LoneSomeTheBlue
WhenToTrade

34 EMA Bands [v2]Updating an older concept here with some more oversold/overbought zones.
Pretty self explanatory, red zone indicate overbought zones and green zone is a oversold. Often, price likes to bounce off of the lower bounds of these zones, but it can sometimes extend all the way through the zone onto the upper boundary.
There are many lines to this indicator, i prefer using it with all the lines off except the outermost ones. However, you can edit it if it suits you better.
Source code is open, so any suggestions to improve its accuracy are welcome :)

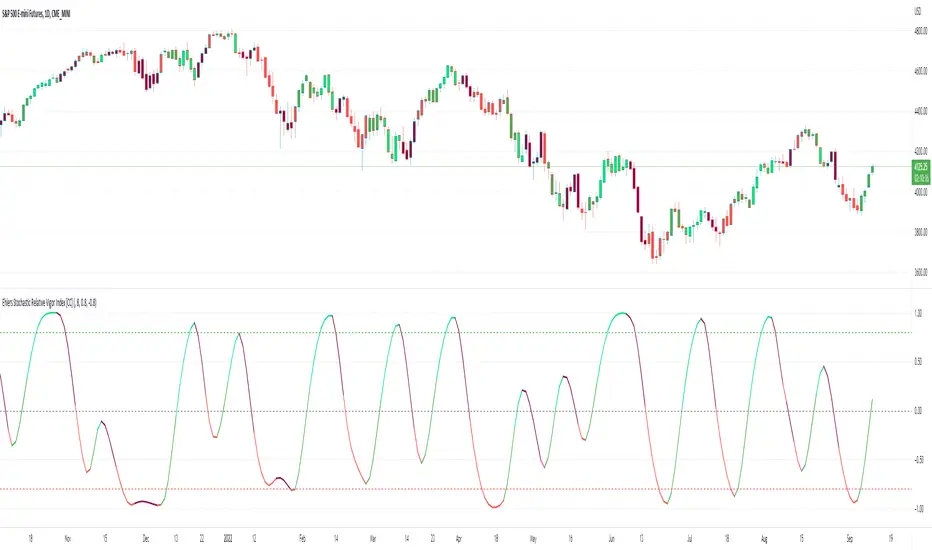
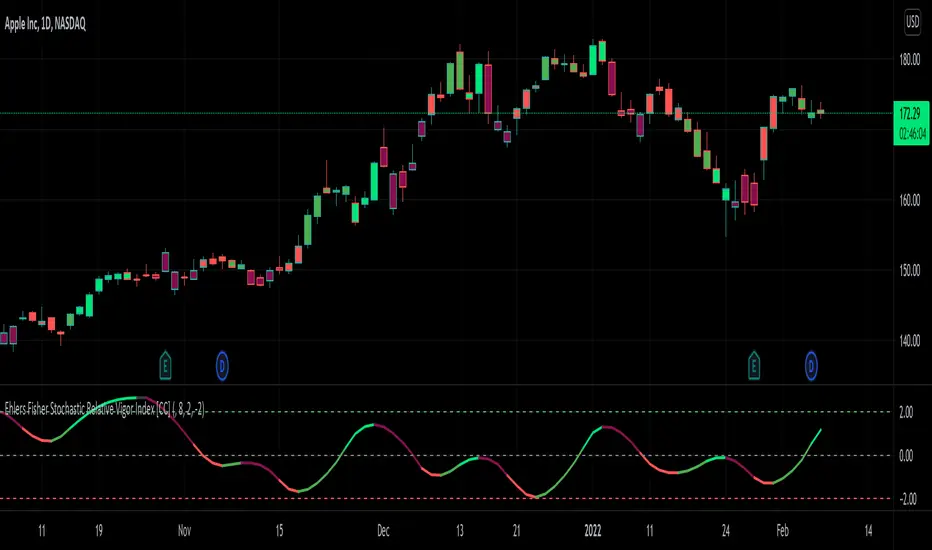
Ehlers Stochastic Relative Vigor Index [CC]The Stochastic Relative Vigor Index was created by John Ehlers (Cybernetic Analysis For Stocks And Futures pgs 84-89) and this of course is very similar to the Ehlers Fisher Stochastic Relative Vigor Index I just published. In hindsight I probably should have published this one first but just like with the other script this is a stochastic version of a Relative Vigor Index and I added some smoothing to make buy and sell signals clearer. There are several ways to identify buy and sell signals but generally in the long term it is a buy signal when the indicator is below the oversold line and is moving up and in the short term when the indicator is above it's trigger line which is what I coded the buy and sell signals to follow. Buy when the line is green and sell when it turns red.
Let me know if there are any other scripts you would like to see me publish!
Ehlers Fisher Stochastic Relative Vigor Index [CC]The Fisher Stochastic Relative Vigor Index was created by John Ehlers (Cybernetic Analysis For Stocks And Futures pgs 101-104) and this is a many layered indicator created from his original Relative Vigor Index turned into a stochastic and then performing a Fisher transform on the results. I have included extra smoothing to provide clearer buy and sell signals as well as normal and strong buy and sell signals. As always strong signals are darker in color and normal signals are lighter in color. Buy when the line turns green and sell when it turns red.
Let me know if there are any other scripts you would like to see me publish!
RSI Trend LineI took a concept similar to the "Adaptive RSI" to get the RSI overlaid on a price chart. The problem I have with the Adaptive RSI is to me it sticks too closely to price. I wanted something much more visually helpful that can provide actual tradable signals and strategies.
The orange line you are seeing is the "RSI Trend Line"
The further the RSI moves away from a value of 50 (the "zero line"), the more you see this orange line move away from price. This helps visualize the strength of price pushing away from a neutral value to a position of strength or weakness-- if orange is below price then relative strength is high; if orange is above price then relative strength is low. When price is equal to the orange RSI line, the RSI is at a value of 50.
In addition to the trend line, you can enable bands which reflect Overbought and Oversold levels . If you leave the responsiveness to a value of 1.0 and removed any smoothing, these should pretty accurately reflect an actual RSI chart topping the OB and OS lines (default 70 and 30, respectively). (They're still very close with different responsiveness and smoothing values)
The conversion or scaling of RSI value onto price comes with a bit of a quirk which I decided to leave to the user to determine how they want it applied. So the setting "Responsiveness" will impact the sort of aggressiveness of the RSI trend line as well as the the size of the bands. You could think of this in some ways as the OPPOSITE of the multiple setting on a Bollinger or Keltner band-- 1.0 will make for the widest band, 2.0 is the default and my preference, and you can move it up to a value of 5.0.
Here are some examples of how you could use the indicator for trade signals--
And here's my thought on the current state (as of 10/06) on indices with regards to this indicator-

McClellan Oscillator Jack Corsellis [LazyBear Modified]Developed by Sherman and Marian McClellan, the McClellan Oscillator is a breadth indicator derived from Net Advances, the number of advancing issues less the number of declining issues.
Subtracting the 39-day exponential moving average of Net Advances from the 19-day exponential moving average of Net Advances forms the oscillator.
As the formula reveals, the McClellan Oscillator is a momentum indicator that works similar to MACD .
McClellan Oscillator signals can be generated with breadth thrusts, centerline crossovers, overall levels and divergences.
The original code was written by LazyBear ( code here: )
We have modified this code:
1. Added the ability to display and configure the overbought and undersold lines which are key to properly using this indicator. These are set to default +40 and -75 respectively.
2. This version uses USI:ADV(advances- issues) and USI:DECL (declines - issues) as the default.
Multiband Oscillator - Zigzag versionJust variation of Multi Band oscillator present here: Multi-Band-Channel-Oversold-Overbought-Oscillator
Changes are:
Instead of regular moving average, here I am using Zigzag Moving average. This is calculated in similar to as explained in: Zigzag-Cloud
Instead of ATR, using AZR (Average Zigzag Range) - Average-Zigzag-Range-AZR
Rest of the logic remains same.
Number of bands used 100 - which means, calculate 100 Bollinger bands with Std Dev Multiplier starting from 0.1 and with step 0.1 for the next one.
Which divides price ranges into 200 equal parts. Calculate what is the current range and plot them.
Overbought - Oversold levels are dynamics. They are dependent on the max and min state price has reached in last 80 days. Offset and factor can be used to adjust overbought oversold levels.

Relative Strength Index 2x maThe relative strength index, represented as two moving averages with periods, one of which will be a multiple of the longer moving average by the amount you set.
The indicator can work both in automatic and manual mode. In automatic mode, the optimal periods are selected, in my opinion, depending on which timeframe is being analyzed at the current moment. In manual mode, you can set the required period yourself.
You can also set the method of smoothing the moving averages yourself and apply them to the opening or closing, the minimum of the bar, etc.
An important point: it is possible to enable/disable graphical functions that may not be required - just check the box next to the function that you want to see on your indicator.
Show ConDiv? - enabling / disabling the convergence/divergence function of the moving averages of the RSI indicator (not to be confused with the MACD for the asset price chart)
Show ma? - enabling/disabling the graphical display of the moving averages of the RSI indicator
Show RSI? - enabling / disabling the standard RSI indicator (if you want to see only it, check the box opposite; in this case, you need to remove the other two checkboxes)
I wish you good luck in building your trading plans, and remember: such indicators do not predict the future price movement on the chart, they only determine the characteristics of the price movement at the current time, taking into account historical data.

RSI+ChannelbandsThis Indicator displays a normal RSI with overbought/-sold lines which is calculated with donchian channels, pivot channel, bollinger bands and three horizontal lines.
You can averaged the channels, bands and h-lines in any combination or you can use just one of them for calculating the overbought/-sold lines.
The midline is colored in default settings in yellow for upptrending and blue for downtrending.

Folded Relative Strength Index [CC]The Folded Relative Strength Index was created by Richard Poster (Stocks and Commodities July 2021 pg 21) and this indicator provides both trend strength but also momentum and of course reversal points using the overbought and oversold markers. If the indicator line is above the mid line then this shows upward momentum and when it falls below the midline then this means it is losing momentum. When the indicator rises above the signal line then this shows upward trend strength and vice versa. Buy when the indicator line turns green and sell when it turns red.
Let me know if there are any other indicators you would like to see me publish!
