FTL Context Teaser - PublicFTL Context (Teaser) – Public
FTL Context (Teaser) is a visual market context layer designed to highlight periods of increased market risk and structural tension.
This script does NOT provide trading signals and is NOT intended for standalone trading decisions.
It serves as a contextual overlay only, helping traders visually identify when market conditions shift away from equilibrium.
The teaser version is intentionally limited and does not expose the underlying logic or decision framework.
Full functionality, advanced filters, and integrated decision logic are available in the invite-only FTL Context Layer (PRO).
📩 Contact / PRO access:
fairtradinglab@gmail.com
Educational & informational use only.
价量趋势 (PVT)

FTL Context - Public TeaserFTL Context (Teaser) – Public
FTL Context (Teaser) is a visual market context layer designed to highlight periods of increased market risk and structural tension.
This script does NOT provide trading signals and is NOT intended for standalone trading decisions.
It serves as a contextual overlay only, helping traders visually identify when market conditions shift away from equilibrium.
The teaser version is intentionally limited and does not expose the underlying logic or decision framework.
Full functionality, advanced filters, and integrated decision logic are available in the invite-only FTL Context Layer (PRO).
Educational & informational use only.

FestX VSTFestX NY Session Volume Framework is a session-based momentum and liquidity indicator designed specifically for the New York market open.
The script focuses on time-based market behaviour, filtering signals to only occur at precise session transitions where institutional volume is statistically higher.
Core Concepts Used:
• Session Transition Logic
Signals are only evaluated when the New York trading session opens, eliminating noise from low-liquidity periods.
• Relative Volume Expansion
Instead of raw volume, the script compares current volume against a rolling average to detect abnormal participation at the session open.
• Directional Candle Validation
Entry bias is derived from the relationship between candle open and close at the session trigger, aligning trades with immediate momentum.
• Optional Session Range Context
The tool can be used alongside Asian session highs and lows to identify continuation or reversal behaviour after range compression.
What Makes This Script Different:
This indicator does not attempt to predict direction throughout the day.
It deliberately restricts signals to one specific institutional window, using volume expansion + price acceptance to confirm direction.
This design reduces overtrading and focuses traders on high-quality, time-based opportunities rather than constant signals.
Intended Use:
• NY session open traders
• Index and futures traders
• Traders seeking confirmation at session transitions
This script is not a traditional trend indicator or oscillator and is best used as a contextual decision tool, not a standalone signal generator.

Trade volume indicator @mybullandbearThe indicator consolidates Trend (MA), Momentum (RSI), Breakout (ORB), and Volume (CVD) into a single dashboard, giving you an objective "Green" or "Red" bias.
Mybullandbear View (CVD): This specific component tracks whether buying or selling volume is dominant for the day. It helps you avoid false breakouts—if price goes up but CVD is Red (Bearish), it's likely a trap.
How to Benefit: Wait for Confluence. Do not take a trade unless the Dashboard shows a clear consensus (e.g., Green Trend + Bullish CVD + Price above ORB High). This filters out low-quality trades and keeps you on the right side of the market.

AI ALGO SETUP by A+AI ALGO SETUP by A+.
This Setup helps the Intraday Trader have an Edge in the Market

B/S SHIVAJI (v5) ONLY FOR PAPER TRADE
// इस Buy/Sell इंडिकेटर के उपयोगकर्ताओं के लिए एक दोस्ताना संदेश
var bool shownMessage = false
if not shownMessage
label.new(bar_index, high,
text="स्वागत है! इस Buy/Sell इंडिकेटर का उपयोग करने के लिए धन्यवाद। हमें उम्मीद है कि यह आपके ट्रेडिंग सफ़र में आपकी मदद करेगा। नई सलाहों और अपडेट्स के लिए वापस आते रहें!",
style=label.style_none, color=color.blue, textcolor=color.white, size=size.normal)
shownMessage := true

mrD-Volume Profile HeatmapThis indicator combines advanced volume analysis with institutional-grade visualization techniques to provide traders with a comprehensive view of market structure and liquidity zones.
WHAT MAKES THIS UNIQUE:
• Proprietary bidirectional volume profiling algorithm that separates buying and selling pressure using VWAP deviation analysis, not standard volume bars
• Custom heatmap visualization engine with adaptive gradient calculation based on volume-weighted price distribution across multiple timeframes
• Integrated Weekly VWAP with hlc3 weighting for institutional reference levels
• Dynamic POC (Point of Control) detection with fixed-height text boxes for clarity
• Optimized rendering system that handles 500+ bars efficiently without lag
HOW IT WORKS:
The algorithm analyzes volume distribution at each price level within the lookback period, applying a proprietary weighting system that considers:
1. Volume-weighted average price (VWAP) deviation to classify volume as bullish/bearish
2. Price levels are binned into customizable rows (bins) for granular analysis
3. Volume bars extend bidirectionally: positive volume (green) extends left, negative volume (red) extends right
4. Heatmap overlay uses multi-level gradient mapping (6-color spectrum) to highlight high volume nodes
5. Weekly VWAP provides macro trend reference with session-based reset logic
VOLUME PROFILE MECHANICS:
• Calculates volume distribution across price levels using a grid-based binning system
• Each bin accumulates volume when the price touches that level
• Positive/negative classification based on VWAP position (above = bullish, below = bearish)
• POC automatically identifies the price level with maximum volume concentration
• Display shows volume intensity through color gradients and bar lengths
HEATMAP VISUALIZATION:
• Uses exponential gradient multiplier (default 1.9) for enhanced contrast
• Color transitions: Dark Blue (low volume) → Cyan → Green → Yellow (high volume)
• Transparency-adjusted overlays ensure chart readability
• Real-time updates as new volume data arrives
WEEKLY VWAP INTEGRATION:
• Resets at the start of each trading week (request.security logic)
• Uses hlc3 (typical price) as the volume-weighted source
• Provides institutional reference level for swing traders
• Yellow color (#FFEB3B) for easy identification
KEY PARAMETERS:
• Period: Lookback window for volume calculations (default: 500 bars)
• Bins: Number of price levels for volume distribution (default: 150 rows)
• Offset: Horizontal positioning of volume bars (default: 50)
• Heatmap Rows: Granularity of heatmap overlay (default: 250)
• POC displays actual volume numbers for transparency
TRADING APPLICATIONS:
→ Identify high-volume nodes as support/resistance zones
→ Detect liquidity clusters where institutional orders concentrate
→ Spot low-volume areas where price may move quickly (thin zones)
→ Use bidirectional volume to assess buying vs selling pressure
→ Combine with Weekly VWAP for multi-timeframe confluence
→ POC levels often act as price magnets (mean reversion targets)
TECHNICAL IMPLEMENTATION NOTES:
• Optimized for intraday to swing timeframes (1m to Daily charts)
• Volume calculations use session-based accumulation (no future data)
• Box rendering is limited to 500 objects for performance
• Gradient calculations use mathematical power functions for smooth transitions
• VWAP calculation follows institutional standard (volume-weighted hlc3)
RESTRICTIONS:
This is a proprietary algorithm. Redistribution, modification, or commercial use is strictly prohibited. The logic and methods contained herein are confidential and protected intellectual property.
═══════════════════════════════════════════
DISCLAIMER & RISK WARNING
This indicator is provided solely for educational and informational purposes. It is designed to help traders understand market structure, volume distribution, and price action analysis. This tool should be used as part of a comprehensive trading education program.
NOT FINANCIAL ADVICE:
The information and signals provided by this indicator DO NOT constitute financial advice, investment advice, trading advice, or any other sort of advice. You should not treat any of the indicators' content, outputs, or signals as such. Nothing contained in this indicator constitutes a solicitation, recommendation, endorsement, or offer to buy or sell any securities or other financial instruments in this or in any other jurisdiction.
NO GUARANTEED RESULTS:
Past performance is NOT indicative of future results. The historical backtesting results, volume patterns, and statistical data shown by this indicator do not guarantee future performance or success. Market conditions change constantly, and what worked in the past may not work in the future. Trading and investing involve substantial risk of loss.
MARKET VOLATILITY:
Financial markets are inherently volatile and unpredictable. Volume patterns, support/resistance levels, and other technical indicators can fail at any time. No indicator can predict market movements with certainty. Always use proper risk management and position sizing.
By using this indicator, you acknowledge that you have read, understood, and agree to this disclaimer in its entirety. If you do not agree with any part of this disclaimer, you should not use this indicator.

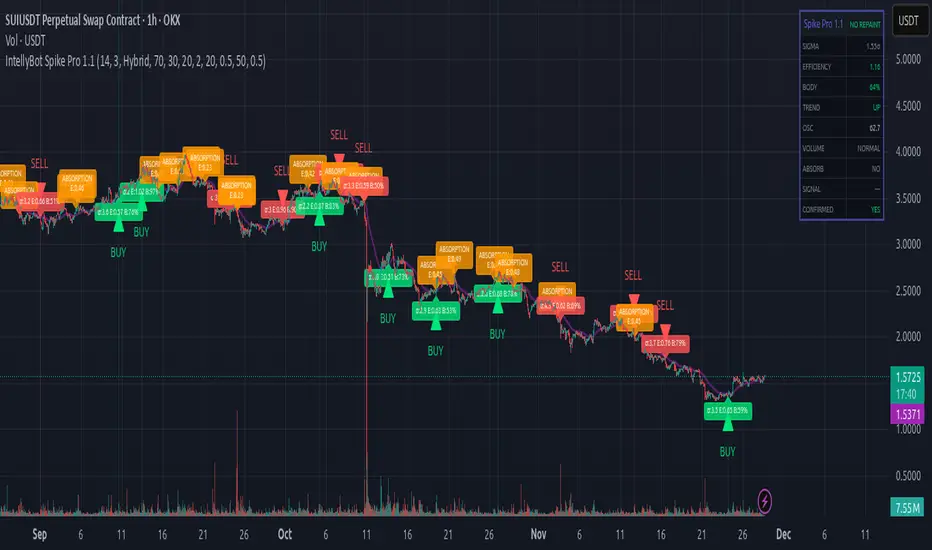
IntellyBot Spike ProIntellyBot Spike Pro
IntellyBot Spike Pro helps you quickly spot unusual market activity and highlights only the signals that truly matter. It cuts out the noise and marks candles where something “big” is happening – whether it's strong buying, strong selling, or a possible trend reversal.
What the script does for you
Detects real volume spikes:
It identifies moments when trading activity suddenly increases, often caused by large market orders or the start of a new move.
Generates clean Buy and Sell signals:
A signal is only shown when multiple conditions line up (trend direction, candle strength, momentum, etc.). This reduces false alerts and keeps things simple.
Spots absorption (hidden strength or weakness):
The script highlights candles where volume is high but price barely moves.
This can be a sign that big players are absorbing orders before a potential reversal.
No repainting:
All signals are based on confirmed candles and will not change later.
Includes a visual dashboard:
A small on-chart panel shows key information at a glance, such as trend, volume strength, efficiency, oscillator reading, and active signals.
Perfect for traders who want to…
use volume as an early indicator
catch real breakouts and avoid fake moves
identify trend shifts sooner
get clean, visual signals without combining many tools
Trade By Design – Free Edition (v0.1)A clean, high-performance session & liquidity framework designed to bring structure, clarity, and precision to your intraday trading.
This indicator is inspired by the Trade Travel Chill – Trade By Design methodology and provides a free, simplified version of the core concepts—ideal for day traders seeking to understand market structure, session behavior, and intraday liquidity dynamics.
🔍 What This Indicator Does
The Free Edition automatically maps the most important intraday levels and contextual factors that drive daily price delivery.
Key Features:
• HOW / LOW
• IHOD / ILOD / 50% Asia
• HOD / LOD
• PVSRA Candles
• Vector candles
• Perp autooverride
⚠️ Version Notice (v0.1 – Early Release)
This is an early, not all features are active yet.
This version focuses purely on the core structure, keeping everything lightweight and easy to use.
⚠️ Disclaimer
This is an unofficial free re-creation inspired by public concepts taught in the Trade By Design methodology.
It is not endorsed, affiliated with, or sponsored by TradeTravelChill.club or its owners.
If you enjoy this indicator and want the complete methodology, mentorship, and full system, please support the original creators by purchasing the official course at:
👉 tradetravelchill.club

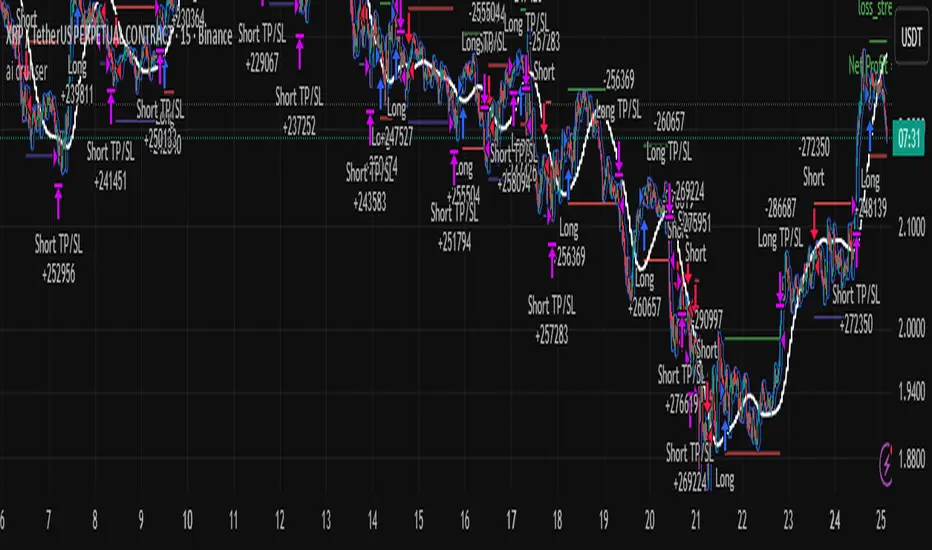
ai cruhsera pullback strategy to donchain lower and upperbands.. best for cypro lower timeframe scalping..
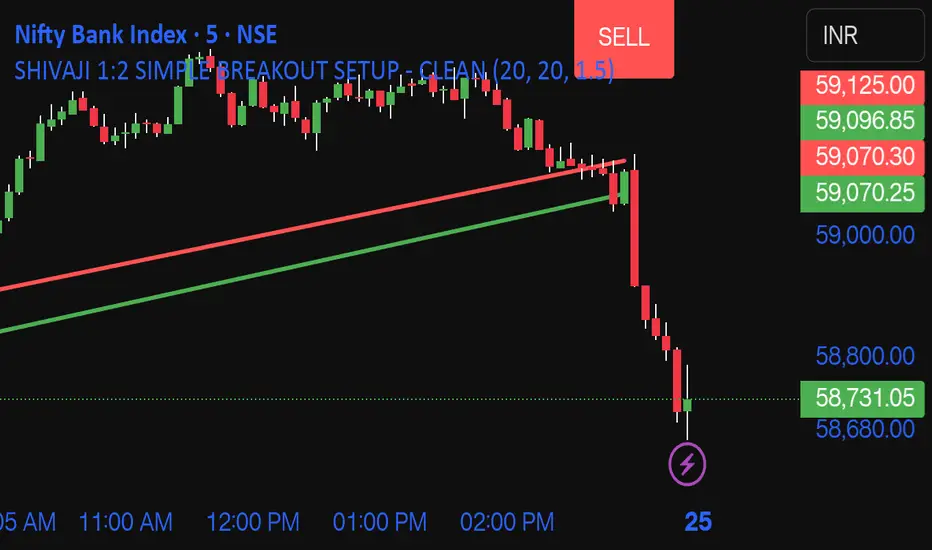
SHIVAJI 1:2 SIMPLE BREAKOUT SETUP - CLEANManage risk reward and use this indicator
Breakout structure auto correct
Volume consider in break out
Volume Pulse [ziksfx]Volume Pulse is a clean volume indicator designed to make it easier to read meaningful changes in activity without cluttering your chart. It enhances the standard volume view by supporting both classic volume and dollar volume , highlighting spikes and extreme bars and adding a compact label on the latest bar so you always see the current volume value at a glance. The script is intended to be used in a separate volume pane.
How it works
– Supports two modes: standard volume or dollar volume (close × volume).
– Colors volume bars by candle direction (up/down). Optionally, it can:
• highlight volume spikes above a moving average;
• mark the highest-volume bar over a user-defined lookback period.
– Plots a simple moving average of volume so you can quickly see when activity is above or below typical levels.
– On the latest bar, shows a small label with the current volume value, automatically abbreviated (K / M / B) and optionally prefixed with “$” in dollar-volume mode.
Inputs & customization
– Volume type: choose between standard volume and dollar volume.
– Volume MA length: controls how sensitive the moving average is to recent changes in activity.
– Spike highlighting: optional, turns on/off coloring for bars where volume exceeds the moving average.
– Highest-volume bar lookback: sets the period for detecting the highest-volume bar.
– Label position: choose whether the last-bar label appears on the left or right side of the bar, and optionally shift it slightly above the bar for better readability.
Use cases
Use Volume Pulse to:
– Spot sudden spikes in volume and compare them to the recent average.
– Identify sessions or candles with unusually high activity relative to a chosen TF.
– Visually study how volume behaves around price moves, breakouts or potential fakeouts to better understand their strength or weakness.
– Keep track of the latest bar’s volume instantly, without having to read the raw scale values.
This indicator works on any symbol that has volume data (stocks, futures, crypto and more), but volume quality may vary between markets and instruments. It is intended as an analytical and educational tool only: it does not constitute financial advice and does not provide or guarantee any trading results. Always combine volume context with your own analysis and risk management.

Yest/PreMkt H/LI published this Tradingview script to allow you to see pre-market and previous day highs/lows for directional trading. This works with stocks, ETFs and indexes. To see pre-market highs/lows, you MUST enable "extended" session in the TV charts. You can change colors to your liking. Enjoy!

Liquidity Absorption OscillatorDescription:
The Liquidity Absorption Oscillator (LAO) is a sophisticated momentum indicator that measures how efficiently price moves relative to trading range while confirming momentum with volume-based liquidity flows. By combining price efficiency analysis with volume velocity, the LAO provides earlier and more reliable signals than traditional price-only oscillators, helping traders identify high-probability trend initiations and reversals.
🔍 Core Technology & Innovation:
Tri-Component Signal Processing:
Price Efficiency Ratio (PER): Measures how "cleanly" price moves by comparing net displacement to total trading range over the lookback period. High PER indicates trending markets with directional conviction.
Volume Velocity Ratio (VVR): Combines price momentum with volume confirmation, normalized by ATR to ensure consistent behavior across different instruments and volatility regimes.
Adaptive Smoothing: Dynamically adjusts responsiveness based on market conditions - becoming more stable during noisy periods and more responsive in clean trends.
Multi-Layer Signal Detection:
Confirmed Crossovers: Traditional zero-line crosses filtered by efficiency thresholds
Early Momentum Signals: Detects momentum shifts BEFORE zero-line crosses for optimal entry timing
Smart Divergence Detection: Identifies hidden bullish/bearish divergences with built-in quality filters
🎯 Trading Signals & Interpretation:
🟢 BULLISH SIGNALS:
Strong Buy: LAO crosses above zero line with medium/high efficiency (PER)
Early Buy: Momentum accelerates while LAO is still negative (anticipates reversal)
Divergence Buy: Price makes lower low while LAO forms higher low
🔴 BEARISH SIGNALS:
Strong Sell: LAO crosses below zero line with medium/high efficiency
Early Sell: Momentum decelerates while LAO is still positive (anticipates top)
Divergence Sell: Price makes higher high while LAO forms lower high
⚪ SIGNAL QUALITY FILTERING:
Automatic signal suppression during low-efficiency (choppy) market conditions
Configurable PER threshold ensures only high-quality signals are considered
📊 Visual Features:
Clean Oscillator Display: Smooth line plot with gradient fills above/below zero line
Multiple Coloring Options: Choose between no coloring, trend-based, or slope-based bar coloring
Professional Styling: Inspired by institutional-grade indicator design with subtle visual cues
Non-Repainting Logic: All signals confirmed on bar close for reliable backtesting
⚙️ Input Parameters:
Core Settings:
Lookback Period: Base period for efficiency and velocity calculations (default: 24)
Base Smooth Period: Starting point for adaptive smoothing (default: 8)
Min Efficiency for Signals: PER threshold for signal validation (default: 35)
Divergence Lookback: Bars to search for divergence patterns (default: 5)
UI Options:
Bar Coloring: Choose visual style (None, Trend, Slope)
🔔 Alert Conditions:
Buy/Sell Signal: Traditional zero-line crosses with quality filtering
Early Buy/Early Sell: Momentum-based signals before traditional crosses
All alerts use confirmed, non-repainting logic

Price-Volume Correlation Strength (PVC)Overview
The Price-Volume Correlation Strength (PVC) indicator is a behavioral-analysis tool that quantifies the relationship between price movement and volume participation to distinguish t rue directional moves from false momentum or exhaustion traps .
It combines dynamic price–volume correlation logic, signal clustering, liquidity-sweep detection, and multi-day reference levels into a single, data-driven framework that adapts across all markets and timeframes.
⸻
1️⃣ Core Logic — Price vs Volume Correlation
At the heart of PVC is the belief that price without volume confirmation is deception .
The script evaluates whether volume supports or contradicts price direction using a rolling volume average and short-term price delta:
Price Direction Volume Behavior
↑ Price + ↑ Volume True Bull Move ✅ — Healthy rally with strong participation
↑ Price + ↓ Volume False Bull Move ⚠️ — Buyer exhaustion or fake breakout
↓ Price + ↑ Volume True Bear Move ✅ — Active selling pressure
↓ Price + ↓ Volume False Bear Move ⚠️ — Short covering / weak decline
Candles are automatically color-coded so that traders can instantly identify whether the current move is being supported (lime/red) or rejected (gray) by the underlying volume dynamics.
2️⃣ Signal Module — Trend Confirmation & Reversal
PVC tracks sequences of consecutive “true” bars to generate BUY or SELL signals once momentum aligns with sustained volume confirmation.
A built-in signal-strength filter (user-adjustable) ensures that only moves with multi-bar confirmation are considered.
Signals are non-repainting: once triggered, they persist until an opposite direction is confirmed.
3️⃣ Liquidity Sweep Engine
Markets often manipulate recent highs/lows to trigger stops before true reversals begin.
The Liquidity Sweep Engine detects these events by comparing current highs/lows to prior extremes and validating them with above-average volume bursts .
• Bullish Sweep (Blue dot below bar): liquidity taken below prior lows, buyers absorb volume → potential reversal up.
• Bearish Sweep (Blue dot above bar): liquidity taken above prior highs, sellers absorb volume → potential reversal down.
This module helps traders recognize Smart Money traps and stop-hunt zones that precede major turning points.
4️⃣ Adaptive Dashboard
A compact, on-chart dashboard summarizes the market state in real time:
• Price Direction — UP / DOWN / FLAT
• Volume Trend — RISING / FALLING
• Move Validity — True / False Move
• Signal Status — Active Buy / Sell / Mixed
• Recent Sweeps — Bull / Bear / Both / None
Border and grid colors are user-configurable for visual clarity.
⸻
5️⃣ Multi-Day OHLC & VWAP Suite
To complement the intraday correlation engine, PVC integrates a Multi-Day OHLC module that automatically projects up to 10 previous-day levels (High, Low, Close, and VWAP).
These act as natural liquidity magnets and reaction zones where price often pauses or reverses.
Users can customize:
• Line colors for each level type
• Universal or per-type line thickness
• Number of days to display (1–10)
This turns the indicator into a complete context map—linking current price–volume behavior with historical reference levels.
⸻
6️⃣ Alerts & Practical Use
Built-in alerts trigger on:
• True Bull Move / True Bear Move (momentum confirmation)
• Buy / Sell Signals (multi-bar strength filter)
• Bullish / Bearish Liquidity Sweep (stop-hunt detection)
Best use cases
• Identify whether a breakout is real or fading before entering.
• Confirm reversals with simultaneous volume confirmation + liquidity flush.
• Combine with VWAP or structure tools to align with institutional footprints.
⸻
7️⃣ Why PVC is Original
While most volume indicators only show totals or ratios, PVC focuses on behavioral correlation—the timing and agreement between price change and participation.
By merging price–volume validation, trap detection, and multi-day liquidity mapping inside one unified system, PVC provides a contextual narrative of market strength that no single classic indicator offers.
⸻
How to Use
1. Apply on any timeframe or instrument.
2. Observe candle colors for confirmation or divergence.
3. Watch the dashboard: when both Price UP + Volume Rising + True Move + Buy Active, the move has strong backing.
4. If “False Move” or “Liquidity Sweep” appears, expect a possible reversal.
5. Align entries with daily VWAP/High/Low zones for confluence.
⸻
⚠️ Disclaimer
This script is for educational and analytical purposes.
It does not constitute financial advice or a guaranteed signal system.
Always confirm with your broader trading strategy and risk management.
⸻

Volume x PriceThis indicator displays the traded volume weighted by the closing price of each candle. It's useful for visualizing the intensity of capital movement in the market, beyond traditional volume.
Calculation: Volume × Closing Price
Display: Column-style histogram
Coloring:
🟩 Green if the session was bullish (close > open)
🟥 Red if the session was bearish (close < open)
Ideal for spotting high-activity zones with directional bias. It complements classic volume analysis and helps identify strong capital inflows or outflows.

Candlestick Absorption (Pure Price+Volume)📘 Candlestick Absorption (Pure Price + Volume)
An original approach to detecting hidden institutional absorption using nothing but candle structure and relative volume.
🧠 Concept
Every candle tells a story — not just in its color, but in the battle between aggressive orders and passive liquidity.
This indicator isolates those moments where one side of the market absorbs the other’s aggression — when a candle shows excess wicks on high volume but fails to extend in that direction.
Unlike traditional volume indicators or oscillators, this script focuses solely on the interaction between wick length, body size, and relative volume , giving a pure price–volume perspective of absorption and exhaustion.
⚙️ How It Works
1. Relative Volume Detection
• Compares each candle’s volume to a configurable moving average (default SMA 20).
• Marks only candles with significantly above-average activity (e.g. 1.5× SMA) as eligible for absorption.
2. Wick–Body Anatomy Analysis
• Measures the proportion of each candle’s wicks and body within its total range.
• Focuses on long wicks with small bodies , representing strong push-and-absorb behavior.
• The close must remain off the extreme by a user-defined percentage to confirm that the move was rejected.
3. Absorption Logic
• Bullish Absorption (⬆) → long lower wick, high volume, small body, close away from the low → demand absorbed selling pressure.
• Bearish Absorption (⬇) → long upper wick, high volume, small body, close away from the high → supply absorbed buying pressure.
4. Cooldown & Clarity
• A built-in cooldown prevents repetitive signals in congestion zones.
• Optional translucent absorption zones (boxes) extend forward, helping you visualize where future retests may react.
🎯 How to Use It
• Watch for Absorb ⬆ or Absorb ⬇ markers near swing highs/lows, session extremes, or fair-value gaps — these often highlight zones of institutional absorption or stop-runs.
• Combine with market structure or order-flow context rather than standalone entries.
• Use zones as potential re-entry or rejection levels when price revisits them.
• For intraday use, increase High-Volume Factor to 1.8–2.2 to filter noise.
• For higher timeframes, relax wick/body thresholds slightly to capture broader absorption events.
⸻
🔍 What Makes It Original
• Pure Price + Volume logic — no MAs, RSI, VWAP, or momentum filters.
• Uses dynamic wick-to-range ratios and relative-volume qualification instead of arbitrary thresholds.
• Adaptive visual design: the plotted boxes fade as they age, making absorption footprints visually intuitive.
• Works across any market (stocks, crypto, indices, futures) and timeframe without recalibration.
• Zero repainting. All signals are based on completed bars only.
🧩 Inputs Summary
Volume Filter : Volume SMA Length, High-Volume Factor
Defines how much higher a candle’s volume must be compared to its average
Candle Anatomy : Min Wick % of Range, Max Body % of Range, Close Off Edge %
Controls candle geometry for valid absorption
Signal Logic [/b : Cooldown Bars, color filters
Reduces clutter and false clustering
Zones : Draw Zones, Zone Forward Bars, Opacity Levels
Paints temporary liquidity footprints
Visuals : Background Tint
Highlights active absorption bars
⚠️ Important Notes
• Absorption ≠ instant reversal — it’s often a precursor to exhaustion or liquidity shift.
• Always confirm with structure, trend context, or additional confluence.
• Use at your own discretion; the script makes no performance claims.
💡 Suggested Use Cases
• Identifying trap candles at swing highs/lows.
• Spotting hidden institutional participation before reversals.
• Filtering false breakouts in tight ranges.
• Defining retest zones for Smart-Money or volume-profile strategies.

Daniel.Yer Volume Breakout Signal🧠 Summary – Daniel.Yer Volume Breakout Signal
The indicator only works on time frames of minutes.
An indicator that detects high-volume breakouts after the market opens and highlights potential entry zones.
Based on sampling the opening volume window and comparing it to the session’s volume peak.
Visually marks preparation areas (colored background) and plots BUY/SELL triangles for confirmation candles.
Includes real-time alert conditions for leading tickers: SPY, AAPL, MSFT, META, AMD, TSLA, NVDA, PLTR, GOOG, and AMZN.
Optimized for day trading — provides actionable alerts even when the user is offline.

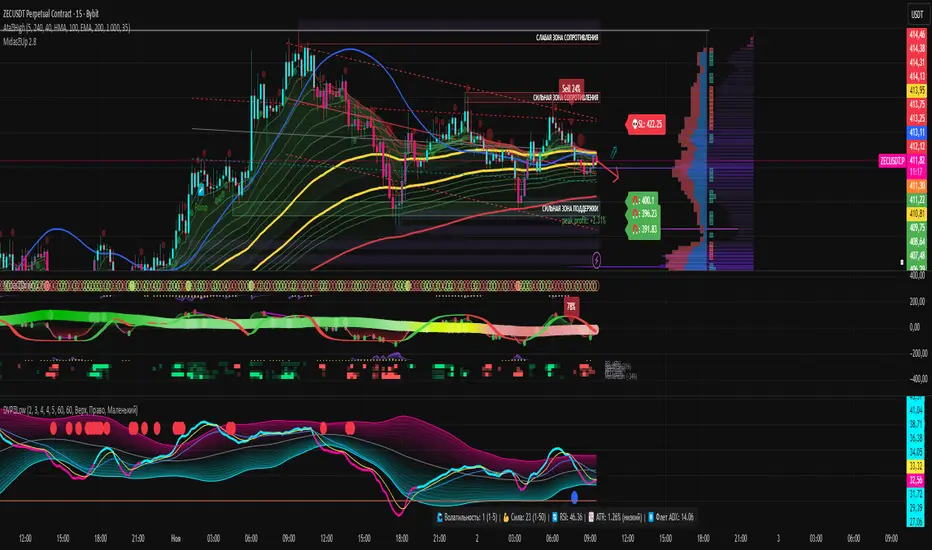
Dynamic Volume ✨ Profile PublicThis script is a comprehensive Pine Script indicator for TradingView called "Dynamic Volume Profile." It analyzes price and volume data to calculate a dynamic oscillator, adaptive midlines, and volume-weighted price deviations. The script highlights bullish and bearish zones, detects trend reversals, and plots signals for potential long and short entries using colored circles. It also visualizes probability density function (PDF) zones to identify statistically favorable trading areas. Additionally, it automatically detects trend direction, volatility, and trend strength, and can display a table of major global trading sessions with real-time status and countdowns. The script is highly customizable for different assets, timeframes, and trading styles.
Delta Arbitrage [by Oberlunar]Delta Arbitrage turns fragmented exchange activity into a single, readable pulse. Each broker breathes at its own rhythm; this tool measures the share of “buy vs. sell” participation per broker, weights those brokers by liquidity/activity, and blends them into one continuous bias. The result is a chart you can read in seconds: aqua when buy-side dominates, red when sell-side does—stronger shades for stronger imbalances.
Delta Arbitrage indicator supports several ways to colour candles based on the aggregated, cross-venue delta, so you can match visual feedback to the strength/consensus of flow.
Examples
LONG opportunity — broad bullish agreement (>70% weighted Buy%)
In this case, a LONG setup formed because a high proportion of brokers simultaneously pushed bullish volumetric deltas (>70%).
The corridor then stayed positive across multiple bars, with sustained long strength in agreement across venues:
Follow-through:
SHORT opportunity — broad bearish agreement (<20% weighted Buy%)
Here, a SHORT setup formed because a high proportion of brokers simultaneously pushed bearish volumetric deltas (<20%).
The corridor remained negative over several bars, showing high-intensity short pressure in cross-venue agreement:
Follow-through:
Spectral mode
You can enable the spectral mode, where range candles are colored only when multiple brokers are in volumetric agreement. You’ll see bullish pressure when weighted Buy% exceeds ~70%; when direction changes, range candles fade out and the lower tiles flip red to reflect rising short pressure.
Example:
How it’s built (in plain words)
For every selected broker, the script computes a robust Buy% over a rolling window and maps it to a signed bias (−1…+1).
Venues are then combined with flexible weighting—Equal, Last Volume, SMA Volume, or Relative-to-SMA—to emphasise who is active now .
A small neutral band near zero calms noise; an intensity curve (gamma) makes strong pushes visually obvious without overshooting weak ones.
What you see
Tinted bars/background : the aggregate bias colours the chart so the prevailing side is instantly clear.
Dashboard : a compact meter for each venue (SELL⇄BUY), its normalised weight, and exact Buy%/bias, plus a summary line for the weighted & unweighted aggregates. It shows whether one venue is dragging the whole market or if participation is broad.
Lower panel (timeline) : a tile-per-bar strip using the same bias logic. Long, saturated runs = sustained participation; choppy, desaturated tiles around zero = balance/compression. The strip’s height is fixed vs. a recent range, so it remains legible on any zoom.
How to act on it (minimal, auditable rules)
Entries: a one-shot arrow when the weighted Buy% crosses a high/low threshold (e.g., >70 for longs, <30 for shorts).
Exits: trail the indicator itself—close when the weighted Buy% retraces by a set number of points from its peak (long) or trough (short).
Context: prefer entries that align with a fresh, persistent run in the lower strip and supportive rows in the dashboard; fade/exit when the strip desaturates or flips.
Do not operate when the average volumetric pressure (avg) is around 50% +- 15%
Why it matters
This is not tick-level microstructure; it’s a fast, stable cross-venue proxy designed for operational use on any timeframe. By unifying “who’s in charge, for how long, and how strongly,” the indicator reduces discretionary noise and turns participation into a tradable, testable context.
— Oberlunar 👁 ★

VolumeAnlaysis### Volume Analysis (VA) Indicator
**Overview**
The Volume Analysis (VA) indicator is a dynamic overlay tool designed for traders seeking to identify high-volume breakouts, retests, and multi-timeframe volume-driven price cycles. By combining volume spikes with price action and support/resistance boxes, it highlights potential trend continuations, reversals, and cycle shifts. Ideal for intraday and swing trading on stocks, forex, or crypto, it uses a Fibonacci-inspired 1.618 multiplier to detect significant volume surges, then maps them to visual boxes and key levels for actionable insights.
This indicator draws from volume profile concepts but focuses on **breakout confirmation** and **cycle momentum**, helping you spot when "smart money" volume aligns with price extremes. It's particularly useful in volatile markets where volume precedes price moves.
**How It Works**
1. **Volume Break Detection**:
- Identifies a "Volume Break" when the current bar's volume exceeds 1.618x the highest volume from the prior 5 bars. This signals unusual activity, often preceding breakouts.
- A "Volume Retest" triggers exactly 3 bars after a break if volume has been falling steadily over those 3 bars—indicating a pullback for re-accumulation/distribution.
2. **Visual Annotations**:
- **Labels**: Green/red/yellow labels mark Volume Breaks and Retests, positioned above/below the bar based on candle direction for clarity.
- **Demand/Supply Boxes**:
- Blue semi-transparent boxes form around Retest bars, extending rightward to act as dynamic support/resistance.
- Green (bullish) or red (bearish) boxes draw from Volume Breaks, based on the original candle's open/close, highlighting potential zones for continuation.
- Limited to 5 boxes max to avoid chart clutter; older boxes fade as new ones form.
3. **Box Interaction Signals**:
- When price enters a box:
- **Reversal Hints**: Maroon (bearish rejection) or lime (bullish rejection) labels on closes against the trend with opening price momentum.
- **Breakout Arrows**: Up/down arrows on crossovers/crossunders of box tops/bottoms from Retest boxes.
- Scans all active boxes for interactions, prioritizing recent volume events.
4. **Multi-Timeframe Volume Cycles**:
- Aggregates the "Volume Break Max" level (a proxy for key price extremes tied to volume spikes) across timeframes: 1min, 5min, 10min, 30min, and 65min (using `request.security`).
- Computes **MaxVolBreak** (highest extreme) and **MinVolBreak** (lowest extreme) for trend-following levels.
- Tracks **Percent Volume Greater/Less Than Close**: Sums volumes from TFs where price is below/above these levels, creating a momentum ratio.
- **CrossClose**: Plots the prior close where this ratio crosses (gray line), signaling cycle shifts—bullish below MinVolBreak, bearish above MaxVolBreak.
- **Fills**: Red fill above CrossClose/MaxVolBreak (bearish cycle); green below CrossClose/MinVolBreak (bullish cycle).
5. **Plots**:
- Black lines for MaxVolBreak (⏫) and MinVolBreak (⏬).
- Gray 🔄 for CrossClose.
- Colors dynamically adjust (green/red) based on close relative to levels.
**Key Features**
- **Trend vs. Reversal Modes**: Toggle alerts for trend-following breaks (crosses of Max/MinVolBreak) or reversal signals (crosses of CrossClose).
- **Multi-TF Fusion**: Optionally include the chart's native timeframe in Max/Min calculations for finer tuning.
- **Box Management**: Auto-prunes to 5 boxes; focuses on retest/break alignments for "inside bar" logic.
- **Momentum Filters**: Uses rising/falling opens and crossovers for label precision, reducing noise.
- **Customizable**: Simple inputs for alert visibility and timeframe inclusion.
**Settings**
| Input | Default | Description |
|-------|---------|-------------|
| Show Volume Reversal Breaks | False | Enables alerts/labels for CrossClose crosses (cycle reversals). |
| Show Trend Following Breaks | True | Enables alerts for Max/MinVolBreak crosses (trend signals). |
| Use Current Time | False | Includes chart's native TF in multi-TF Max/Min calculations. |
**Alerts**
- **Reversal Alerts** (if enabled): "Volume Reverse Bullish/Bearish Break of " on close crosses of CrossClose.
- **Trend Alerts** (if enabled): "Trend Volume Bullish/Bearish Signal" on close crosses of Max/MinVolBreak; plus notes if prior low/high aligns with levels.
- All alerts include ticker and level value for easy scanning. Use `alert.freq_once_per_bar` to avoid spam.
**Trading Ideas**
- **Bullish Entry**: Green box formation + price holding MinVolBreak + upward arrow on retest box. Target next resistance.
- **Bearish Entry**: Red box + close above MaxVolBreak + red fill activation. Stop below recent low.
- **Cycle Trading**: Watch CrossClose crosses for regime shifts—fade extremes in overextended cycles.
- **Best Timeframes**: 5-30min for intraday; combine with daily for swings. Works best on liquid assets with reliable volume data.
**Limitations & Notes**
- Relies on accurate volume data (e.g., stocks/forex); less effective on low-volume or synthetic instruments.
- Boxes extend rightward but don't auto-delete—monitor for clutter on long histories (max_bars_back=500).
- Some logic (e.g., exact 3-bar retest) is rigid; backtest for your market.
- Open-source under MPL 2.0—fork and tweak as needed!
For questions or enhancements, drop a comment below. Happy trading! 🚀

Daily Pivot Points LEVELS S-RThis indicator plots daily pivot points based on the previous day’s high, low, and close. It displays the main pivot line, as well as the first levels of support (S1) and resistance (R1), with optional second levels (R2, S2) for additional reference. Ideal for
USDJPY Fair Value Gap + Session Strategy🎯 Overview
This strategy combines Fair Value Gaps (FVGs) with session-based order flow analysis, specifically optimized for USDJPY. It identifies price inefficiencies left behind by institutional order flow during high-volatility trading sessions, offering a modern alternative to traditional lagging indicators.
🔬 What Are Fair Value Gaps?
Fair Value Gaps represent areas where aggressive institutional buying or selling created "gaps" in the market structure:
Bullish FVG: Price moves up so aggressively that it leaves unfilled buy orders behind
Bearish FVG: Price moves down so quickly that it leaves unfilled sell orders behind
Research shows approximately 80% of FVGs get "filled" (price returns to the gap) within 20-60 bars, making them highly predictable trading zones.
(see the generated image above)
(see the generated image above)
FVG Detection Logic:
text
// Bullish FVG: Gap between high and current low
bullishFVG = low > high and high > high
// Bearish FVG: Gap between low and current high
bearishFVG = high < low and low < low
🌏 Session-Based Trading
Why Sessions Matter for USDJPY
(see the generated image above)
Tokyo Session (00:00-09:00 UTC)
Highest volatility during first hour (00:00-01:00 UTC)
Average movement: 51-60 pips
Best for breakout strategies
London/NY Overlap (13:00-16:00 UTC)
Maximum liquidity and institutional participation
Tightest spreads and most reliable FVG formations
Optimal for continuation trades
Monday Premium Effect
USDJPY moves 120+ pips on Mondays due to weekend positioning
Enhanced FVG formation during session opens
📊 Strategy Components
(see the generated image above)
1. Fair Value Gap Detection
Identifies bullish and bearish FVGs automatically
Age limit: FVGs expire after 20 bars to avoid stale setups
Size filter: Minimum gap size to filter out noise
2. Session Filtering
Tokyo Open focus: Trades during first hour of Asian session
London/NY Overlap: Captures high-liquidity institutional flows
Weekend gap strategy: Enhanced signals on Monday opens
3. Volume Confirmation
Requires 1.5x average volume spike
Confirms institutional participation
Reduces false signals
4. Trend Alignment
50 EMA filter ensures trades align with higher timeframe trend
Long trades above EMA, short trades below
Prevents costly counter-trend trades
5. Risk Management
2:1 Risk/Reward minimum ensures profitability with 40%+ win rate
Percentage-based stops adapt to USDJPY volatility (0.3% default)
Configurable position sizing
🎯 Entry Conditions
(see the generated image above)
Long Entry (BUY)
✅ Bullish FVG detected in previous bars
✅ Price returns to FVG zone during active trading session
✅ Volume spike above 1.5x average
✅ Price above 50 EMA (trend confirmation)
✅ Bullish candle closes within FVG zone
✅ Trading during Tokyo open OR London/NY overlap
Short Entry (SELL)
✅ Bearish FVG detected in previous bars
✅ Price returns to FVG zone during active trading session
✅ Volume spike above 1.5x average
✅ Price below 50 EMA (trend confirmation)
✅ Bearish candle closes within FVG zone
✅ Trading during Tokyo open OR London/NY overlap
📈 Expected Performance
Backtesting Results (Based on Similar Strategies):
Win Rate: 44-59% (profitable due to high R:R ratio)
Average Winner: 60-90 pips during London/NY sessions
Average Loser: 30-40 pips (tight stops at FVG boundaries)
Risk/Reward: 2:1 minimum, often 3:1 during strong trends
Best Performance: Monday Tokyo opens and Wednesday London/NY overlaps
Why This Works for USDJPY:
90% correlation with US-Japan bond yield spreads
High volatility provides sufficient pip movement
Heavy institutional/central bank participation creates clear FVGs
Consistent volatility patterns across trading sessions
⚙️ Configurable Parameters
Session Settings:
Trade Tokyo Session (Enable/Disable)
Trade London/NY Overlap (Enable/Disable)
FVG Settings:
FVG Minimum Size (Filter small gaps)
Maximum FVG Age (20 bars default)
Show FVG Markers (Visual display)
Volume Settings:
Use Volume Filter (Enable/Disable)
Volume Multiplier (1.5x default)
Volume Average Period (20 bars)
Trend Settings:
Use Trend Filter (Enable/Disable)
Trend EMA Period (50 default)
Risk Management:
Risk/Reward Ratio (2.0 default)
Stop Loss Percentage (0.3% default)
🎨 Visual Indicators
🟡 Yellow Line: 50 EMA trend filter
🟢 Green Triangles: Long entry signals
🔴 Red Triangles: Short entry signals
🟢 Green Dots: Bullish FVG zones
🔴 Red Dots: Bearish FVG zones
🟦 Blue Background: Tokyo open session
🟧 Orange Background: London/NY overlap
📊 Recommended Settings
Optimal Timeframes:
Primary: 5-minute charts (scalping)
Secondary: 15-minute charts (swing trading)
Parameter Optimization:
Conservative: Stop Loss 0.2%, R:R 2:1, Volume 2.0x
Balanced: Stop Loss 0.3%, R:R 2:1, Volume 1.5x (default)
Aggressive: Stop Loss 0.4%, R:R 1.5:1, Volume 1.2x
Risk Management:
Maximum 1-2% of account per trade
Daily loss limit: Stop after 3-5 consecutive losses
Use fixed percentage position sizing
⚠️ Important Considerations
Avoid Trading During:
Major news events (BOJ interventions, NFP, FOMC)
Holiday periods with reduced liquidity
Low volatility Asian afternoon sessions
When US-Japan yield differential narrows sharply
Best Practices:
Limit to 2-3 trades per session maximum
Always respect the 50 EMA trend filter
Never risk more than planned per trade
Paper trade for 2-4 weeks before live implementation
Track performance by session and day of week
🚀 How to Use
Add the script to your USDJPY chart
Set timeframe to 5-minute or 15-minute
Adjust parameters based on your risk tolerance
Enable strategy alerts for automated notifications
Wait for visual signals (triangles) to appear
Enter trades according to your risk management rules
📚 Strategy Foundation
This strategy is based on:
Smart Money Concepts (SMC): Institutional order flow tracking
Market Microstructure: Understanding how FVGs form in electronic trading
Quantified Risk Management: Statistical edge through proper R:R ratios
Session Liquidity Patterns: Exploiting predictable volatility cycles
