CryptoDon's Buy and Sell Targets Version 1.1This script is str1nger All-time high and percentage drops script with some small mods, such as the previous candles high and low prices.
This script helps me target buy and sell zones based on what percentage the price has dropped.
This is revision #2
Updated as of 2-10-21
变动率(ROC)

CryptoDon's Buy and Sell TargetsThis script is str1nger All-time high and percentage drops script with some small mods, such as the previous candles high and low prices.
This script helps me target buy and sell zones based on what percentage the price has dropped.

RS.ROC | Relative Strength - Rate of Changes - 4CR CUPFor completeness of Relative Strength studies, the Relative Strength based on rate of changes (ROC) with weighting is coded and presented as well.
The RS.ROC is similar to the formulation of RS by IBD before rank among all the stocks in the market.
The lookback period is relaxed for customizing. Once you set the total lookback period, representing the 4Q, in the indicator, the other shorter lookback periods will be auto-calculated, namely, 1Q, 2Q, 3Q.
A simple moving average of the RS.ROC is also added for your easier analysis on the trend development of the strength.
To use it later at your charting later,
1. Favorite it;
2. Select from your favorite list.

Rate of Change Mix(9,12,18)Classic ROC just combined in 3 time frames, its for looking some divergences in different time frame

Nick Rypock Trailing Reverse (NRTR)This indicator was invented in 2001 by Konstantin Kopyrkin. The name "Nick Rypock" is derived from his surname reading in the opposite direction:
Kopyrkin -> Kopyr Kin -> Kin Kopyr -> Nik Rypok
The idea of the indicator is similar to the Chandelier Exit, but doesn't involve ATR component and uses a percentage instead.
A dynamic price channel is used to calculate the NRTR. The calculations involve only those prices that are included in the current trend and exclude the extremes related to the previous trend. The indicator is always at the same distance (in percent) from the extremes reached by prices (below the maximum peak for the current uptrend, above the minimum bottom for the current downtrend).


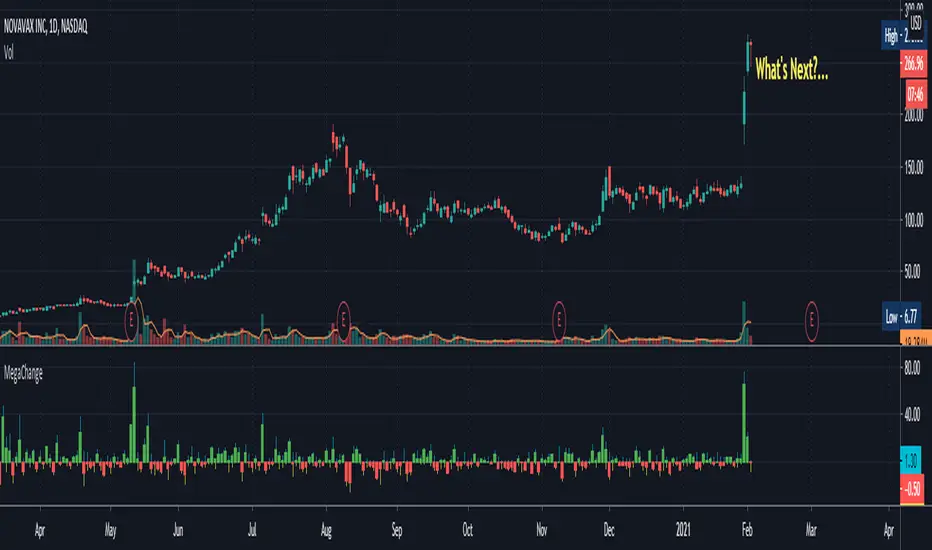
MegaChangeThe MegaChange indicator is a traditional Change - on steroids!
This indicator visualizes the Change from the current bar to the one before.
Besides showing the standard change (% change from the previous bar's Last to current bar's Last),
the indicator also includes the % change from the previous bar's Last
to current bar's High, and to current bar's Low.
The result is always in percentage.
"green" days and "red" days are separated so you can always see on the scales the change for
the last green day and the change for the last red day (only one of whom is the current change).
The indicator demonstrates "how far" the change has gone each way, and where is it currently.
Here's an example, using the chart above:
When we look at the big red candle we might see it as a very bad sign. (With the blue bubble next to it)
When we examine that candle with this indicator - the MegaChange - we can observe that the downside
is very small in comparison to the Upside that came before that. (Tagged as 1)
On the next candle (Tagged as 2) we can see a small tail representing the stock price going down
and coming most of the way back. returning from -16% to only -4% after moving more than +170% only 2 days earlier!
This might mean that the buyers are coming back and they're chasing the stock again for another run (long).
This is an example of how the indicator might indicate future moves, when we might think the move is already over.
Looking at the chart alone might be frightening, but using the indicator makes a change, as we can see that's the downside
was really small relative to the upside. The small tail from the last day might tell us that the buyers are coming back,
and that the stock might still have a potential Upside.
fill free to ask any questions, or tell me if you find this indicator helpful, and how.
Logistic RSI, STOCH, ROC, AO, ... by DGTExperimental attemt of applying Logistic Map Equation for some of widly used indicators.
With this study "Awesome Oscillator (AO)", "Rate of Change (ROC)", "Relative Strength Index (RSI)", "Stochastic (STOCH)" and a custom interpretation of Logistic Map Equation is presented
Calculations with Logistic Map Equation makes sense when the calculated results are iterated many times within the same equation.
Here is the Logistic Map Equation : Xn+1 = r * Xn * (1 - Xn)
Where, the value of r is the key for this equation which changes amazingly the behaviour of the Logistic Map.
The value we have asigned for r is less then 1 and greater than 0 ( 0 < r < 1) and in this case the iterations performed with the maximum number of output series allowed by Pine is quite enough for our purpose and thanks to arrays we can easiliy store them for further processing
What we have as output:
Each iteration result is then plotted (excluding plotting the first iteration), as circles or line based on user preference
Values above and below zero level (0) are coloured differently to emphasis bull and bear power
Finally Standard Deviation of Array's Elements is ploted as line. Users may choose to display this line only
So where it comes the indicators "Awesome Oscillator (AO)", "Rate of Change (ROC)", "Relative Strength Index (RSI)", "Stochastic (STOCH)".
Those are the indicators whose values are assigned to our key varaiable in the Logistic Map equation forulma which is r
Further details regarding Logistic Map can found under the description of “Logistic EMA w/ Signals by DGT” study
Disclaimer:
Trading success is all about following your trading strategy and the indicators should fit within your trading strategy, and not to be traded upon solely
The script is for informational and educational purposes only. Use of the script does not constitute professional and/or financial advice. You alone have the sole responsibility of evaluating the script output and risks associated with the use of the script. In exchange for using the script, you agree not to hold dgtrd TradingView user liable for any possible claim for damages arising from any decision you make based on use of the script

Higher High / Lower Low StrategyThis is a very simple trend following strategy for Day Trading. The premise is to follow the Moving Average for the trend direction and buy/sell the dips and blips in the trend.
1. In an uptrend, when the candle action offers a "dip", or a lower high, the strategy will then buy on the close of the candle that breaks the high of the previous candle.
2. In a downtrend, when the candle action offers a"blip", or a higher low, the strategy will then sell on the close of the candle that breaks the low of the previous candle.
3. The strategy will go Long only or Short only, not both. It must be manually reversed in the settings when a new trend is established.
4. The start month and year allow you to backtest from then until now. It's not one month at a time.
5. The strategy uses a reversal of the Stochastic %K variable as the exist. The setting for Period K controls the exit for backtesting purposes.
6. The strategy uses a moving average to determine the trend. The setting for the Period MA controls the SMA.
7. The strategy has the option of filtering the number of trades based on the direction of the MACD and/or the Signal line. This can either reduce or increase the probability, and is highly dependent on the price action of the instrument.
WARNING: I am not a licensed financial advisor. This script is intended for entertainment purposes only. I highly recommend you manually enter and exit positions per your own Trading Rules, and do not blindly follow any software or recommendation. Use of this script is elective and at your own discretion, and risk.
If you like this script, please give it a Thumb's Up, and leave a comment. If you would like any custom scripts developed, contact me to discuss it. All of my work here is open and available, free of charge. It can be copied and edited to suit your needs.

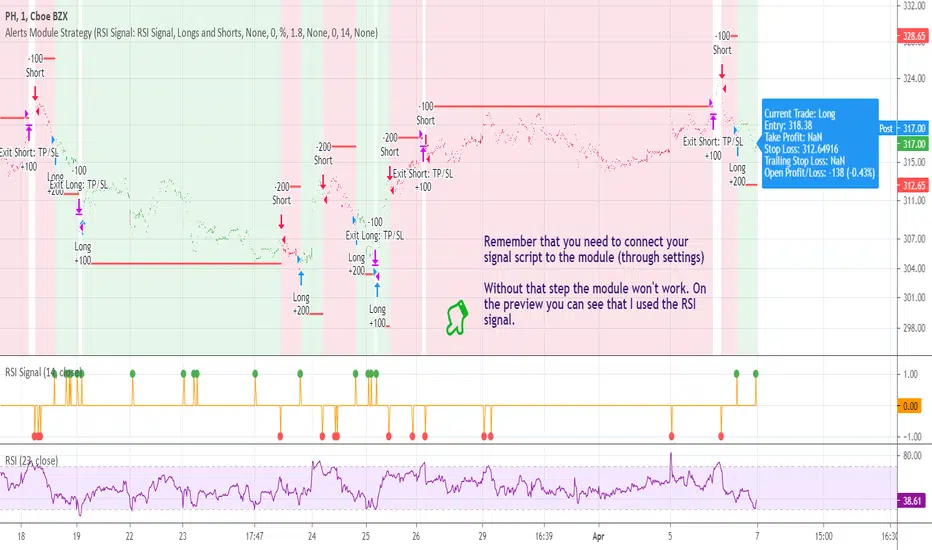
[STRATEGY] Buy/Sell/TP/SL/TSL Alerts ModuleA strategy version of the Buy/Sell/TP/SL/TSL Alerts Module .
It works the same way:
1) You choose a specific indicator and apply it to your chart
2) You create a special signal form of that indicator
3) You connect that form to the module
4) Bob's your uncle
If you have any questions don't hesitate to ask and contact me either via private messages on TradingView or via Telegram.
Thanks!
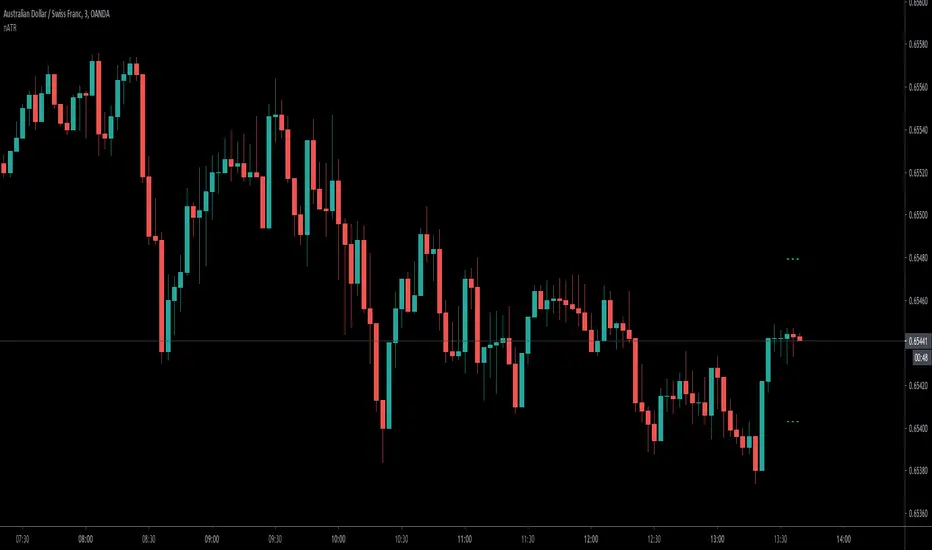
ATR draw on the candle easily setup SL&TPHi,Guys,
Build-in ATR need to read the pips then add on current price to setup safe SL.
But under stress of trading, calculation is not effective.
Input:
Length:Length of ATR
n:n*ATR=Risk
m:m*Risk=TP
the dash line means current price plus n*ATR and minus n*ATR for setup sell or buy stop loss.
If increase m more than 1,you can see the additional line outside the original line in order to setup TP with Reward:Risk more than 1.
Hope you guys enjoy it, and welcome to comment.
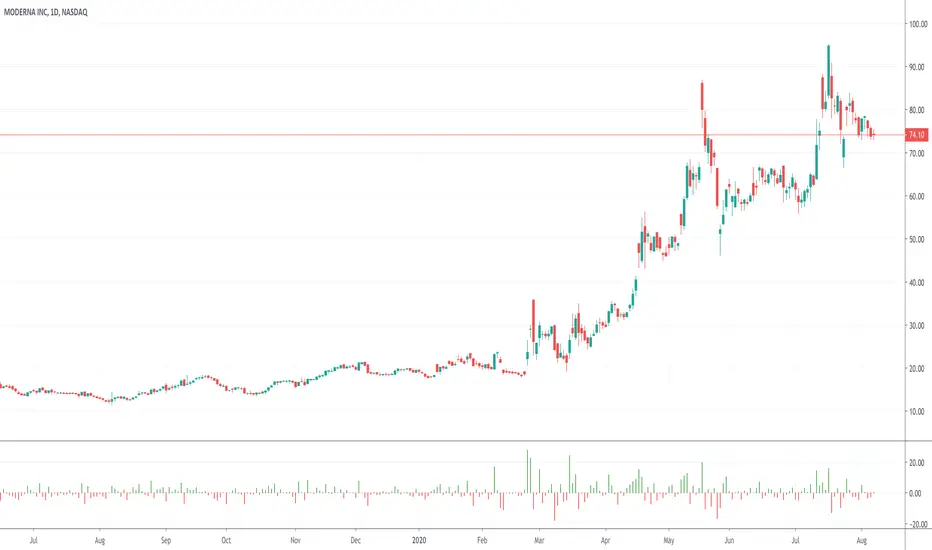
RoC% HistThis script shows the change in percentage of each bar. A glance at the sub-chart will easily show which bars were big movers.
This indicator was mentioned on the August 9 2020 webinar for Dynamic Traders.
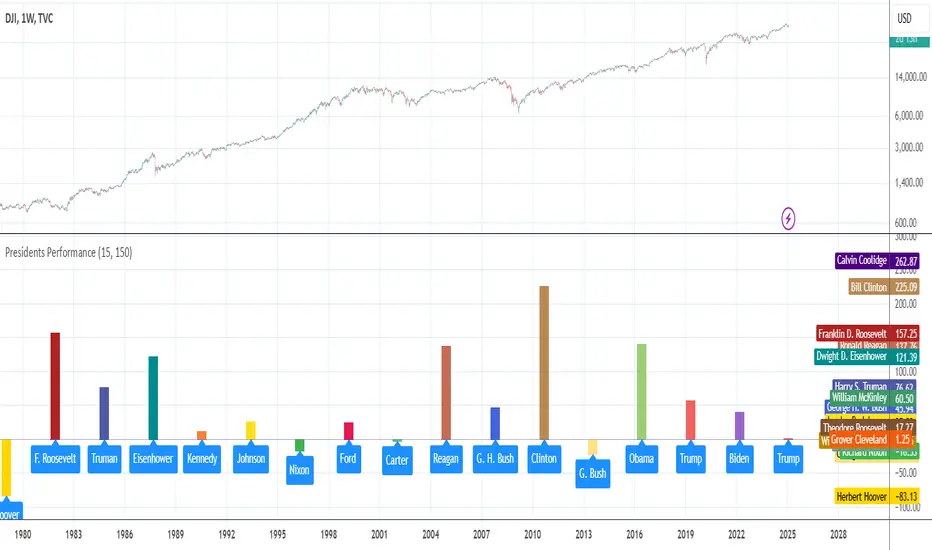
Ticker Performance by US PresidentThe indicator measures and shows a particular ticker's performance for each US president (starting from Grover Cleveland) since taking office
Yogesh_SignalThis signal is to be plotted on the underlying symbol for which options can be sold for the the same.
If signal line is raised with green color that means I can sell put options with proper hedging so that I will not loose more that 3% of my capital.
Until the horizontal zero line is green one can stay in the position with bullish bias. If it turns red then one should exit position, and re-enter again if zero line becomes green
If signal line is raised with red color that means I can sell call options with proper hedging so that I will not loose more that 3% of my capital.
Until the horizontal zero line is redone can stay in the position with bearish bias. If it turns green then one should exit position, and re-enter again if zero line becomes red
Please make sure you do not bet more than 3% of your capital. I am not suggesting anyone to trade based on my indicator. It's for guidance and not to instruct you. All trade decisions are solely your's
Thanks,
Yogesh

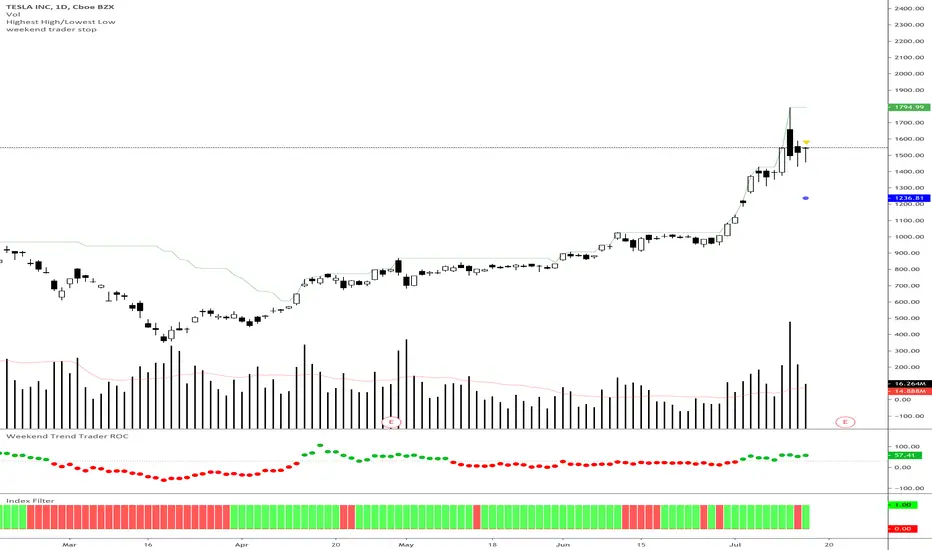
Weekend Trader Smoothed Rate of Change
Rate of change indicator based on Nick Radge's Weekend Trend Trader Strategy, with an added extra of EMA smoothing if you want it.
This indicator simply turns green when the rate of change is above a certain level (value is set in threshold)
Threshold is defaulted to 30 as outlined in the strategy rules
Momentum Acceleration by DGTItalian physicist Galileo Galilei is usually credited with being the first to measure speed by considering the distance covered and the time it takes. Galileo defined speed as the distance covered during a period of time. In equation form, that is v = Δd / Δt where v is speed, Δd is change in distance, and Δt is change in time. The Greek symbol for delta, a triangle (Δ), means change.
Is the speed getting faster or slower?
Acceleration will be the answer, acceleration is defined as the rate of change of speed over a set period of time, meaning something is getting faster or slower. Mathematically expressed, acceleration denoted as a is a = Δv / Δt , where Δv is the change in speed and Δt is the change in time.
How to apply in trading
Lets think about Momentum, Rate of Return, Rate of Change all are calculated in almost same approach with Speed
Momentum measures change in price over a specified time period,
Rate of Change measures percent change in price over a specified time period,
Rate of Return measures the net gain or loss over a specified time period,
And Speed measures change in distance over a specified time period
So we may state that measuring the change in distance is also measuring the change in price over a specified time period which is length, hence
speed can be calculated as (source – source )/length and acceleration becomes (speed – speed )/length
In this study acceleration is used as signal line and result plotted as arrows demonstrating bull or bear direction where direction changes can be considered as trading setups
Just a little fun, since we deal with speed the short name of the study is named after famous cartoon character Speedy Gonzales
Trading success is all about following your trading strategy and the indicators should fit within your trading strategy, and not to be traded upon solely
Disclaimer: The script is for informational and educational purposes only. Use of the script does not constitutes professional and/or financial advice. You alone the sole responsibility of evaluating the script output and risks associated with the use of the script. In exchange for using the script, you agree not to hold dgtrd TradingView user liable for any possible claim for damages arising from any decision you make based on use of the script

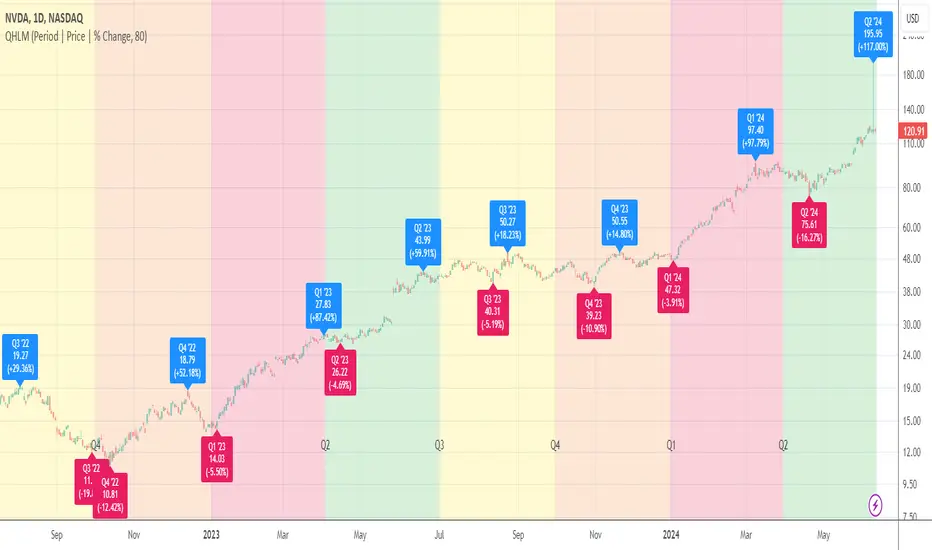
Quarterly High/Low MarksThis utility tool marks the highest and the lowest price of each quarter on the chart. Works everywhere and doesn't use any calls of built-in functions which are used for a data extraction.
Labels provide additional information about closing price and % change for a particular quarter and allow micro customizations.
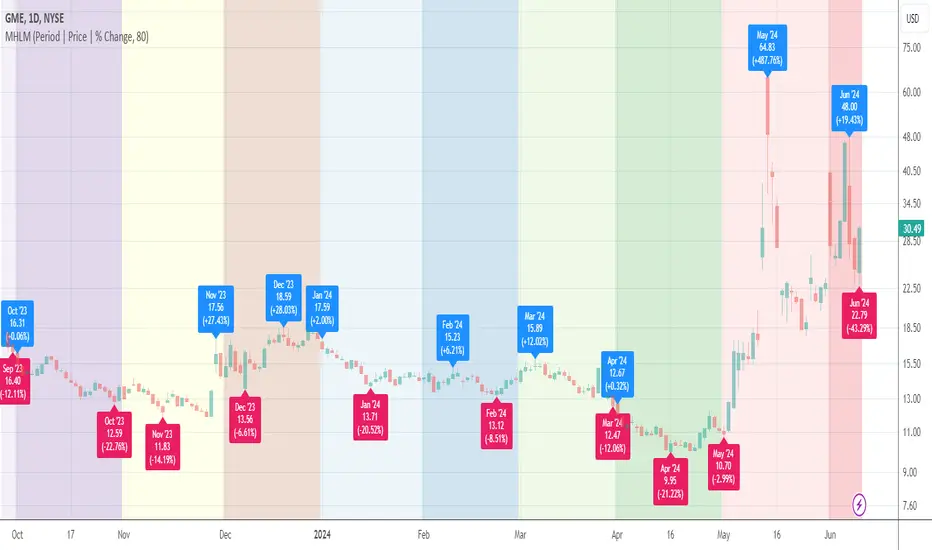
Monthly High/Low MarksThis utility tool marks the highest and the lowest price of each month on the chart. Works everywhere and doesn't use any calls of built-in functions which are used for a data extraction.
Labels provide additional information about closing price and % change for a particular month and allow micro customizations.
Quarter Open Price LevelThis tool plots a dynamic level that represents the opening price of each quarter .
Labels provide additional information about the closing price and % change for a particular quarter and allow micro customizations.

Month Open Price LevelThis tool plots a dynamic level that represents the opening price of each month.
Labels provide additional information about closing price and % change for a particular month and allow micro customizations.

Cracking Cryptocurrency - Quadrigo Position SizingCracking Cryptocurrency - Quadrigo Position Sizing
This indicator is designed to work in conjunction with our position sizing calculations pursuant to the Quadrigo Indicator.
This indicator will allow a trader to input their Account Balance and desired Risk % that they have decided, through their statistical analysis, provides them the greatest Return on Equity balanced against minimal draw down.
Once inputted, the Data Window will display the recommended USD Position Size. It will also pull the current price of Bitcoin, so that a recommended BTC Position Size will be calculated as well, making orders very easy to enter on exchanges that deal in BTC values for order value.
This indicator is optimized for the aesthetics of traders using TradingView's mobile app. With a simple glance you can determine your proper position size for any trade. This is helpful because the larger Quadrigo indicator can take up a lot of screen real estate when on mobile version.

Cracking Cryptocurrency - QuadrigoCracking Cryptocurrency - Quadrigo
An objective method of determining an initial Take Profit and Stop Loss, based on true market volatility and not arbitrary price levels. This indicator gives the user a powerful range of input variation, from Average to Median True Range and a myriad permutations of smoothing and look back lengths, to build an objective value from which to measure profit and stop levels.
This indicator also automatically calculates a recommended position size based on our position sizing methodology. Simply input your capital amount and desired risk level. This indicator will display your optimum position size in USD or BTC, even giving you the flexibility to select your desired exchange for BTC/USD conversion calculations.
Features & Functions
Set custom multipliers for Take Profit and Stop Loss Levels.
Select between Average or Median True Range Calculations.
Select smoothing type and look back length for True Range.
Input custom True Range Level for dialing in precise measurements.
Position Size Calculator.
Aesthetically pleasing display of Take Profit and Stop Loss Levels.
Aesthetically pleasing dashboard display of all relevant trade information including Potential Loss, Distance to Stop Loss, and TR Percentage, among other data.
Indicator displays quantity of position to be removed at each take profit for convenient order setting flow.
---
Purpose
To give clear objective stop losses and take profit levels based off price volatility rather than arbitrary price levels, percentage points, ticks, pips, etc.

TradeSense Breakout Strategy v1TradeSense is a Renko brick breakout trading system for short-term or intraday trade. It is also a trend following strategy using a confluence of multiple MA's to spot the underlying trend. Exit and Stop Loss is based on dynamic ATR to predict possible target based on ticker's real time volatility.
So far this has been back-tested on major cyrptos, and the same concept is applicable to other asset types. It is more suitable for lower timeframes (such as the 30m, 15m, and 5m) though you may try adjusting the parameters for higher timeframes.
Feel free to backtest it and comment below!
Optimum parameters:
BTCUSD-15m
- Noise Filter: 1
- ATRLength : 15
- SL coefficient : 2.0
- TP coefficient : 1.5
ETHUSD-15m
- Noise Filter: 7
- ATRLength : 16
- SL coefficient : 2.0
- TP coefficient : 1.5
