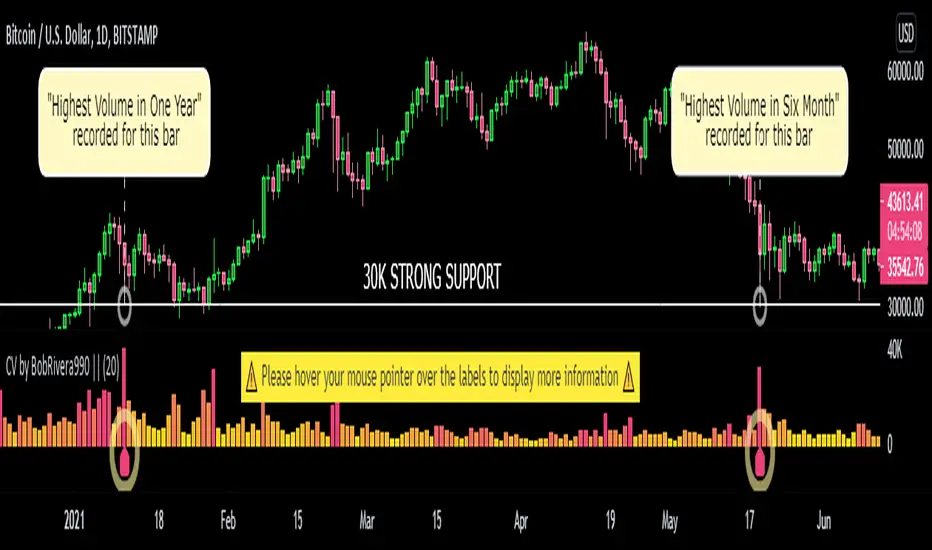
Custom Volume - Periodic Peaks & Troughs + AlertThis script is a custom volume indicator with additional features.
But why is this useful?
The minimum and maximum volumes, in different time periods, are displayed by labels below the bars. I call them "Peaks" and "Troughs".
Hover your mouse cursor over the labels to see more details.
These parameters are widely used in technical analysis.
If traders want to confirm a reversal on a level of support–or floor–they look for high buying volume. Conversely, if traders are looking to confirm a break in the level of support, they look for low volume from buyers.
If traders want to confirm a reversal on a level of resistance–or ceiling– they look for high selling volume. Conversely, if traders are looking to confirm a break in the level of resistance, they look for high volume from buyers.
For example, take a look at the chart.
Settings menu parameters
{Dialog Box} =>
Parameter to show / hide the dialog box.
{Visual Parameters} =>
Parameters to personalize the appearance of the indicator.
{ Alert Conditions Part 01: Peaks ⏰ "} =>
Parameters to customize the alert.
{ Alert Conditions Part 02: Troughs ⏰ "} =>
Parameters to customize the alert.
{Volume MA} =>
Moving average settings
How to use alerts
Note that by creating an alert, an instance of the indicator, with all your settings, will be activated on the site's server and alerts will be triggered by it.
After that, changing the indicator settings on the chart will no longer affect the alert.
Open the settings window and select the alert conditions as you wish
Click the Create Alert button (or press the A key while holding down the ALT key)
In the Condition section, select the name of the indicator.
Make the rest of the settings as you wish.
Finally, click on the Create button.
It's finished. After a few moments, your alert will be added to the Alerts menu.
Limits
The labels are displayed after the bars close.
Labels are displayed for the last 10,000 bars.
References: Investopedia
Resistances
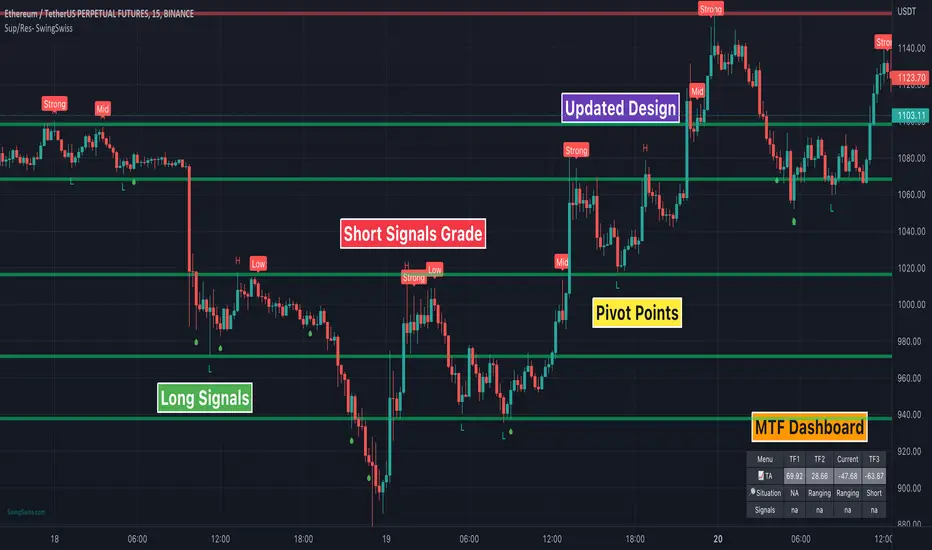
Sup/Res - SwingSwiss SuiteSup/Res can display up to ten different lines of supports and resistance.
It’s super reliable and ultra-customizable. You won’t have to draw them yourself anymore. It’s more accurate and time-saving.
Also, the indicator calculates in real-time the distance in % from the market price to the lines.
The indicator is perfect if you need to define your price limits on a swing trading strategy or for scalping a 5mn chart as a day trader.
Disclaimer:
Trading and investing in the financial markets involves substantial risk of loss and is not suitable for every investor.
All trading strategies are used at your own risk.
Trend Analyzer is part of the SwingSwiss Suite, contact me for more info
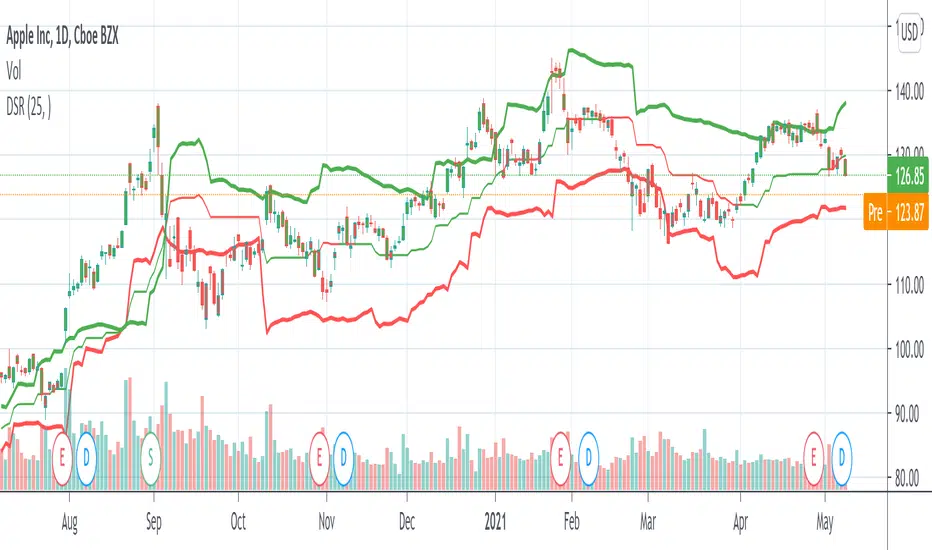
Dynamic Support And Resistance [CC]The Dynamic Support And Resistance Indicator was created by Mike Siroky (Stocks and Commodities pgs 14-18) and this is a handy indicator that will show you useful support and resistance levels no matter how the stock is doing right now. I have color coded the middle line to show buy and sell signals so buy when the line turns green and sell when it turns red.
Let me know if there are any other indicators you want me to publish!
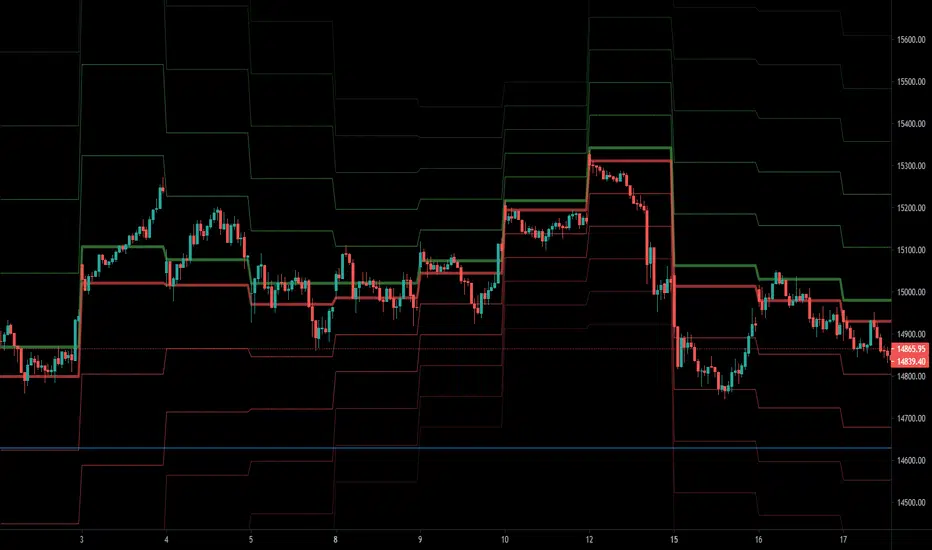
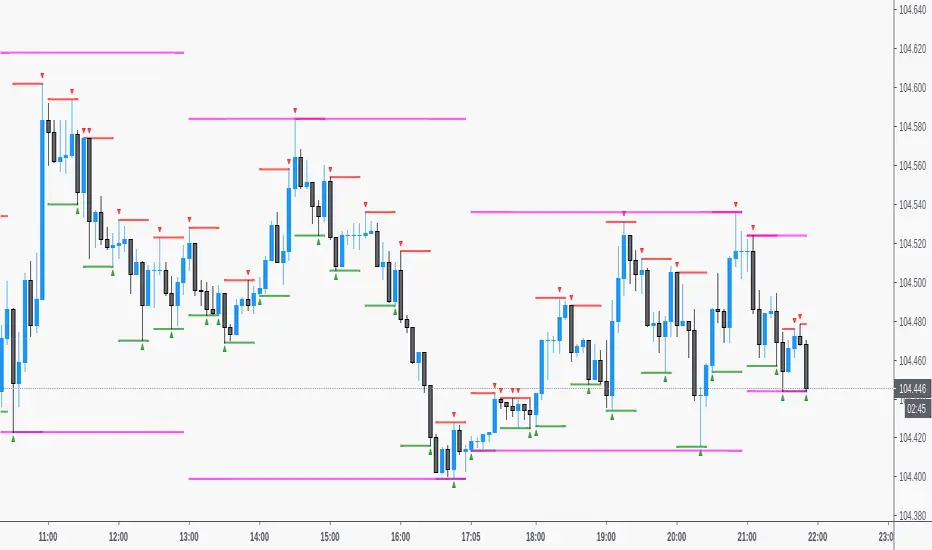
Intraday Zones & Levels - Support & ResistanceI use this indicator to mark levels and mathematically categorize my 15mins chart into smaller trading zones. You can view these as Support and Resistance levels as well, however, the main function is to visually divide the chart on the basis of previous days' price movements.
- Levels are calculated based on the Average % Change per Day for the last 5 Days. Calculations use Daily open Value for the last 5 days & % Change using current open Value.
- Entry Levels ( Bullish and Bearish ) mathematically divide the charts into 2 zones and can be used to determine the nature of the stock movement during that day.
- Weekly and Yearly Open Prices are also plotted on the chart as reference levels.
[RickAtw] O1 Opening Market LineThis indicator helps to identify current support and resistance based on the opening of the Asian, London and New York sessions.
Function
You can make good trade entries based on these lines. Shows daily and weekly openings of each session
It will also help you to look at which session you are currently trading)
Purple ----> Asian session
Red ----> London session
Blue ----> New York session
Key Signal
buy ---> A strong buy signal is a bounce from the low and the presence of a weekly or day open line.
sell ---> A strong sell signal is a bounce from the maximum and the presence of a weekly or day open line.
P.S. Be sure to test on your pair!
Remarks
This will help you determine the approximate area of support and resistance.
Since we cannot look into the future, it does not inform you about the exact records, but a possible change in trends.
Readme
In real life, I am a professional investor. And I check each of my indicators on my portfolio and how effective it is. I will not post a non-working method. The main thing is to wait for the beginning of trends and make money!
I would be grateful if you subscribe ❤️

Ichimoku + 2 base linesIchimoku + 2 base line
This indicator is a combination of Ichimoku cloud indicator with two base lines.
The first base line is the same as the Ichimoku default settings but the baseline 2 indicates an average of 108 candles in the past and it acts as a strong support and resistance level.
How to use this indicator?
You can use this indicator to see if a break out is true or is a false break. For example if the price broke up the Ichimoku cloud and base line 2 is above the price, it will probably react to that area but if it's below the price, it is a good opportunity to buy. (for sell/short position it is in the opposite way the base line 2 should be above the price)
If you want to trade in support zones base line 2 (108) is a very good area that you can wait for a good candlestick pattern to enter a position.
Caution: before using this indicator please back test it and if the results were good enough, use it as a confirmation.

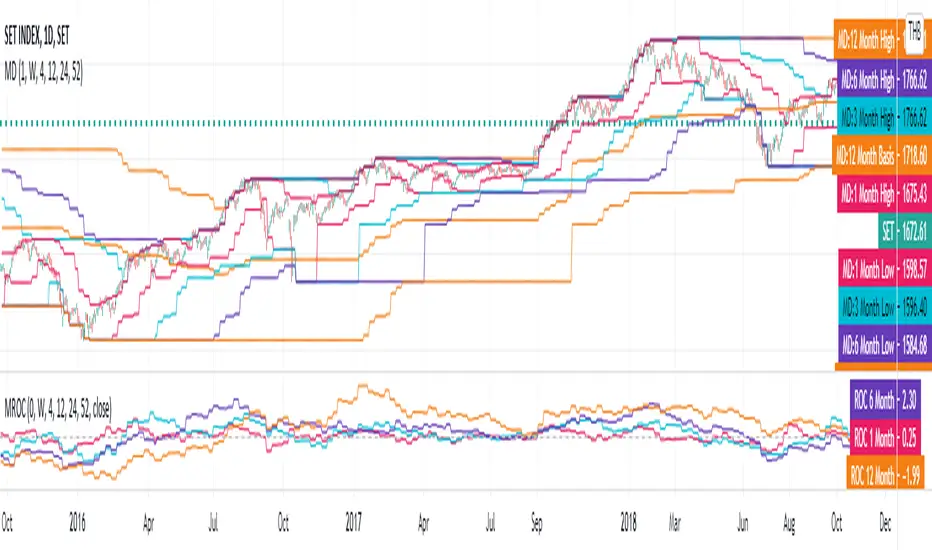
[Jett.][GoldenRush] Market DirectionThis script was created to analyze levels of market trends.
This is an indicator that is used to analyze the overall 2 levels.
1.Considering the index's key trends (Strategic Level)
2.Trend Analysis (Tactical Level)
To get a big overview of the trend and catch short-term movements. In this indicator, there are 4 levels of momentum measurements.
with the default setting
Major trends (Strategic Level)
1.We have the highest and lowest prices in the 52-week or 1-year scale.
2.We use the average of the highest and lowest prices(basis of 52-week). can be filtering the overview of the trend
3.As for the trend in 24-week or 6-month. Used to find the direction of the price And helps confirm that a trend is starting to take a certain direction.
Sub-level trend (Tactical Level)
1.Price in the level 12-week or 3-month. We use it to calculate the direction of movement in the short term, it is possible that the market will be bullish or bearish in 3-month.
2.And the 12-week or 3-month price is a confirmation of how strongly the short-term price moves in any direction.
3.If there will be a correction of the price base 12 weeks or 3-month price swings always happen first.
4.The 1-month price is the same as the trigger, if the market has a breakout in any way it could mean the start of a short sway.
By this indicator Besides being used to measure direction or trend, it can also be used as a significant filter for both support and resistance for short, medium, long term.
Jet.T.S. Trader
Toltecas Tendencies, Supports and Resistances V2Trend Lines, Supports and Resistances.
Triangles indicators for confirmations buy/sell.
Use for binaries (1M-3M-5M)
- LRG_Channel_TF_mins_D_W_M = 30
- Range = 1
- SML_Channel_TF_mins_D_W_M = 240
Use for forex/cryptocurrencies/indices (15M-1H-4H)
- LRG_Channel_TF_mins_D_W_M = D
- Range = 1
- SML_Channel_TF_mins_D_W_M = W
Standard deviation zones Support & Resistance [LM]Hi Guy,
I would like to introduce you Standard deviation zones Support & Resistance horizontals. It draws line horizontals on high and low st dev zone. The colors are dynamic depending whether price is below or above the line.
Credit is due to @Zeiierman for st dev zone calculation so shout out to him.
There are various sections in setting:
general setting where you can select source for zone calculation
tops setting
bottom setting
show and hide section of the first timeframe
show and hide section of the second timeframe
Be aware that when new zone starts and is not finished yet than the top will trail the high of unfinished zone that could be also at the high of current candle and next candle it can change
Any suggestions are welcomed

SR Levels - Major Support and Resistance LevelsHello Traders!
This Indicator helps you to identify Major support and resistance level. Major Vibration numbers are working as support & resistance in the many scripts as I have seen. Since I have my research about the vibration numbers, I strongly believe these numbers are works as good Support & Resistance. This is just try to idendify the those number to enter into the trade. Use Other indicators to Identify Trend and for your support!
When Price move low to high:
1) Green Line works are buy entry point, TP area is Red Line, SL area also Red Just below the Green Line
When Price Move High to Low:
1) Red Lines are works as Sell entry point, TP are Green Line, SL area also Green Lines just above the Red Line.
Notes: This Indicators is mainly focus the script which more than 5 digit scripts. Example above 10000 price scripts only.. for Intraday. below 10000 or 1000 scripts also works but for long term not for intraday...
NSE:BANKNIFTY
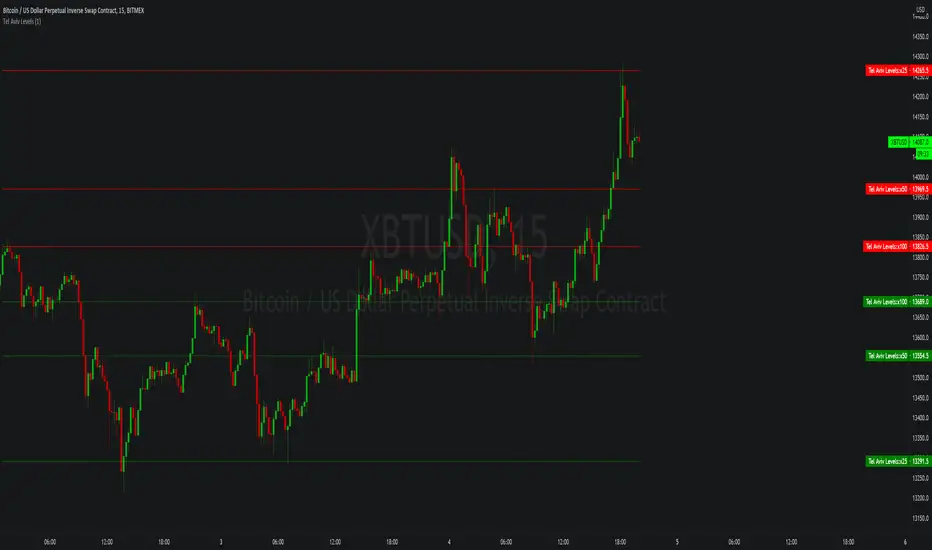
Tel Aviv LevelsSimple script that calculates static support/resistance levels for potential price reversals using a calculation for predicting liquidity from a base price, use in confluence with other technical analysis tools.
DM me on tradingview for access.
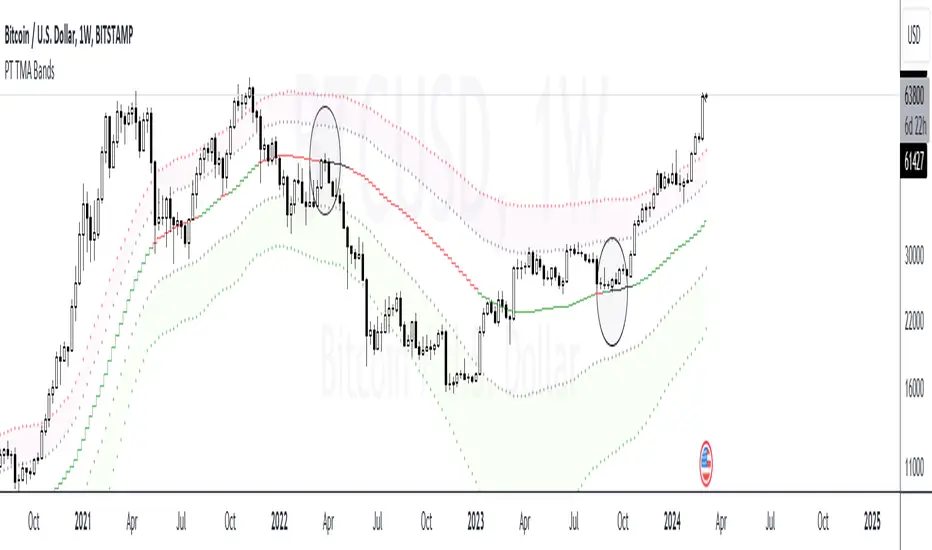
PT TMA BandsVersion 1.0 of our TMA Bands is a visual of areas of interest. The purpose of this indicator is to determine where the price will likely bounce or reject. When an asset is ranging, it very well respects the neutral (middle) zone. The highest RR trade setups are when the price goes from one end of the bands to another.
The bands included are of an ATR multiplier based on multiple moving averages. Each moving average has a unique feature that offers a high probability reaction when price gravitates towards it. We have color-coordinated the bands into three zones. The Main zone being the middle area where the asset tends to play ping pong & range, Top zone, which offers the best RR for shorts & the bottom zone, which provides the best RR for longs.
Strategy:
When scalping or swinging, always look for shorts close to the red zone as possible with a stop loss above the red band. When longing, always look for longs close to the green zone area with a stop loss below the green band. Anything in orange is a neutral zone, which will confirm the asset is more than likely ranging. I don’t advise taking trades in that zone unless you have solid risk management. When playing the macros, H12+ always look for price to find support at the orange (middle) band before deciding on a shift in trend. If the asset breaks down from the orange (middle) band, you usually get a retest of that band before further downside. Also, something to consider, if you punt longs at the green zone, you want to target the orange (middle) band. If you punt shorts at the red zone, you want to target the orange (middle) band. I usually take 70% off at the middle band & let the rest run if ultimately end up in the opposite zone.
This Oscillator is best with the buy/sell signals we provide. It offers extra confluence with stop loss & targets. I enjoy using it on all time frames for swinging & scalping. It is included as part of the library. Just message us for access!
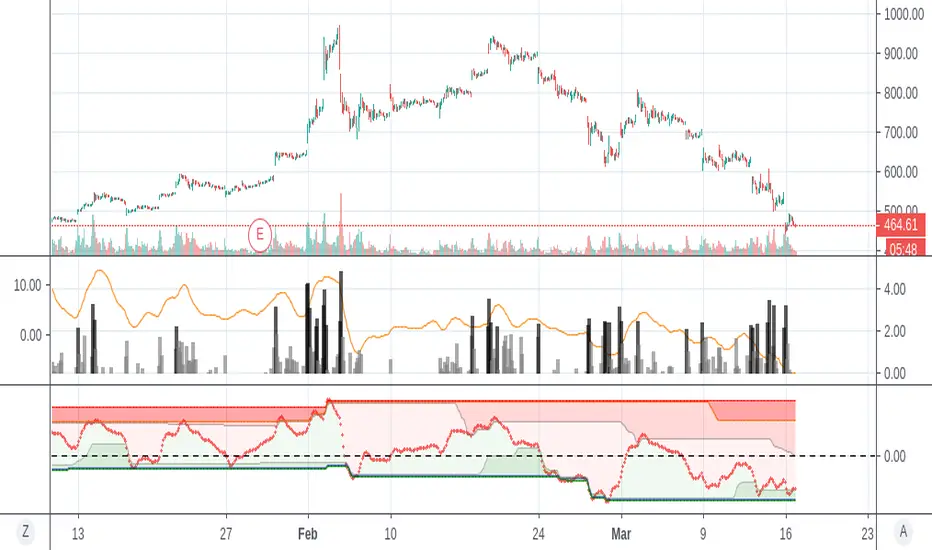
Freedom of MovementFreedom of Movement Indicator
---------------------------------------------------------
In “Evidence-Based Support & Resistance” article, author Melvin Dickover introduces two new indicators to help traders note support and resistance areas by identifying supply and demand pools. Here you can find the support-resistance technical indicator called "Freedom of Movement".
The indicator takes into account price-volume behavior in order to detect points where movement of price is suddenly restricted, the possible supply and demand pools. These points are also marked by Defended Price Lines (DPLs).
DPLs are horizontal lines that run across the chart at levels defined by following conditions:
* Overlapping bars: If the indicator spike (i.e., indicator is above 2.0 or a custom value) corresponds to a price bar overlapping the previous one, the previous close can be used as the DPL value.
* Very large bars: If the indicator spike corresponds to a price bar of a large size, use its close price as the DPL value.
* Gapping bars: If the indicator spike corresponds to a price bar gapping from the previous bar, the DPL value will depend on the gap size. Small gaps can be ignored: the author suggests using the previous close as the DPL value. When the gap is big, the close of the latter bar is used instead.
* Clustering spikes: If the indicator spikes come in clusters, use the extreme close or open price of the bar corresponding to the last or next to last spike in cluster.
DPLs can be used as support and resistance levels. In order confirm and refine them, FoM (Freedom of Movement) is used along with the Relative Volume Indicator (RVI), which you can find here:
Clustering spikes provide the strongest DPLs while isolated spikes can be used to confirm and refine those provided by the RVI. Coincidence of spikes of the two indicator can be considered a sign of greater strength of the DPL.
More info:
S&C magazine, April 2014.

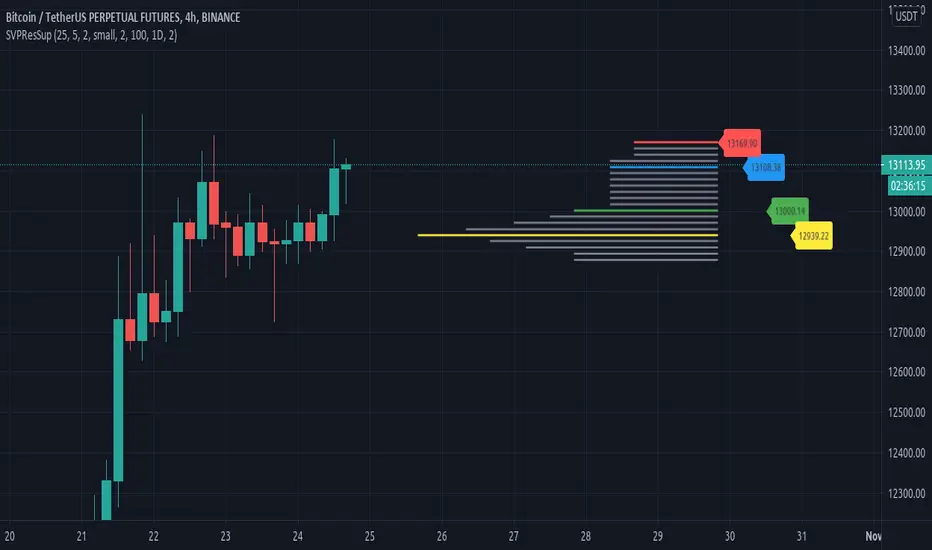
Resistances and supports based on simplified Volume ProfileThis study tries to highlight support and resistances
as they are defined by
TradingLatino TradingView user
His definition is based on volume peaks
on the official TradingView Volume Profile
indicator that seem rather big on size.
As a bonus it also serves as a rather simple volume profile indicator.
As you can see it only show last blocks volume profile.
It's aimed at BTCUSDT pair and 4h timeframe.
HOW IT WORKS
HOW IT WORKS - Recent Profile Block
It gathers volume from the last 100 Bars
in order to draw the recent profile block
Volume that intersects with current level range
being studied is added to its value.
Additionally the current level price is modified
so that it matches the level price where most
of the volume has concentrated
So you get a pretty accurate way of the volume
while at the same time the level are not stuck
to arbitrary level prices.
HOW IT WORKS - Resistances and Supports
It calculates the level which its price it's
nearer (from below) to the current price level
Resistance is found steping up (from current prive level)
level by level
till you find a level which its value
is higher than the previous level value.
Support is found steping down (from current prive level)
level by level
till you find a level which its value
is higher than the previous level value.
That way you ignore rather small
resistances and support values.
Finally the resistances and supports are drawn next to the recent profile block
so that you can look at them with ease.
If you hover over the label you can double check if you are looking at
current price, resistance or support levels.
SETTINGS
Bars in recent profile block : How many previous period volumes are used to calculate the recent profile block
Row width multiplier : Adjust how big the recent profile block seems to be
Resistances prices number of decimal digits : How many digits is shown at the resistance and support level prices.
WARNING
Please be aware that depending on your security and timeframe you might need to modify the
'Bars in recent profile block' setting so that the study does not timeout.
USAGE
If your strategy calculates take profit
limits on higher resistances based
on volume you could use this indicator
resistance detector
FEEDBACK 1
This is my first volume indicator.
I suppose that each trader
has his own approach on defining
resistances and supports.
I'm interested on knowing if the default way
this resistances and supports are calculated
matches what other traders would have
highlighted manually on the chart.
FEEDBACK 2
I have only used this identifier in BTCUSDT 4h timeframe.
I'm interested to know what needs to be tweaked
in other securities and timeframes.
PINE STUDY TRICK
This study let's you choose the number of decimals the label will use.
CREDITS
I have reused and adapted some code from
'Poor man's volume profile' study
which it's from TradingView IldarAkhmetgaleev user.
I also wanted to thank him for helping me understanding his study.
True Strong Classical Support/Resistance LevelsThis script is based on the approach of filtering signals by checking higher timeframes.
So basically setting higher numbers in "Strength Of Levels" option, will make the indicator check for support and/or resistance levels in timeframes higher than the current.
Unfortunately, I was forced to still use inefficient built-in functions pivothigh() and pivotlow(). I hope they fix them up soon!
I'm looking for any opinion about the idea and if you like any of my scripts, anything you send means a lot to me.
This script is published for the third time because of some moderators absurd behavior.
But thank heavens, the code is now more clean and of course the option "Strength Of Levels" accepts float numbers.

[PX] Session LevelHello guys,
this scripts prints the high and low as well as the moving average of a user-defined session.
How does it work?
Basically, as soon as we are in the session range, the indicator will constantly keep track of the high and the low of this range. It also prints the moving average, which can either be a floating or a static line, that represents the latest MA value.
The indicator comes with multiple options to style the printed lines.
If you find this indicator useful, please leave a "like" and hit that "follow" button :)
Have fun and happy trading :)))
P.S: Check my signature if you want to get in touch with me.

Kitsune's Long/Short Support v1.0.0After reviewing all feedback and questions I got from the users of my previously published script (Kitsune Indicator Collection), I decided to publish a new one which is easier to interpret and use. Therefore the script is as clean as possible thereby minimizing visual clutter (or at least I tried ).
This script is an evolution of my precious script and is still a combination of the following items:
- High-Low detector
- Parabolic SAR (Stop and Reversal) setups and triggers
- Ehlers Instantaneous Trendline (EIT) indicator
- Range detector
- Support and Resistance detector
- Daily/Weekly/Monthly open visualization
The script uses the SAR and EIT to detect long/short signals.
-----------------------------------------------------------------------------------------------------------------------------------------------
A signal is decided to be STRONG when SAR trigger coincides with trend reversal of the EIT.
A STRONG long signal is painted (i.e. blue label with L+) when:
- SAR long trigger (blue arrow) coincides with an EIT crossover (blue line crosses over the red line).
A STRONG short signal is painted (i.e. red label with S+) when:
- SAR short trigger (red arrow) coincides with an EIT cross-under (blue line crosses under red line).
A STRONG signal will always result in entering (if not in any position) or flipping a long/short position.
-----------------------------------------------------------------------------------------------------------------------------------------------
A signal is decided to be WEAK when not in a long or short position and a SAR trigger appears.
A WEAK long signal is painted (i.e. blue label with L-) when:
- Not in a position (gray bars) and a SAR long trigger (blue arrow) appears but not coinciding with an EIT crossover.
A WEAK short signal is painted (i.e. red label with S-) when:
- Not in a position (gray bars) and a SAR short trigger (red arrow) appears but not coinciding with an EIT cross-under.
A WEAK signal will only result in a long/short position when not in any position.
-----------------------------------------------------------------------------------------------------------------------------------------------
A long/short position is exited on a trend reversal of the EIT.
A short position is exited (i.e. red x-cross) when:
- A crossover of the EIT happens (blue line crosses over the red line).
A long position is exited (i.e. blue x-cross) when:
- A cross-under of the EIT happens (blue line crosses under the red line).
-----------------------------------------------------------------------------------------------------------------------------------------------
Color of the bars are depend on position type:
- Blue = Long position
- Red = Short position
- Gray = No position
-----------------------------------------------------------------------------------------------------------------------------------------------
Enjoy using the script. I hope it is of value to you!
If you have any questions, don't hesitate to contact me.
With kind regards,
Kitsune (L3F03X)

MM-S/R
This indicator shows long term support and resistance levels that combine monthly time frame and selected time frame. For example, If you select 4h time frame, this indicator shows supports and resistances for 4h and also 1 month time frame.
Orange dashed line : Lowest low level for selected time frame in 377 bars.
Orange line : It shows pivot low levels based on price touches for selected time frame.
Maroon line : It shows pivot low levels based on price touches for monthly time frame.
Green line : It shows pivot high levels based on price touches for selected time frame.
Aqua line : It shows pivot high levels based on price touches for monthly time frame.
Green dashed line : Highest high level for selected time frame in 377 bars.
This is just an indicator. You can use it, but it’s at your own risk.
Bu indikatör seçilen zaman dilimi ve 1 aylık periyotlar için uzun dönemli destek ve direnç seviyelerini gösterir. Örneğin, 4 saatlik zaman dilimini seçerseniz, bu indikatör size 4 saatlik zaman dilimi için oluşan destek ve dirençlerin yanı sıra 1 aylık periyotta oluşan destek ve direnç noktalarınıda gösterir.
Turuncu kesikli çizgi : Seçilen zaman dilimine göre 377 barlık en düşük seviyeyi gösterir.
Turuncu çizgi : Seçilen zaman diliminde oluşan pivot düşük noktalarını ve bu noktalara fiyat dokunuşlarını baz alarak çizilir.
Mor çizgi : 1 aylık periyotta oluşan pivot düşük noktalarını ve bu noktalara fiyat dokunuşlarını baz alarak çizilir.
Yeşil çizgi : Seçilen zaman diliminde oluşan pivot yüksek noktalarını ve bu noktalara fiyat dokunuşlarını baz alarak çizilir.
Turkuaz çizgi : 1 aylık periyotta oluşan pivot yüksek noktalarını ve bu noktalara fiyat dokunuşlarını baz alarak çizilir.
Yeşil kesikli çizgi : Seçilen zaman dilimine göre 377 barlık en yüksek seviyeyi gösterir.
Bu sadece bir indikatördür, alım satım tavsiyesi içermez. Kendi riskinizi alarak kullanabilirsiniz. Yatırım tavsiyesi değildir.

Dynamical Support and Resistance [Fournier-Eaton]The Dynamical Support and Resistance Indicator finds support and resistance levels.
The plot is price relative: if the indicator nears one of its supports or resistances then the price is likewise nearing a support.
The levels are dynamical: once a support or resistance is broken, a new calculation is performed.
There are 3 supports and 3 resistances each with a longer time-frame. Breaking through the first shouldn't signal much, breaking through the third is programmed to only happen at a significant number of standard deviations.
Enjoy. Feedback appreciated
Support Resistance - DynamicThis is Dynamic Support / Resistance script.
How it Works?
It finds Pivot Points and creates channels for each Pivot Point. Channel size is calculated by (Highest - Lowest) * %Channel_size in Loopback Period. After creating channels it calculates that how many Pivot Points in the channels. more Pivot Points in channel means stronger Support/Resistance. in the option menu there is S/R Strength, this is the minimum number of Pivot Points that each channel must contain to be S/R. calculation starts from last pivot point and go back for "loopback period" which is 300 by default. so last Pivot Points have more priority. Finally after calculating Support/Resistance it draws lines.
Number of Support/Resistance line is Dynamic and up to 20 lines, that means number of lines changes dynamically. you can see how the script puts Suppport/Resistance lines dynamically by "Replay" button. (if I have time I will try to put a video)
Currently the scripts checks up to 40 pivot points in loopback period. it shows up to 20 S/Rs only for visible area in the chart.
There is option to Show S/R lines as Solid, Dotted or Dashed.
Enjoy!

[fikira] Bollinger Bands + Higher Time FramesHere is my take on BB and MTF, based on the most excellent work of
"PineCoders" (MTF Selection Framework functions)!
The big advantage is that on 1 image you can easily see where
price is compared to 5 or less BB Bands (each of different Time Frames).
This gives a lot of Support and Resistance area's!
Includes:
- 1 Bollinger Bands (can be enabled/disabled - "Bollinger Bands"
- 4 Bollinger Bands (each can be enabled/disabled - "HTF Selection 1-4")
Each BB has its colour (can be changed)
- Labels (Timeframe and price) can be enabled/disabled
- Labels position and size can be changed
...

Liens Support & Resistances + Trend following v2
1. Previous daily Support and resistance levels ( Not showing on chart - Needs to be used on lower tf )
2. Previous Weekly Support and resistance levels
Blue circles = Weekly Support
Yellow circles = Weekly resistance
This setting is currently set to "0 days" so when you open the script it wont show.
On chart previous weekly is set to "10 weeks"
3. Auto Support and resistance levels targeting Highs and lows(wicks).
Auto color change
Support = always green
resistance = always red.
4. Trendfollowing Using the 20 ema
Bars change color when price is over/under ema.

Liens Support and resistance + trend following1. Two different support and resistance levels. One that focuses on price action and one for wicks. (Wicks needs to be turned on)
3. 20 ema trendfollowing. Bars change color. when price is over/under ema.
4. Bar color levels also work with rsi levels. Currently set to 0-100. If you only want bars to change color when the rsi is overbough/oversold. simply just change the levels to 70-30 or whatever you like :)
