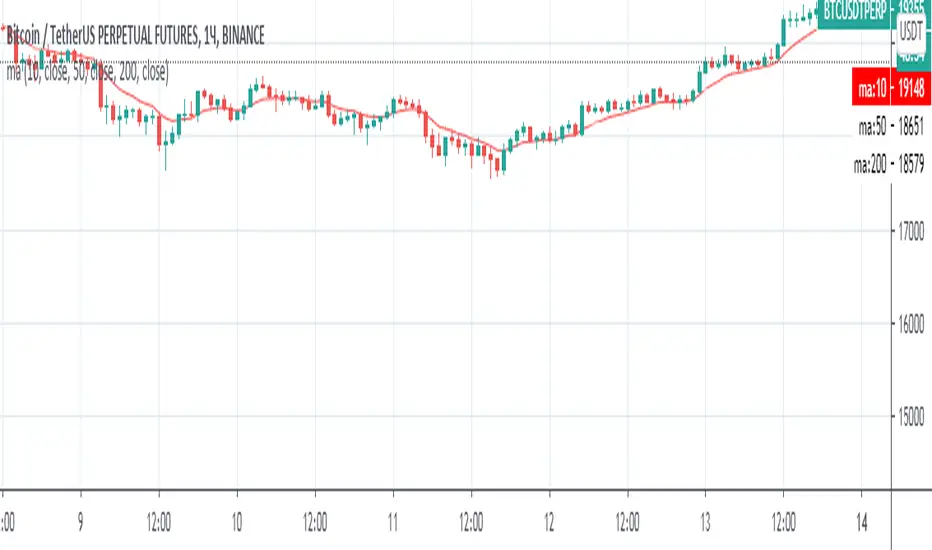
[VIP] Multi Timeframe Pivot Support Resistance (MTPSR)MTPSR provides 6 boards to watch pivots, supports, and resistances in cross timeframes. By default, timeframes are 15m, 30m, 1hr, 2hr, 4hr, and 1D with the current ticker, but they are changeable on indicator setting.
The Pivot, Support, and Resistances have 2 algorithms; Fibonacci or Classic. Default is Classic, but you can change on indicator setting.
MTPSR has 2 additional boards with BitMex Long and Short Liquidation algorithm, this logic can be used for any ticker especially if you want to have tight control with margin liquidation.
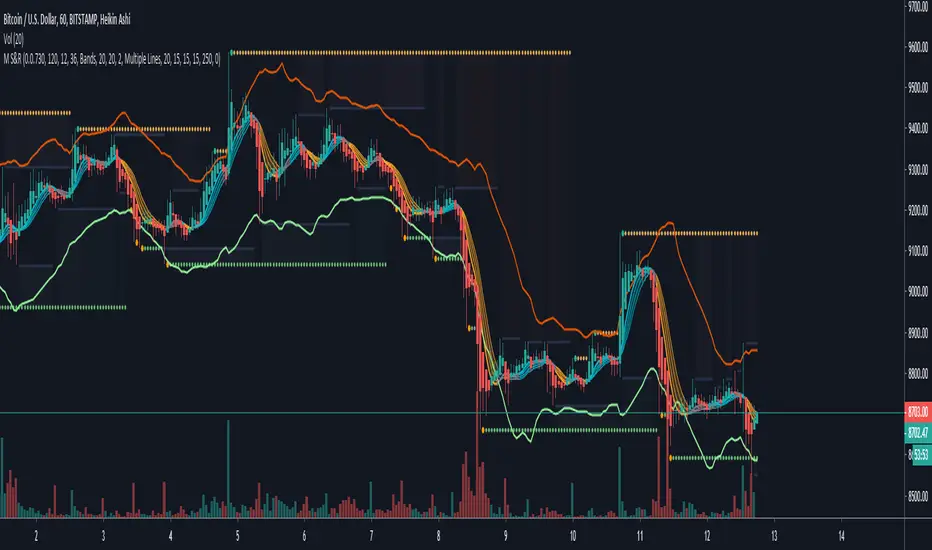
MTPSR provides KDJ charts in cross timeframes with the last 3 candles for every board. The default does not appear, but you can enable it on indicator setting. If Greenline crossover Redline, that is a good position to the long or indicating uptrend. But if Greenline crossunder Redline, that is good position to the short or indicating downtrend.
MTPSR has DI/ADX for every board, DI is a difference between DI+ and DI-, if the value is negative means downtrend, if the value is positive means uptrend.
HOW TO USE
Long Trading
The Support will be a good position to entry
The Resistance will be a good position to take profit
If in lower time frames, the candle keeps cross over the resistances, that means uptrend rally is happening.
Short Trading
The Support will be a good position to take profit
The Resistance will be a good position to entry
If in lower time frames, the candle keeps cross over the resistances, that means uptrend rally is happening, it is not good for short
Scalping Advice
If you scalp in day trading, it is recommended to watch Pivot/Support/Resistance on Timeframes 1D, 4D, and 1W
If the chart is sideways on the 1D pivot and the direction from support to pivot, that means the market wants to have a correction to closer support
If the chart is sideways on the 1D pivot and the direction from resistance to pivot, that means the market wants to have retest to closer resistance before another drop or breakout to continue the rally
Use can scalp on TF 15m or TF30m, the Pivot/Support/Resistance in lower timeframes can be so dynamic, so you have to pay more attention on trading strategy, you can use 2H and 4H Pivot/Support/Resistance as the target
You can also use Liquidation Long/Short boards for scalping trading strategy to take profit or cut lost
ALERTS
Every pivot board has alert which condition: if candle cross over or under support, resistance or pivot even KDJ cross over or under
Every liquidation board has alert which condition: if candle cross over or under every margin level
Example alert title for every board when candle cross over: Over Support TF 1, Over Resistance TF 1, Over Pivot TF 1, KDJ Up TF1
Example alert title for every board when candle cross under: Under Support TF 1, Under Resistance TF 1, Under Pivot TF 1, KDJ Down TF1
Feedback
Please drop a comment or send a direct message for any bugs or request new feature
I dont sell source codes, please not DM me about it
Resistence

N.White_For_H4_TESTI use this Test version to determine price movement for a longer period, in the next versions Long / short signals will be added. Includes drawing support and resistance lines, Bollinger bands.
Pivot Points Daily and WeeklyThis will let trader see Daily and Weekly Pivot points with R/S5.
Daily Pivot point line --> Orange Color
Daily R1-5 ---> Black circles
Daily S1-5 ---> Black circles
Weekly Pivot lines ---> Purple Color
Weekly R1-5 ---> Red Circles
Weekly S1-5 ---> Red Circles

bg_FibCastVersion 1.0
A simple script to place horizontal lines where fib levels are, over a given period of candles, on a specified or charted time-frame. Includes the option to fib-retrace a "sub-zone" or the space between Fibonacci levels.
In The Depicted Example Above:
- Large white Fibonacci Lines from 377 Daily Candle Range, Gray "Sub-Fib" levels are plotted in "Zone 4" of the 377 1D Fib. Re-trace. (Zone 4 is between the 0.5 and 0.618, Zone 3 is between 0.618 and 0.786, etc.)
- Optional 1.618 Fib Extension is available for the main Fibonacci indicator, but is not shown here (Disabled/Hidden).
- Supports multiple time-frames, which is also depicted above. (377 Daily Candles used on 12-Hour chart.)

Fibonacci BandsFibonacci Bands are derived from Fibonacci ratios expansion from a fixed moving average.
These bands help traders find key areas of support and resistance . "Fibonacci bands" are
computed by adding a Fibonacci ratio distance (Up and Down) from a "key moving" average
(21, 34, 89 periods). An 8 period average of "True range" is computed. The multiples of
Fibonacci ratios of this range are added to the fixed moving average to compute Fibonacci
Bands
One of the best ways to find trend reversals is to watch the price action near the extreme bands
(both lower and higher). Markets tend to reverse when prices trade outside of the band for a
few bars and again trade inside the bands. After reversals, markets also tend to trade from one
extreme band to the other end (opposite) of the extreme bands.

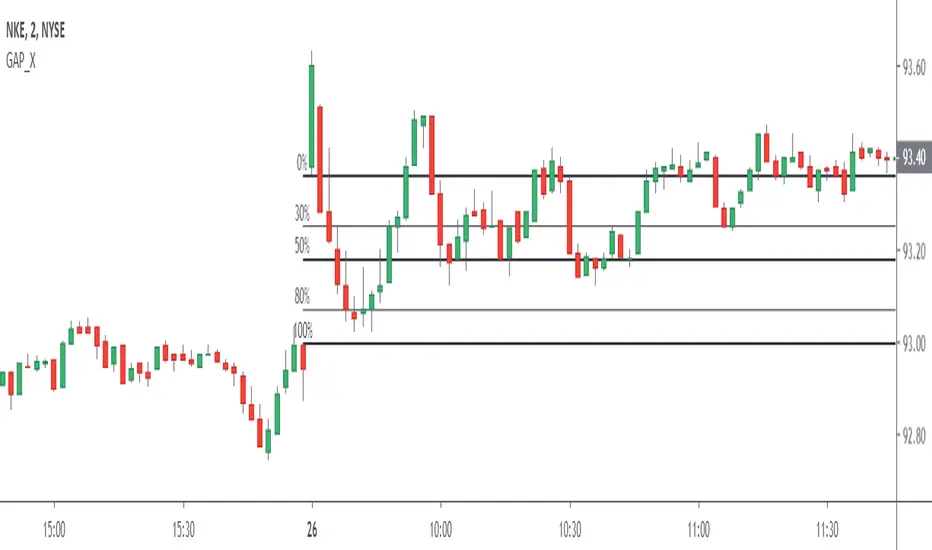
Gap Automatic Retrocess LevelsThis Script detects Bearish / Bullish GAP at market opening 09:30 am NY and automatically traces backward levels, of which 2 are configurable at your discretion.
Pivots With CPR,Moving Average and VWAP - by AnanthThis indicator is a combination of Pivot points with CPR, Moving Average and VWAP.

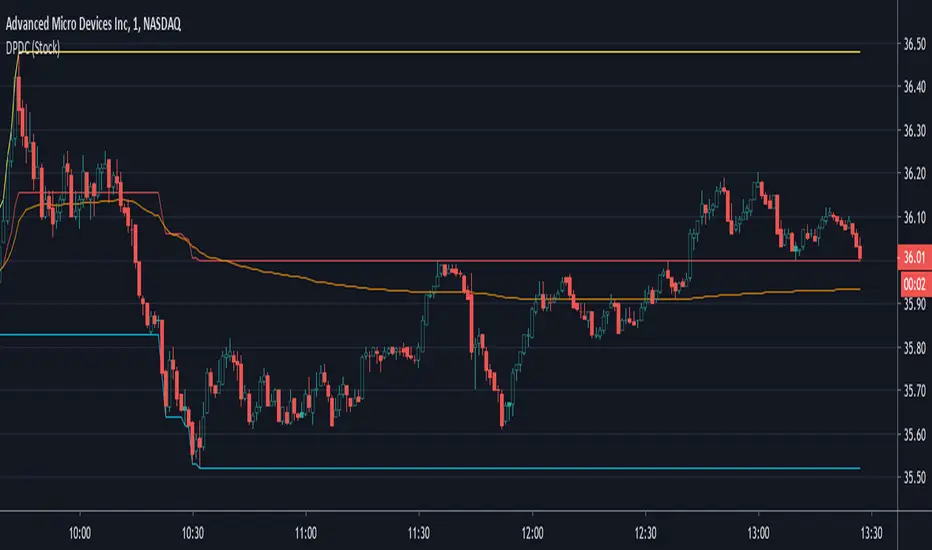
Daily Progressive Donchian ChannelsThis is the first script that I publish.
His main goal is to help identify the extreme of the day and to compare the VWAP with the average DPDC to find meaningful resistance and support.
Swing Trade Pros - Support/Resistance LevelsThe STP Support/Resistance Levels accurately detect the key levels by identifying large swings/pivots in historical price action automatically. It identifies price levels where historically the price reacted by either bouncing or reversing the direction. Prior price behavior at these levels can leave clues for future price behavior. These tops and bottoms in price action show where lots of buyers or sellers came into the market and might act as future levels of support or resistance. By default, the code detects the last 3 significant swing highs and the last 3 swing lows. When price action breaks above the resistance line the color changes to green because it's now support. Likewise, when the price action breaks below the support line the color changes to red because it's now resistance.
Opening Range Breakout- ORB Large Price Targets
During this period, you want to identify the high and low of the day. In addition, you will also want to account for the pre-market highs and lows, as these levels will often act like a magnet on price action after the bell rings.
Since the opening bell is associated with big trading volumes and volatility , this time of the session provides many trading opportunities. In this manner, traders use the opening range to set entry points on the chart and to forecast the price action for the day.
Add on to the ORB Script for Higher Price Targets 700% to 1061%

Opening Range Breakout- ORB Higher Price Targets
The opening range is simply the high and low of a given period after the market opens. This period is generally the first 30 minutes or the first hour of trading.
During this period, you want to identify the high and low of the day. In addition, you will also want to account for the pre-market highs and lows, as these levels will often act like a magnet on price action after the bell rings.
Since the opening bell is associated with big trading volumes and volatility , this time of the session provides many trading opportunities. In this manner, traders use the opening range to set entry points on the chart and to forecast the price action for the day.
Add on to the ORB Script for Higher Price Targets 300% to 661%


Pivot Points QuarterlyQuarterly only
What is a Pivot Point?
A pivot point is a technical analysis indicator, or calculations, used to determine the overall trend of the market over different time frames. The pivot point itself is simply the average of the high, low and closing prices from the previous trading day. On the subsequent day, trading above the pivot point is thought to indicate ongoing bullish sentiment, while trading below the pivot point indicates bearish sentiment.
The pivot point is the basis for the indicator, but it also includes other support and resistance levels that are projected based on the pivot point calculation. All these levels help traders see where the price could experience support or resistance. Similarly, if the price moves through these levels it lets the trader know the price is trending in that direction.
When the price of an asset is trading above the pivot point , it indicates the day is bullish or positive.
When the price of an asset is trading below the pivot point , it indicates the day is bearish or negative.
The indicator typically includes four additional levels: S1, S2, R1, and R2. These stand for support one and two, and resistance one and two.
Support and resistance one and two may cause reversals, but they may also be used to confirm the trend. For example, if the price is falling and moves below S1, it helps confirm the downtrend and indicate a possible continuation to S2.
This Script includes the Mid Pivot Points , Open and Close levels

SWING POINTS HOUNDTry's to find possible swing points and reversal points using mutli time frame moving averages and Fibonacci retracement with multiple lengths. Can be used to gauge trends and find potential entry points for trend following strategies. Can also be used to find potential price reversal points and areas of heavy resistance/support.

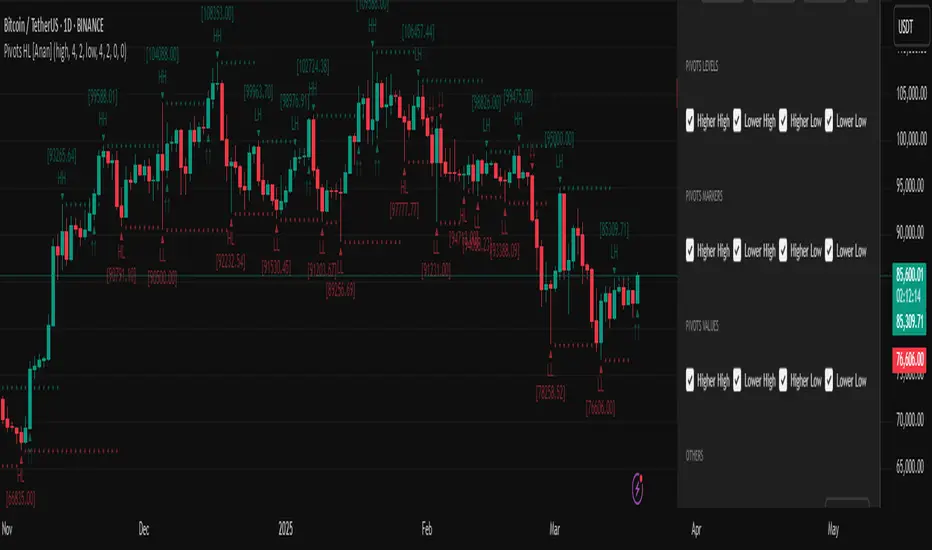
Pivot Points High Low (HH/HL/LH/LL) [Anan]Hello Friends,
This is my own version of ( Pivot Hilo Support n Resistance Levels R3-3 by JustUncleL )
- V4 Pinescript
- Removed MA dependency filters
- Add some arrows
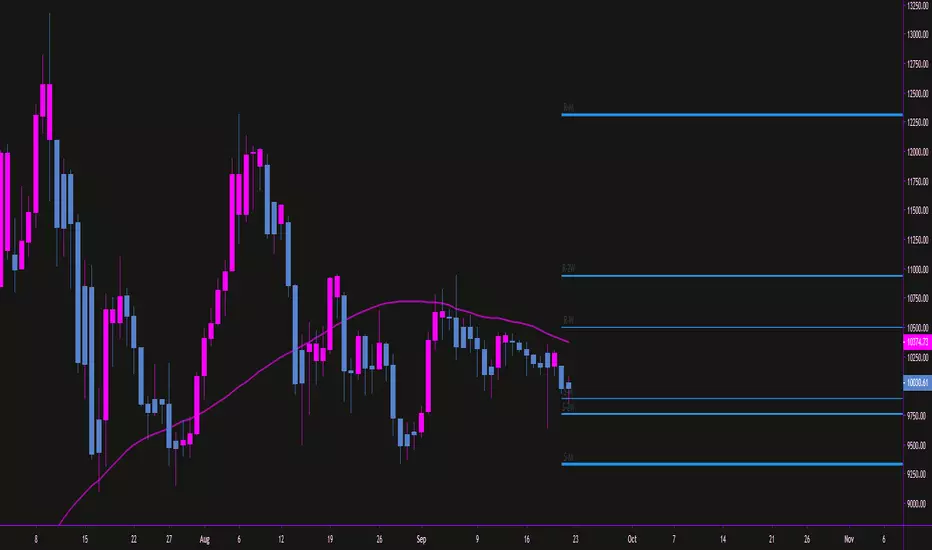
Auto Fibonacci Retracement Levels A Fibonacci retracement is a popular tool that traders can use to identify support and resistance levels, and place stop-loss orders or target prices.
The indicator connects any two points that are relevant, a high and low point.
The percentage levels provided are areas where the price could stall or reverse.
Levels should not be relied on exclusively. For example, it is dangerous to assume the price will reverse after hitting a specific Fibonacci level. It may, but it also may not.
Fibonacci retracement levels are most frequently used to provide potential areas of interest. If a trader wants to buy, they watch for the price to stall at a Fibonacci level and then bounce off that level before buying.
The most commonly used ratios include 23.6%, 38.2%, 50%, 61.8% and 78.6%. These represent how much of a prior move the price has corrected or retraced.

Custom Timeframe FibsThis is a testing project for fib levels to try out fivs on multi timeframes
Thank you ShoujiSuzuki

[PX] MTF Fractal Level This script identifies multi-timeframe fractal level, which can be used as support and resistance.
If you are looking for someone to develop your own indicator or trading strategy, don't hesitate to get in touch with me here on TradingView or below.
Contact:
www.pascal-simon.de
info@pascal-simon.de

[PX] Level & TrendlinesThe indicator identifies the intermediate fractal pattern, where neighboring fractals are either higher or lower. It plots horizontal level and trendlines based on those fractals and comes with a variety of settings.
If you are looking for someone to develop your on indicator or trading strategy, don't hesitate to get in touch with me here on TradingView or below.
Contact:
www.pascal-simon.de
info@pascal-simon.de

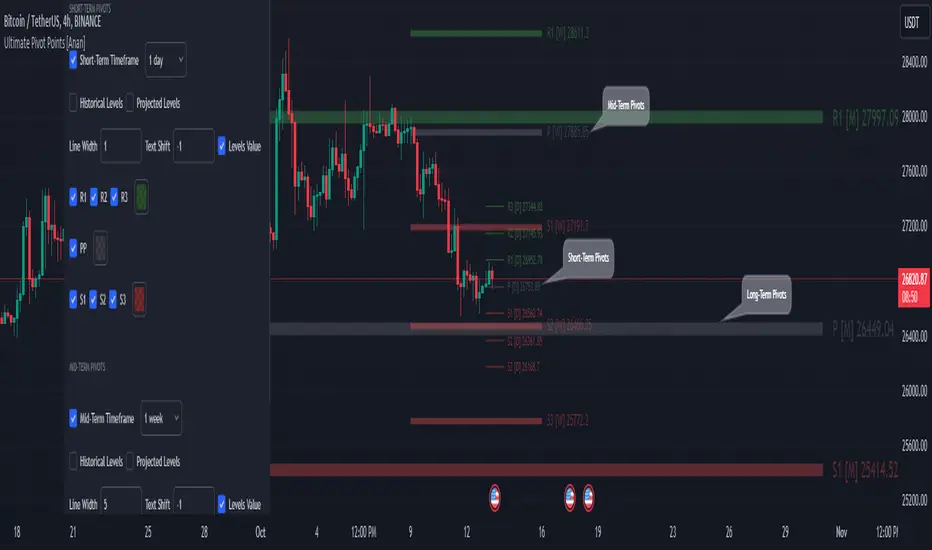
Ultimate Pivot Points [MTF/3in1/4Types/Projection/Alerts]-[Anan]Ultimate Pivot Points !
- V4 Pinescript.
- 4 Types of Pivot Points (Traditional , Fibonacci , Woodie , Camarilla ).
- Multi-time Frame: you can select Pivots Timeframe (1m, 3m ,5m,15m,30m,45m,1h,2h,3h,4h,1D,1W,1M).
- Three Pivot Points in one chart, I called them and they all have option to show or hide.
- Unlimited Number Of Pivots Back for all periods.
- Projection Pivot Points Levels.
- Each Pivot line have a label and value with period .
- Control with Line Width.
- Control with labels location with Text Shift Factor.
- Separate alerts for every Pivot Points levels.
Thanks QuantNomad for the inspiration.
Support/Resistance (Rupprecht)Set the maximum data points to look back for a support resistance line, then set the pivot point threshold and your off to the races.
Very effective solution to have your support resistance points automatically show up on your chart. A good tip is to include 2 or 3 of this indicator on your chart with varying levels of degree for support and resistance categorized by color.
Best of luck :)
