Reversal Signal by Vahid.jafarzadehReversal Signal by Vahid.j is a technical analysis tool designed to identify potential market turning points using a combination of Donchian channels, Fibonacci levels, and multi-oscillator divergences. This indicator calculates dynamic support and resistance levels based on recent highs and lows, applies key Fibonacci retracement zones, and evaluates divergences across multiple oscillators including RSI, MACD, Momentum, CCI, OBV, Stochastic, DI Oscillator, VWMA, CMF, and MFI.
Signals are displayed as bull 🐂 and bear 🐻 icons on the chart to indicate potential buy and sell zones. The indicator also tracks the cumulative divergence count, offering a quantitative perspective of market strength and trend reversal probability.
Alerts can be set for both bullish and bearish signals, enabling timely entries and exits based on divergence and Donchian-Fibonacci confluence.
-------
فارسی :
سیگنال بازگشت توسط Vahid.j یک ابزار تحلیل تکنیکال است که برای شناسایی نقاط احتمالی تغییر جهت بازار طراحی شده و از ترکیبی از کانالهای دونچیان، سطوح فیبوناچی و واگرایی چند نوسانگر استفاده میکند. این اندیکاتور سطوح حمایت و مقاومت پویا را بر اساس بالاترین و پایینترین قیمتهای اخیر محاسبه کرده، سطوح کلیدی فیبوناچی را اعمال میکند و واگراییها را در چندین نوسانگر شامل RSI، MACD، مومنتوم، CCI، OBV، استوکاستیک، DI اسیلاتور، VWMA، CMF و MFI ارزیابی میکند.
سیگنالها به صورت آیکون گاو 🐂 و خرس 🐻 روی چارت نمایش داده میشوند تا مناطق خرید و فروش احتمالی را نشان دهند. همچنین این اندیکاتور تعداد واگراییهای تجمعی را ردیابی میکند و دید کمی نسبت به قدرت بازار و احتمال بازگشت روند ارائه میدهد.
امکان فعالسازی آلارم برای سیگنالهای صعودی و نزولی وجود دارد تا بر اساس همگرایی واگرایی و سطوح دونچیان-فیبوناچی، ورود و خروجهای به موقع انجام شود
Rsi_divergence

VCAI RSI Divergence +VCAI RSI Divergence+ is an RSI that shows trend, momentum, and divergence using V-CoresAI colour logic instead of a single white line.
What it shows:
Yellow RSI line → bullish momentum (RSI above its MA; buy-side pressure in control)
Purple RSI line → bearish momentum (RSI below its MA; sell-side pressure in control)
Thin blue line → fast RSI moving average that drives the colour flips
Dashed 70/30 lines → classic OB/OS zones
Background bands → soft purple in OB, soft yellow in OS to mark exhaustion areas
How to read it:
Yellow & rising → momentum shifting bullish; pullbacks into yellow OS band can be accumulation zones
Purple & falling → momentum shifting bearish; pushes into purple OB band can be distribution/sell zones
Hard colour flips (yellow ↔ purple) mark trend regime changes, not minor RSI noise
Divergence mode (on/off)
The divergence engine scans RSI and price pivot structure:
Bullish divergence (yellow) → price lower low + RSI higher low
Bearish divergence (purple) → price higher high + RSI lower high
Lines and tags appear only where a meaningful disagreement between price and RSI exists, giving early context for potential reversals or fade setups.
Together, the momentum colours + optional divergence mapping give a far clearer market read than a standard RSI, with zero clutter and no guesswork.

RSI Multi Levels kiawosch [TradingFinder] 7-14-42 Consolidation🔵 Introduction
The Relative Strength Index or RSI is a tool used to measure the speed and intensity of price movement, oscillating between zero and one hundred. It is commonly applied to identify strength or weakness in market momentum across different time intervals. Despite its simple formula and wide usage, the behavior of RSI within specific ranges often provides more precise information than traditional overbought and oversold levels.
The Multi RSI layout displays three RSI values with periods 7, 14 and 42. The seven period RSI plays the primary role in short term analysis. When this value enters predefined ranges, it shows highly consistent and interpretable behavior that can signal trend continuation, corrections or the start of a range structure. The other two values, RSI 14 and RSI 42, help reveal higher timeframe momentum and provide context for the depth and quality of price movement.
Three potential zones are defined, each representing a behavioral range. The position zones forms the basis for signal interpretation :
High Potential : 78 to 85 & 22 to 15
Mid Potential : 70 to 78 & 30 to 22
Low Potential : 58 to 62 & 42 to 38
These zones highlight areas where RSI reacts in specific ways to price movement. Entering the High Potential range usually aligns with new highs or lows in price and often precedes continuation after a correction. In contrast, reactions inside the Mid Potential range frequently appear during clean ranges or channel structures. This approach focuses on momentum quality and structural behavior rather than classic overbought and oversold thresholds.
In summary, the logic behind the signals follows three principles :
Trend continuation, When RSI 7 enters the High Potential zone and price prints a new high or low, continuation after a correction becomes the most likely outcome.
Reversal or slowdown, When RSI exits the High Potential zone while price is reaching a previous high or low, the probability of a short term reversal increases.
Range behavior, In clean ranges or channel structures, RSI 7 typically reacts inside the Mid Potential zone and produces consistent swing responses.
🔵 How to Use
This method is based on observing the repeating behavior of RSI within momentum zones and identifying moments when price continues after a shallow correction or, conversely, when signs of slowing and reversal appear. RSI 7 plays the main role since it gives the most sensitive response to short term price changes. Its entry into or exit from a potential zone, combined with the position of price relative to recent highs and lows, forms the core of the signal logic. RSI 14 and RSI 42 provide higher timeframe confirmation and help evaluate the broader strength or weakness behind each movement.
🟣 Trend continuation after entering the High Potential zone
When RSI 7 reaches the High Potential zone while price forms a new high or low, the probability of continuation becomes very high. The typical sequence includes a short correction in price and a retreat of RSI toward the Mid Potential zone. As long as price structure remains intact and RSI turns upward again, continuation becomes the most likely scenario. As shown in the charts, price often expands strongly after this type of correction and breaks the previous high.
🟣 Reversal or slowdown after exiting the High Potential zone
If RSI 7 enters the High Potential zone but then exits while price is interacting with a previous high or low, conditions for a short term reversal appear. This behavior is clear in the charts, where price hits a supply or demand area and RSI can no longer return to the upper zone. The drop in RSI reflects weakening momentum and, when accompanied by a confirming candle, increases the chance of a reversal or at least a temporary pause.
🟣 Strong reversal after hitting the Mid Potential zone during deeper corrections
Sometimes price enters a deeper corrective phase and RSI 7 moves into or through the Mid Potential zone. When this occurs near a previous low, it can mark the start of a significant reversal. The charts show this pattern clearly, where RSI turns upward while price reacts to support. If the other RSI values show relative alignment, the probability of a strong rebound increases. This signal is often seen after fast declines and can mark the beginning of a recovery wave.
🟣 Range structure and repetitive reactions inside the Mid Potential zone
When price enters a clean range or channel, the behavior of RSI 7 changes completely. In such conditions, RSI repeatedly reacts inside the Mid Potential zone. Each time price touches the upper or lower boundary of the range, RSI approaches the upper or lower part of this zone as well. The result is a sequence of predictable swing reactions, perfectly suitable for mean reversion strategies. Breakouts in these environments also tend to show higher failure rates.
🟣 Sharp reactions and fast reversals at extreme levels (RSI near 90 or below 10)
Although this approach is not based on classic overbought and oversold logic, extremely high or low RSI readings such as ninety often produce strong immediate reactions in price. These conditions usually occur after sudden spikes or emotional breakouts. As visible in the charts, RSI collapses quickly after reaching such extremes and price often reverses sharply. While not a core signal, these moments add meaningful context to momentum interpretation.
🔵 Settings
RSI Setting : This section allows enabling or disabling the three RSI values, adjusting their calculation length and customizing their colors. It is designed to help separate short, medium and longer term momentum visually on the chart.
Zones Setting : This section controls the display of momentum zones and the color applied to each area. Adjusting these colors or toggling them on and off helps the trader visually track the intensity and structure of momentum.
Levels Setting : This section allows editing the numeric boundaries of the levels or showing and hiding each one individually. These levels form the visual framework for interpreting RSI behavior within the defined momentum zones.
🔵 Conclusion
Examining RSI behavior across different momentum zones shows that entering these ranges creates relatively consistent patterns in price movement. Reaching the High Potential zone often corresponds to later stages of a trend, where price has the strength to continue after a brief correction and structure remains intact. In contrast, reactions within the Mid Potential zone occur more frequently when the market transitions into a range or a limited movement phase, where repetitive oscillations dominate.
Overall, observing RSI inside these zones helps distinguish between trending movement, corrective phases and range conditions with greater clarity. Entry or exit from each zone provides insight into the underlying strength or weakness of momentum and reveals where the market is positioned within its movement cycle. This perspective, based on momentum regions rather than traditional values alone, offers a more refined understanding of price behavior and highlights the likely direction of the next move.

FluxPulse Momentum [JOAT]FluxPulse Momentum - Adaptive Multi-Component Oscillator
FluxPulse Momentum is a composite oscillator that blends three distinct momentum components into a single, smoothed signal line. Rather than relying on a single indicator, it synthesizes adaptive RSI, normalized rate of change, and a Kaufman-style efficiency ratio to provide a multi-dimensional view of momentum.
What This Indicator Does
Combines RSI, Rate of Change (ROC), and Efficiency Ratio into one weighted composite
Applies EMA smoothing to reduce noise while preserving responsiveness
Displays overbought/oversold zones with optional background highlighting
Generates buy/sell signals when the oscillator crosses its signal line in favorable zones
Provides a real-time dashboard showing current state, momentum direction, and efficiency
Core Components
Adaptive RSI (50% weight) — Standard RSI calculation normalized around the 50 level
Normalized ROC (30% weight) — Rate of change scaled relative to its recent maximum range
Efficiency Ratio (20% weight) — Measures directional movement efficiency, inspired by Kaufman's adaptive concepts
The final composite is smoothed twice using EMA to create both a fast line and a signal line.
Signal Logic
// Buy signal: crossover in lower half
buySignal = ta.crossover(qmo, qmoSmooth) and qmo < 50
// Sell signal: crossunder in upper half
sellSignal = ta.crossunder(qmo, qmoSmooth) and qmo > 50
Signals are generated only when the oscillator is positioned favorably—buy signals occur below the 50 midline, sell signals occur above it.
Dashboard Information
The on-chart table displays:
Current oscillator value with gradient coloring
Momentum state (Overbought, Oversold, Bullish, Bearish, Neutral)
Momentum direction and acceleration
Efficiency ratio percentage
Active signal status
Inputs Overview
RSI Length — Period for RSI calculation (default: 14)
ROC Length — Period for rate of change (default: 10)
Smoothing Length — EMA smoothing period (default: 3)
Overbought/Oversold Levels — Threshold levels for zone detection
Await Bar Confirmation — Wait for bar close before triggering alerts
How to Use It
Watch for crossovers between the main line and signal line
Use overbought/oversold zones to identify potential reversal areas
Monitor the histogram for momentum acceleration or deceleration
Combine with price action analysis for confirmation
Alerts
Buy Signal — Bullish crossover in the lower zone
Sell Signal — Bearish crossunder in the upper zone
Overbought/Oversold Crosses — Level threshold crossings
This indicator is provided for educational purposes. It does not constitute financial advice. Always conduct your own analysis before making trading decisions.
— Made with passion by officialjackofalltrades

Fibonacci Vision ProFibonacci Precision Signals Pro | Smart Buy & Sell Alerts
━━━━━━━━━━━━━━━━━━━━━━━━━━━━━━━━━━━━━━━━━━━━━━━━━━━━
OVERVIEW
This indicator combines Fibonacci mathematics with advanced signal filtering to deliver precise buy and sell signals. It automatically detects swing structure, calculates the key 0.618 retracement level, and generates signals only when multiple confirmation factors align.
Clean. Accurate. Professional.
━━━━━━━━━━━━━━━━━━━━━━━━━━━━━━━━━━━━━━━━━━━━━━━━━━━━
HOW IT WORKS
The script identifies swing highs and lows, then calculates Fibonacci retracement levels automatically. When price interacts with the 0.618 zone and all filters confirm, a signal appears:
▲ buy — Long entry opportunity
▼ sell — Short entry opportunity
━━━━━━━━━━━━━━━━━━━━━━━━━━━━━━━━━━━━━━━━━━━━━━━━━━━━
6-LAYER CONFIRMATION SYSTEM
Every signal must pass through:
Trend Direction Analysis
Fibonacci Level Interaction
EMA Trend Filter (50-period default)
RSI Momentum Validation (14-period default)
Volume Spike Detection
Candlestick Pattern Recognition (Pin bars, Engulfing, Momentum candles)
This multi-layer approach significantly reduces false signals.
━━━━━━━━━━━━━━━━━━━━━━━━━━━━━━━━━━━━━━━━━━━━━━━━━━━━
BUILT-IN RISK MANAGEMENT
Every trade includes automatic stop loss and take profit levels:
Stop Loss: 100 pips
Take Profit: 200 pips
Risk-Reward Ratio: 1:2
Adjust these values in settings to match your trading style.
━━━━━━━━━━━━━━━━━━━━━━━━━━━━━━━━━━━━━━━━━━━━━━━━━━━━
KEY FEATURES
✅ Automatic Fibonacci calculation — no manual drawing
✅ Multi-timeframe compatibility — M15 to Daily
✅ Universal market support — Forex, Crypto, Stocks, Indices
✅ Clean minimalist signals — white triangles with text
✅ Customizable filters — adjust sensitivity to your preference
✅ Built-in alerts — never miss a signal
✅ No repainting — signals remain fixed once confirmed
━━━━━━━━━━━━━━━━━━━━━━━━━━━━━━━━━━━━━━━━━━━━━━━━━━━━
Swing Detection:
Swing Length — Controls sensitivity to market structure (default: 10)
Confirmation Bars — Bars required to confirm signal (default: 1)
Signal Filters:
EMA Trend Filter — Toggle trend confirmation on/off
EMA Length — Adjust trend filter period (default: 50)
RSI Filter — Toggle momentum confirmation on/off
RSI Length — Adjust momentum period (default: 14)
Volume Filter — Toggle volume confirmation on/off
Volume Multiplier — Set volume threshold (default: 1.2x average)
Risk Management:
Stop Loss Pips — Set your stop loss distance (default: 100)
Take Profit Pips — Set your profit target (default: 200)
Pip Value — Adjust for your instrument (0.0001 for most Forex, 0.01 for JPY pairs)
Visuals:
Show Signals — Toggle signal visibility
Show Cloud — Toggle Fibonacci zone visibility
━━━━━━━━━━━━━━━━━━━━━━━━━━━━━━━━━━━━━━━━━━━━━━━━━━━━
BEST PRACTICES
Use on H1 or H4 timeframes for optimal results
Trade in direction of the higher timeframe trend
Avoid trading during major news events
Combine with proper position sizing
Always use the built-in stop loss
Be patient — quality signals over quantity
━━━━━━━━━━━━━━━━━━━━━━━━━━━━━━━━━━━━━━━━━━━━━━━━━━━━
MARKETS SUPPORTED
Forex — All major, minor, and exotic pairs
Crypto — BTC, ETH, and altcoins
Stocks — Any equity on TradingView
Indices — S&P500, NASDAQ, DAX, FTSE, etc.
Commodities — Gold, Silver, Oil, etc.
━━━━━━━━━━━━━━━━━━━━━━━━━━━━━━━━━━━━━━━━━━━━━━━━━━━━
WHY FIBONACCI?
The 0.618 ratio (Golden Ratio) is observed by traders worldwide. When price retraces to this level, it often:
Reverses direction
Finds support or resistance
Creates high-probability entry opportunities
This script automates the detection of these key moments.
━━━━━━━━━━━━━━━━━━━━━━━━━━━━━━━━━━━━━━━━━━━━━━━━━━━━
ALERTS INCLUDED
Set up notifications to receive signals on:
Mobile push notifications
Desktop popups
Email alerts
Webhook integrations
Never miss a trading opportunity again.
━━━━━━━━━━━━━━━━━━━━━━━━━━━━━━━━━━━━━━━━━━━━━━━━━━━━
WHAT MAKES THIS DIFFERENT
Most indicators give too many signals. This one focuses on quality.
Most indicators clutter your chart. This one keeps it clean.
Most indicators ignore risk management. This one includes it.
Most indicators work on one market. This one works on all.
━━━━━━━━━━━━━━━━━━━━━━━━━━━━━━━━━━━━━━━━━━━━━━━━━━━━
DISCLAIMER
This indicator is a trading tool, not financial advice. Trading involves substantial risk of loss. Past performance does not guarantee future results. Always use proper risk management and never trade with money you cannot afford to lose. Test on a demo account before trading live.

AMORY Dashboard VIPAmory VIP Dashboard: Indicators visually display Trend (EMA), RSI, ADX, ATR, Volume and buy/sell signals right on the chart. Current volume is 100% accurate, STRONG/BUY/SELL classified signals, easy-to-read right-hand corner dashboard with distinguishing colors, updated according to the last candle.

RSI_RDRSI_RD - RSI Divergence Detector (Ryan DeBraal)
This script plots a standard RSI along with advanced automatic divergence detection.
It identifies four types of divergences using pivot logic and configurable
lookback windows. Signals appear directly on the RSI line as plotted marks and labels.
FEATURES
- Standard RSI with user-defined length and source.
- Midline (50), overbought (70), and oversold (30) levels with shaded background.
- Automatic detection of:
• Regular Bullish Divergence
• Regular Bearish Divergence
• Hidden Bullish Divergence
• Hidden Bearish Divergence
- Each divergence type can be toggled on/off individually.
- Pivot-based detection using left/right lookback lengths.
- Range filter (bars since pivot) to avoid stale or invalid divergences.
- Colored markers and labels placed exactly on pivot points.
- Alerts for all four divergence conditions.
PURPOSE
This indicator makes RSI divergence trading systematic and visual.
It highlights when price action disagrees with RSI momentum — often signaling
exhaustion, reversal setups, or continuation opportunities depending on the divergence type.
Ideal for combining with trend filters, VWAP, or ORB structures.

The Oracle: Dip & Top Adaptive Sniper [Hakan Yorganci]█ OVERVIEW
The Oracle: Dip & Top Adaptive Sniper is a precision-focused trend trading strategy designed to solve the biggest problem in swing trading: Timing.
Most trend-following strategies chase price ("FOMO"), buying when the asset is already overextended. The Oracle takes a different approach. It adopts a "Sniper" mentality: it identifies a strong macro trend but patiently waits for a Mean Reversion (pullback) to execute an entry at a discounted price.
By combining the structural strength of Moving Averages (SMA 50/200) with the momentum precision of RSI and the volatility filtering of ADX, this script filters out noise and targets high-probability setups.
█ HOW IT WORKS
This strategy operates on a strictly algorithmic protocol known as "The Yorganci Protocol," which involves three distinct phases: Filter, Target, and Execute.
1. The Macro Filter (Trend Identification)
* SMA 200 Rule: By default, the strategy only scans for buy signals when the price is trading above the 200-period Simple Moving Average. This ensures we are always trading in the direction of the long-term bull market.
* Adaptive Switch: A new feature allows users to toggle the Only Buy Above SMA 200? filter OFF. This enables the strategy to hunt for oversold bounces (dead cat bounces) even during bearish or neutral market structures.
2. The Volatility Filter (ADX Integration)
* Sideways Protection: One of the main weaknesses of moving average strategies is "whipsaw" losses during choppy, ranging markets.
* Solution: The Oracle utilizes the ADX (Average Directional Index). It will BLOCK any trade entry if the ADX is below the threshold (Default: 20). This ensures capital is only deployed when a genuine trend is present.
3. The Sniper Entry (Buying the Dip)
* Instead of buying on breakout strength (e.g., RSI > 60), The Oracle waits for the RSI Moving Average to dip into the "Value Zone" (Default: 45) and cross back up. This technique allows for tighter stops and higher Risk/Reward ratios compared to traditional breakout systems.
█ EXIT STRATEGY
The Oracle employs a dynamic dual-exit mechanism to maximize gains and protect capital:
* Take Profit (The Peak): The strategy monitors RSI heat. When the RSI Moving Average breaches the Overbought Threshold (Default: 75), it signals a "Take Profit", securing gains near the local top before a potential reversal.
* Stop Loss (Trend Invalidated): If the market structure fails and the price closes below the 50-period SMA, the position is immediately closed to prevent deep drawdowns.
█ SETTINGS & CONFIGURATION
* Moving Averages: Fully customizable lengths for Support (SMA 50) and Trend (SMA 200).
* Trend Filter: Checkbox to enable/disable the "Bull Market Only" rule.
* RSI Thresholds:
* Sniper Buy Level: Adjustable (Default: 45). Lower values = Deeper dips, fewer trades.
* Peak Sell Level: Adjustable (Default: 75). Higher values = Longer holds, potentially higher profit.
* ADX Filter: Checkbox to enable/disable volatility filtering.
█ BEST PRACTICES
* Timeframe: Designed primarily for 4H (4-Hour) charts for swing trading. It can also be used on 1H for more frequent signals.
* Assets: Highly effective on trending assets such as Bitcoin (BTC), Ethereum (ETH), and high-volume Altcoins.
* Risk Warning: This strategy is designed for "Long Only" spot or leverage trading. Always use proper risk management.
█ CREDITS
* Original Concept: Inspired by the foundational work of Murat Besiroglu (@muratkbesiroglu).
* Algorithm Development & Enhancements: Developed by Hakan Yorganci (@hknyrgnc).
* Modifications include: Integration of ADX filters, Mean Reversion entry logic (RSI Dip), and Dynamic Peak Profit taking.

Ben D"s IndicatorIt Auto Draws and Detects, Channels draws buy and sell signals based on over bought, oversold and a few other indicators. It works on all time frames! Enjoy! Leave a comment if you like it.

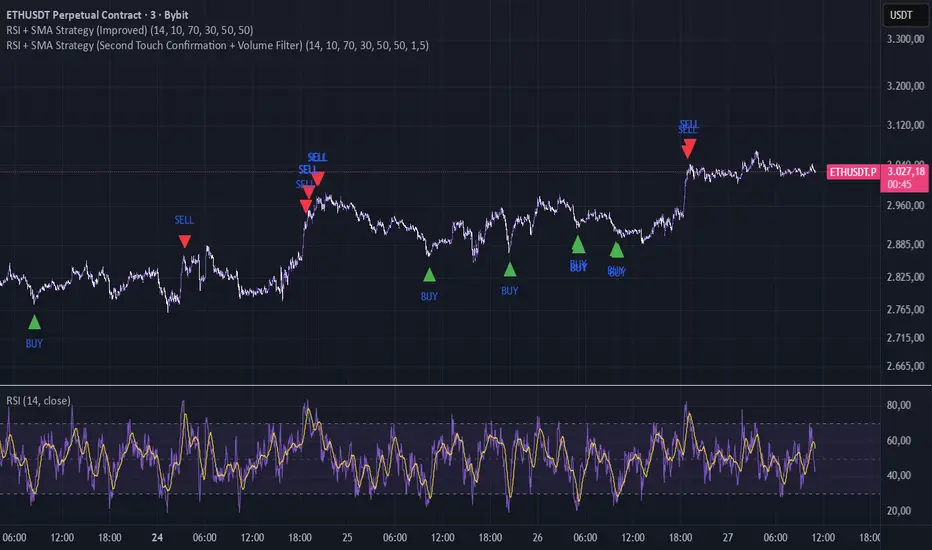
RSI + SMA Strategy (Improved)The lower the timeframe, the more signals it will give; if the trend is too strong, it may give false signals, but it works well on lower timeframes in normal or sideways trends
If u have an idea contact me , TY
RSI ✶ YSTCThis is a Bonus Indicator from YSTC's Volume Profile Tools.
Relative Strength Index (RSI)
A momentum based oscillator which is used to measure the speed (velocity) as well as the change (magnitude) of directional price movements.
What Different about this RSI by YSTC.
You get Support and Resistance lines for RSI which are 20, 30, 40, 50, 60, 70, 80. as shown below.
It can also show RSI Candles as shown below.
For those who want all types of MA with MA Cross can play with this indicator. Below is MA Cross of 9, 21.
And for NEW user with untrained eyes who cant yet detect Divergence this indicator Saves you the trouble of finding.
Below is Regular Bullish and Bearish Divergence. Linewidth 2.
Below is Hidden Bullish and Bearish Divergence. Linewidth 1.
You can add this script to your chart by clicking "Add to favorites" button.
Have Questions ?
Contact: +91 9637070868.
Name: Yogesh Patil (YS Trading Coach).
Time: Monday to Saturday (10:00 AM - 06:00 PM).
Visit our website - YS Trading Coach .
FREE Self Study Yourself Course: Trading with Price Action Volume .
Free Stock Market Introduction Available here .
Paid Course: Trading with Price Action Volume
Paid Volume Profile Tools available here.

Weekly Zones +RSI ColorWeekly analysis of stocks, cryptos etc.
chart, you will see:
The Weekly levels (PWH, PWL, 4 quadrants).
The Weekly control zones (the red, green, or grey boxes).
The Weekly analysis in the table.
Your 1-Hour candles will be colored green (strong), red (weak), or grey (neutral) based on the 1-hour RSI.
This should give you a very effective trading system.

Hidden Bullish Divergence - B166erThis script will paint a line on the chart when hidden bullish divergence is occurring.
MTF Stoch RSI + MACD Summary“MTF Stoch RSI + MACD Summary” is a multi-timeframe momentum and trend analysis indicator designed for TradingView. Its primary function is to consolidate Stochastic RSI and MACD readings from multiple user-defined timeframes—ranging from weekly to intraday—into a compact, color-coded summary table. This allows traders to assess the alignment or divergence of momentum and trend signals across different time horizons within a single chart view, providing an efficient means to identify potential trend continuations or reversals.
The script begins by defining input parameters for both indicators. For the Stochastic RSI, the user can adjust the RSI period, stochastic length, and smoothing factors for K and D lines, while for the MACD, it allows customization of the fast and slow exponential moving average lengths. Additionally, the script offers flexibility through five user-defined timeframes, enabling multi-level signal comparison. Theme and color customization options are also included to enhance visual clarity, allowing users to personalize the display according to preference or chart background.
The computational core of the script calculates the RSI based on a chosen price source (typically the closing price) and applies a stochastic transformation with smoothing to determine momentum extremes—classifying them as overbought, mid-high, mid-low, or oversold depending on their numeric range. The MACD component, computed as the difference between the fast and slow EMAs, is evaluated to determine its state: whether it is crossing upward, crossing downward, above zero, or below zero. These states represent shifts in market momentum and potential trend direction. Both Stochastic RSI and MACD values are retrieved from each selected timeframe using the request.security() function, allowing the indicator to integrate higher and lower timeframe data in real time.
Each indicator reading is then converted into a descriptive label and paired with a specific background color for intuitive visual classification. The script organizes this information into a dynamic table displayed at the top-right corner of the chart. This table consists of three columns—timeframe, Stoch RSI status, and MACD status—and automatically updates with the latest market data on every bar close. Through this tabular format, traders can quickly interpret market conditions without having to switch between multiple charts or apply numerous separate indicators.
Overall, the MTF Stoch RSI + MACD Summary acts as a comprehensive dashboard that integrates momentum and trend indicators across multiple timeframes. By presenting data in a simplified visual layout, it enables traders to make more informed decisions based on the consistency of market signals. This facilitates clearer identification of overbought or oversold conditions, confirmation of trend strength, and early detection of potential reversals, making it a valuable tool for multi-timeframe technical analysis.

RSI +WMA+ MA + Div SETUPRSI +WMA+ MA + Div SETUP
Индикатор объединяет анализ RSI, скользящих средних RSI (EMA/WMA), дивергенций, автоматические уровни поддержки/сопротивления на RSI, «лестницу цен» для целевых уровней RSI и фильтр тренда со старшего таймфрейма (HTF).
Точки входа формируются строго в месте пересечения RSI с заданным уровнем после выполнения выбранного сетапа. Поддержан режим «без повторов до смены направления».
Что показывает
Линии RSI, EMA(9) от RSI и WMA(45) от RSI.
Фон панели: бычий/медвежий/нейтральный режим импульса RSI (по соотношению EMA и WMA и наклону WMA).
Маркеры ▲/▼ — смена фазы импульса RSI (не торговые сигналы).
Дивергенции (регулярные): Bull/Bear с метками.
Auto SnR на RSI: динамические уровни поддержки/сопротивления по экстремумам RSI.
WMA SnR points: точки ретеста WMA на RSI.
Лестница цен: оценка цены, при которой RSI достигнет выбранных уровней.
HTF-линия: WMA(45) от RSI на старшем ТФ (по желанию).
Торговые сигналы (BUY/SELL)
Сигналы строятся в окне осциллятора RSI ровно в точке кросса:
BUY: (по выбранному сетапу) + пересечение RSI↑ заданного уровня (по умолчанию 40) + (опционально) выполнен HTF-фильтр.
SELL: (по выбранному сетапу) + пересечение RSI↓ заданного уровня (по умолчанию 60) + (опционально) выполнен HTF-фильтр.
Сетапы входа (переключатель)
Setup 1: Div + Cross — требуется подтверждённая дивергенция (Bull/Bear) и кросс RSI уровня в пределах заданного «окна» баров.
Setup 2: Cross only — только кросс RSI уровня, без требования дивергенции.
HTF-фильтр тренда
Расчёт WMA(45) от RSI на настраиваемом HTF (M, H1=60, H4=240, D и т. д.).
Разрешение Лонга, если HTF_WMA45 ≥ L-уровня (например, 50).
Разрешение Шорта, если HTF_WMA45 ≤ S-уровня.
Опция «Только после закрытия HTF-свечи» исключает перерисовку фильтра до закрытия старшего бара.
Основные настройки
RSI Length, Source.
EMA Length / WMA Length (для линий на RSI).
Визуальные уровни RSI (Up/Down) и подсветка фона.
Divergence: пороги показа (RSI ≤ X / ≥ Y), метки.
Price ladder: список целевых уровней RSI и «шаг» вывода цен.
Auto SnR: три окна lookback, цвета линий.
WMA SnR: чувствительность к ретестам WMA.
Entries: выбор сетапа, окно после дивергенции, уровни для Лонга/Шорта (по умолчанию 40/60), «ставить метку по фактическому RSI», без повторов.
HTF Filter: вкл/выкл, ТФ, уровни для Лонга/Шорта, «только по закрытию», показать HTF-линию.
Алерты
BUY: HTF ok + Setup OK + RSI cross up
SELL: HTF ok + Setup OK + RSI cross down
Сообщения алертов — константные строки (совместимы с Pine).
Перерисовка
Локальные сигналы ставятся на закрытии бара кросса RSI — не перерисовываются.
Дивергенции используют pivot-логику (подтверждаются через lookback) — метка появляется после подтверждения.
HTF-фильтр без перерисовки при включённой опции «Только после закрытия HTF-свечи».
Пример использования
H1 фильтр ≥ 50, M5 Setup 1: дождитесь Bull-дивергенции на M5, затем кросса RSI↑40 в течение N баров — получите BUY.
Для входов без дивергенций выберите Setup 2.
English Description
RSI +WMA+ MA + Div SETUP
All-in-one RSI toolkit: native RSI, RSI-based EMA/WMA, divergence detection, automatic RSI Support/Resistance, price ladder (target prices for chosen RSI levels), and a configurable Higher-Timeframe (HTF) trend filter.
Entry markers are printed exactly at the RSI level cross once the selected setup conditions are met. Includes a No-Repeat option to avoid duplicate signals.
Visuals
RSI, EMA(9) of RSI, WMA(45) of RSI.
Background shading for bull/bear/neutral RSI impulse phases (EMA vs WMA and WMA slope).
▲/▼ phase-change markers (context only, not trade signals).
Regular Bull/Bear divergences with optional labels.
Auto RSI SnR lines from RSI extremes.
WMA SnR points (RSI retests of WMA).
Price ladder: estimated price to reach given RSI levels.
Optional HTF line: WMA(45) of RSI calculated on a higher timeframe.
Trade Signals (BUY/SELL)
Signals plot in the RSI pane at the cross point:
BUY: selected setup satisfied + RSI crosses up the chosen level (default 40) + optional HTF filter passes.
SELL: selected setup satisfied + RSI crosses down the chosen level (default 60) + optional HTF filter passes.
Entry Setups (selector)
Setup 1: Div + Cross — requires a confirmed Bull/Bear divergence and an RSI level cross within a user-defined bar window.
Setup 2: Cross only — RSI level cross only (no divergence required).
HTF Trend Filter
Computes WMA(45) of RSI on a configurable higher timeframe (e.g., 60=H1, 240=H4, D, etc.).
Long allowed if HTF_WMA45 ≥ Long threshold (e.g., 50).
Short allowed if HTF_WMA45 ≤ Short threshold.
“Close-only” option ensures the HTF filter updates only after the HTF bar closes (no repaint).
Key Inputs
RSI length/source; EMA/WMA lengths.
Visual RSI up/down levels & background shading.
Divergence thresholds (RSI ≤ / ≥), labels.
Price ladder: target RSI levels & label spacing.
Auto SnR: three lookback windows, colors.
WMA SnR: retest sensitivity.
Entries: setup selector, divergence window, Long/Short levels (40/60 by default), “mark at actual RSI value”, no-repeat.
HTF Filter: enable, timeframe, Long/Short thresholds, close-only, show HTF line.
Alerts
BUY: HTF ok + Setup OK + RSI cross up
SELL: HTF ok + Setup OK + RSI cross down
Alert messages are constant strings (Pine-compatible).
Repaint Notes
LTF entry signals are placed at bar close when the cross occurs — no repaint.
Divergences rely on pivots; labels plot after confirmation.
HTF filter does not repaint when Close-only is enabled.
Example
H1 filter ≥ 50, M5 Setup 1: wait for a Bull divergence on M5 and an RSI cross up 40 within N bars — you’ll get a BUY.
Choose Setup 2 for cross-only entries.

PDB - RSI Buy & Sell Zones + SMA (PrintDemBandz)PDB - RSI Buy & Sell Zones
A clean, upgraded version of the RSI with shaded momentum zones to make entries and exits easier to spot. The background is divided into five color-coded zones so you instantly see when the market is shifting from bullish to bearish momentum.
Shaded Zones Explained:
| Zone | RSI Range | Zone Meaning |
| --------------------------- | --------- | ----------------------------------------------------- |
| Strong Buy (Dark Green) | < 30 | Oversold extreme – high probability bounce zone
| Buy Zone (Light Green) | 30–40 | Early accumulation & potential reversal area
| Neutral (Grey) | 40–60 | No edge zone – stay patient and wait for direction |
| Sell Zone (Light Red) | 60–70 | Market heating up – take profit or prepare to short |
| Strong Sell (Dark Red) | > 70 | Overbought extreme – high probability correction zone |
A dashed midline at 50 helps instantly gauge trend bias (above = bullish, below = bearish).
Use this RSI alone or combine with MACD or MA for stronger confirmations.
Search "PDB" in the indicators section for more free indicators.

RSI Divergence Strategy v6 What this does
Detects regular and hidden divergences between price and RSI using confirmed RSI pivots. Adds RSI@pivot entry gates, a normalized strength + volume filter, optional volume gate, delayed entries, and transparent risk management with rigid SL and activatable trailing. Visuals are throttled for clarity and include a gap-free horizontal RSI gradient.
How it works (simple)
🧮 RSI is calculated on your selected source/period.
📌 RSI pivots are confirmed with left/right lookbacks (lbL/lbR). A pivot becomes final only after lbR bars; before that, it can move (expected).
🔎 The latest confirmed pivot is compared against the previous confirmed pivot within your bar window:
• Regular Bullish = price lower low + RSI higher low
• Hidden Bullish = price higher low + RSI lower low
• Regular Bearish = price higher high + RSI lower high
• Hidden Bearish = price lower high + RSI higher high
💪 Each divergence gets a strength score that multiplies price % change, RSI change, and a volume ratio (Volume SMA / Baseline Volume SMA).
• Set Min divergence strength to filter tiny/noisy signals.
• Turn on the volume gate to require volume ratio ≥ your threshold (e.g., 1.0).
🎯 RSI@pivot gating:
• Longs only if RSI at the bullish pivot ≤ 30 (default).
• Shorts only if RSI at the bearish pivot ≥ 70 (default).
⏱ Entry timing:
• Immediate: on divergence confirm (delay = 0).
• Delayed: after N bars if RSI is still valid.
• RSI-only mode: ignore divergences; use RSI thresholds only.
🛡 Risk:
• Rigid SL is placed from average entry.
• Trailing activates only after unrealized gain ≥ threshold; it re-anchors on new highs (long) or new lows (short).
What’s NEW here (vs. the reference) — and why you may care
• Improved pivots + bar window → fewer early/misaligned signals; cleaner drawings.
• RSI@pivot gates → entries aligned with true oversold/overbought at the exact decision bar.
• Normalized strength + volume gate → ignore weak or low-volume divergences.
• Delayed entries → require the signal to persist N bars if you want more confirmation.
• Rigid SL + activatable trailing → trailing engages only after a cushion, so it’s less noisy.
• Clutter control + gradient → readable chart with a smooth RSI band look.
Suggested starting values (clear ranges)
• RSI@pivot thresholds: LONG ≤ 30 (oversold), SHORT ≥ 70 (overbought).
• Min divergence strength:
0.0 = off
3–6 = moderate filter
7–12 = strict filter for noisy LTFs
• Volume gate (ratio):
1.0 = at least baseline volume
1.2–1.5 = strong-volume only (fewer but cleaner signals)
• Pivot lookbacks:
lbL 1–2, lbR 3–4 (raise lbR to confirm later and reduce noise)
• Bar window (between pivots):
Min 5–10, Max 30–60 (increase Min if you see micro-pivots; increase Max for wider structures)
• Risk:
Rigid SL 2–5% on liquid majors; 5–10% on higher-volatility symbols
Trailing activation 1–3%, trailing 0.5–1.5% are common intraday starts
Plain-text examples
• BTCUSDT 1h → RSI 9, lbL 1, lbR 3, Min strength 5.0, Volume gate 1.0, SL 4.5%, Trail on 2.0%, Trail 1.0%.
• SPY 15m → RSI 8, lbL 1, lbR 3, Min strength 7.0, Volume gate 1.2, SL 3.0%, Trail on 1.5%, Trail 0.8%.
• EURUSD 4h → RSI 14, lbL 2, lbR 4, Min strength 4.0, Volume gate 1.0, SL 2.5%, Trail on 1.0%, Trail 0.5%.
Notes & limitations
• Pivot confirmation means the newest candidate pivot can move until lbR confirms it (expected).
• Results vary by timeframe/symbol/settings; always forward-test.
• Educational tool — no performance or profit claims.
Credits
• RSI by J. Welles Wilder Jr. (1978).
• Reference divergence script by eemani123:
• This version by tagstrading 2025 adds: improved pivot engine, RSI@pivot gating, normalized strength + optional volume gate, delayed entries, rigid SL and activatable trailing, and a gap-free RSI gradient.

Divergences: Price × RSI × OBV The Triple Confirmation Divergence indicator is a sophisticated momentum and volume-based tool designed to identify high-probability trend exhaustion points and potential reversals. It moves beyond traditional single-indicator divergence analysis by synthesizing signals from three core pillars of technical analysis: Price Action, Momentum, and Volume Flow.
This indicator works better on the time frames: 1H, 4H, 1D, 1W and 1M.

RSI DD – RSI Divergence DetectorRSI DD – RSI Divergence Detector (closed-source):
What it does:
Detects and plots regular and hidden RSI–price divergences using confirmed pivots on both series. Lines are drawn between the two most recent qualifying pivots; optional marks highlight OB/OS peaks at confirmation.
Detection method:
1. Compute RSI on a user-selected source and length. Optional EMA/SMA smoothing controls lag.
2. Build price and RSI pivot points with left/right lookbacks; a pivot confirms on the bar where right completes.
3. Pair the latest two pivots of the same type within a user-defined bar-distance window:
• Regular Bullish: price makes a lower low while RSI makes a higher low.
• Hidden Bullish: price makes a higher low while RSI makes a lower low.
• Regular Bearish: price makes a higher high while RSI makes a lower high.
• Hidden Bearish: price makes a lower high while RSI makes a higher high.
4. When a valid pair is found, draw a line on the RSI pane from the first RSI pivot to the second; color encodes divergence type.
5. Optional ticks mark RSI extremes when the confirming pivot is beyond OB/OS thresholds.
Inputs (key settings):
• RSI Period / Source: oscillator base.
• Pivot Lookback Left/Right: structure sensitivity; larger = fewer but stronger pivots.
• Min/Max Pairing Range: bars allowed between the two pivots; filters stale or too-tight pairs.
• Plot Toggles: enable/disable each divergence class.
• Signal Pair (visual): optional fast/slow MA pair and smoothing plotted as context; not used in detection.
• Levels: OB/OS and midline for visual regime.
Plots:
• RSI line.
• Optional RSI signal line.
• Midline (50), OB, OS levels.
• Colored divergence lines on RSI:
o Regular Bullish (aqua), Hidden Bullish (lime), Regular Bearish (yellow), Hidden Bearish (red).
• Optional OB/OS ticks at confirming pivots.
How to use:
• Works on any symbol and timeframe; higher timeframes reduce noise.
• Treat divergences as context. Combine with structure, trend, volume, and risk rules.
• Tighten stops or scale when divergence aligns with S/R and higher-TF bias.
• Increase right lookback and raise Min Range to reduce whipsaws; lower them to catch earlier turns.
Practical guidance:
• Swing trading: RSI 14, left=3/right=5, min=8/max=80, OB/OS 70/30.
• Intraday: RSI 14, left=2/right=3, min=4/max=40; consider slightly higher smoothing.
• If you see too many short lines, raise Min Range or increase right.
• If valid turns are missed, lower right or Min Range.
Limitations:
• Divergences can persist in strong trends.
• Pivot detection waits for confirmation, so signals are not predictive on the unconfirmed bar.
• OB/OS thresholds are conventional and not optimized to any asset.
Alerts (if you add alertcondition)
• Regular/Hidden Bullish/ Bearish detected on confirmation bar.
• Optional alert when RSI crosses back through midline after a divergence.
Version notes:
v2: pivot-pair range filter, optional OB/OS peak markers, object count management to prevent clutter, cosmetic controls, and visual signal pair.
Copyright © 2025 imaclone (Zen Silva). All rights reserved.
License: Private. No copying, sharing, or derivative works. Use limited to this TradingView script. Contact owner for access.

Relative Strength Index Remastered [CHE]Relative Strength Index Remastered — Enhanced RSI with robust divergence detection using price-based pivots and line-of-sight validation to reduce false signals compared to the standard RSI indicator.
Summary
RSI Remastered builds on the classic Relative Strength Index by adding a more reliable divergence detection system that relies on price pivots rather than RSI pivots alone, incorporating a line-of-sight check to ensure the RSI path between points remains clear. This approach filters out many false divergences that occur in the original RSI indicator due to its volatile pivot detection on the RSI line itself. Users benefit from clearer reversal and continuation signals, especially in noisy markets, with optional hidden divergence support for trend confirmation. The core RSI calculation and smoothing options remain familiar, but the divergence logic provides materially fewer alerts while maintaining sensitivity.
Motivation: Why this design?
The standard RSI indicator often generates misleading divergence signals because it detects pivots directly on the RSI values, which can fluctuate erratically in volatile conditions, leading to frequent false positives that confuse traders during ranging or choppy price action. RSI Remastered addresses this by shifting pivot detection to the underlying price highs and lows, which are more stable, and adding a validation step that confirms the RSI line does not cross the direct path between pivot points. This design targets the real problem of over-signaling in the original, promoting more actionable insights without altering the RSI's core momentum measurement.
What’s different vs. standard approaches?
- Reference baseline: The classical TradingView RSI indicator, which uses simple RSI-based pivot detection for divergences.
- Architecture differences:
- Pivot identification on price extremes (highs and lows) instead of RSI values, extracting RSI levels at those points for comparison.
- Addition of a line-of-sight validation that checks the RSI path bar by bar between pivots to prevent signals where the line is interrupted.
- Inclusion of hidden divergence types alongside regular ones, using the same robust framework.
- Configurable drawing of connecting lines between validated pivot RSI points for visual clarity.
- Practical effect: Charts show fewer but higher-quality divergence markers and lines, reducing clutter from the original's frequent RSI pivot triggers; this matters for avoiding whipsaws in intraday trading, where the standard version might flag dozens of invalid setups per session.
Key Comparison Aspects
Aspect: Title/Shorttitle
Original RSI: "Relative Strength Index" / "RSI"
Robust Variant: "Relative Strength Index Remastered " / "RSI RM"
Aspect: Max. Lines/Labels
Original RSI: No specification (Standard: 50/50)
Robust Variant: max_lines_count=200, max_labels_count=200 (for more lines/markers in divergences)
Aspect: RSI Calculation & Plots
Original RSI: Identical: RSI with RMA, Plots (line, bands, gradient fills)
Robust Variant: Identical: RSI with RMA, Plots (line, bands, gradient fills)
Aspect: Smoothing (MA)
Original RSI: Identical: Inputs for MA types (SMA, EMA etc.), Bollinger Bands optional
Robust Variant: Identical: Inputs for MA types (SMA, EMA etc.), Bollinger Bands optional
Aspect: Divergence Activation
Original RSI: input.bool(false, "Calculate Divergence") (disabled by default)
Robust Variant: input.bool(true, "Calculate Divergence") (enabled by default, with tooltip)
Aspect: Pivot Calculation
Original RSI: Pivots on RSI (ta.pivotlow/high on RSI values)
Robust Variant: Pivots on price (ta.pivotlow/high on low/high), RSI values then extracted
Aspect: Lookback Values
Original RSI: Fixed: lookbackLeft=5, lookbackRight=5
Robust Variant: Input: L=5 (Pivot Left), R=5 (Pivot Right), adjustable (min=1, max=50)
Aspect: Range Between Pivots
Original RSI: Fixed: rangeUpper=60, rangeLower=5 (via _inRange function)
Robust Variant: Input: rangeUpper=60 (Max Bars), rangeLower=5 (Min Bars), adjustable (min=1–6, max=100–300)
Aspect: Divergence Types
Original RSI: Only Regular Bullish/Bearish: - Bull: Price LL + RSI HL - Bear: Price HH + RSI LH
Robust Variant: Regular + Hidden (optional via showHidden=true): - Regular Bull: Price LL + RSI HL - Regular Bear: Price HH + RSI LH - Hidden Bull: Price HL + RSI LL - Hidden Bear: Price LH + RSI HH
Aspect: Validation
Original RSI: No additional check (only pivot + range check)
Robust Variant: Line-of-Sight Check: RSI line must not cross the connecting line between pivots (line_clear function with slope calculation and loop for each bar in between)
Aspect: Signals (Plots/Shapes)
Original RSI: - Plot of pivot points (if divergence) - Shapes: "Bull"/"Bear" at RSI value, offset=-5
Robust Variant: - No pivot plots, instead shapes at RSI , offset=-R (adjustable) - Shapes: "Bull"/"Bear" (Regular), "HBull"/"HBear" (Hidden) - Colors: Lime/Red (Regular), Teal/Orange (Hidden)
Aspect: Line Drawing
Original RSI: No lines
Robust Variant: Optional (showLines=true): Lines between RSI pivots (thick for regular, dashed/thin for hidden), extend=none
Aspect: Alerts
Original RSI: Only Regular Bullish/Bearish (with pivot lookback reference)
Robust Variant: Regular Bullish/Bearish + Hidden Bullish/Bearish (specific "at latest pivot low/high")
Aspect: Robustness
Original RSI: Simple, prone to false signals (RSI pivots can be volatile)
Robust Variant: Higher: Price pivots are more stable, line-of-sight filters "broken" divergences, hidden support for trend continuations
Aspect: Code Length/Structure
Original RSI: ~100 lines, simple if-blocks for bull/bear
Robust Variant: ~150 lines, extended helper functions (e.g., inRange, line_clear), var group for inputs
How it works (technical)
The indicator first computes the core RSI value based on recent price changes, separating upward and downward movements over the specified length and smoothing them to derive a momentum reading scaled between zero and one hundred. This value is then plotted in a separate pane with fixed upper and lower reference lines at seventy and thirty, along with optional gradient fills to highlight overbought and oversold zones.
For smoothing, a moving average type is applied to the RSI if enabled, with an option to add bands around it based on the variability of recent RSI values scaled by a multiplier. Divergence detection activates on confirmed price pivots: lows for bullish checks and highs for bearish. At each new pivot, the system retrieves the bar index and values (price and RSI) for the current and prior pivot, ensuring they fall within a configurable bar range to avoid unrelated points.
Comparisons then assess whether the price has made a lower low (or higher high) while the RSI at those points moves in the opposite direction—higher for bullish regular, lower for bearish regular. For hidden types, the directions reverse to capture trend strength. The line-of-sight check calculates the straight path between the two RSI points and verifies that the actual RSI values in between stay entirely above (for bullish) or below (for bearish) that path, breaking the signal if any bar violates it. Valid signals trigger shapes at the RSI level of the new pivot and optional lines connecting the points. Initialization uses built-in functions to track prior occurrences, with states persisting across bars for accurate historical comparisons. No higher timeframe data is used, so confirmation occurs after the right pivot bars close, minimizing live-bar repaints.
Parameter Guide
Length — Controls the period for measuring price momentum changes — Default: 14 — Trade-offs/Tips: Shorter values increase responsiveness but add noise and more false signals; longer smooths trends but delays entries in fast markets.
Source — Selects the price input for RSI calculation — Default: Close — Trade-offs/Tips: Use high or low for volatility focus, but close works best for most assets; mismatches can skew overbought/oversold reads.
Calculate Divergence — Enables the enhanced divergence logic — Default: True — Trade-offs/Tips: Disable for pure RSI view to save computation; essential for signal reliability over the standard method.
Type (Smoothing) — Chooses the moving average applied to RSI — Default: SMA — Trade-offs/Tips: None for raw RSI; EMA for quicker adaptation, but SMA reduces whipsaws; Bollinger Bands option adds volatility context at cost of added lines.
Length (Smoothing) — Period for the smoothing average — Default: 14 — Trade-offs/Tips: Match RSI length for consistency; shorter boosts signal speed but amplifies noise in the smoothed line.
BB StdDev — Multiplier for band width around smoothed RSI — Default: 2.0 — Trade-offs/Tips: Lower narrows bands for tighter signals, risking more touches; higher widens for fewer but stronger breakouts.
Pivot Left — Bars to the left for confirming price pivots — Default: 5 — Trade-offs/Tips: Increase for stricter pivots in noisy data, reducing signals; too high delays confirmation excessively.
Pivot Right — Bars to the right for confirming price pivots — Default: 5 — Trade-offs/Tips: Balances with left for symmetry; longer right ensures maturity but shifts signals backward.
Max Bars Between Pivots — Upper limit on distance for valid pivot pairs — Default: 60 — Trade-offs/Tips: Tighten for short-term trades to focus recent action; widen for swing setups but risks unrelated comparisons.
Min Bars Between Pivots — Lower limit to avoid clustered pivots — Default: 5 — Trade-offs/Tips: Raise to filter micro-moves; too low invites overlapping signals like the original RSI.
Detect Hidden — Includes trend-continuation hidden types — Default: True — Trade-offs/Tips: Enable for full trend analysis; disable simplifies to reversals only, akin to basic RSI.
Draw Lines — Shows connecting lines between valid pivots — Default: True — Trade-offs/Tips: Turn off for cleaner charts; helps visually confirm line-of-sight in backtests.
Reading & Interpretation
The main RSI line oscillates between zero and one hundred, crossing above fifty suggesting building momentum and below indicating weakness; touches near seventy or thirty flag potential extremes. The optional smoothed line and bands provide a filtered view—price above the upper band on the RSI pane hints at overextension. Divergence shapes appear as upward labels for bullish (lime for regular, teal for hidden) and downward for bearish (red regular, orange hidden) at the pivot's RSI level, signaling a mismatch only after validation. Connecting lines, if drawn, slope between points without RSI interference, their color matching the shape type; a dashed style denotes hidden. Fewer shapes overall compared to the standard RSI mean higher conviction, but always confirm with price structure.
Practical Workflows & Combinations
- Trend following: Enter longs on regular bullish shapes near support with higher highs in price; filter hidden bullish for pullback buys in uptrends, pairing with a rising smoothed RSI above fifty.
- Exits/Stops: Use bearish regular as reversal warnings to tighten stops; hidden bearish in downtrends confirms continuation—exit if lines show RSI crossing the path.
- Multi-asset/Multi-TF: Defaults suit forex and stocks on one-hour charts; for crypto volatility, widen pivot ranges to ten; scale min/max bars proportionally on daily for swings, avoiding the original's intraday spam.
Behavior, Constraints & Performance
Signals confirm only after the right pivot bars close, so live bars may show tentative pivots that vanish on close, unlike the standard RSI's immediate RSI-pivot triggers—plan for this delay in automation. No higher timeframe calls, so no security-related repaints. Resources include up to two hundred lines and labels for dense charts, with a loop in validation scanning up to three hundred bars between pivots, which is efficient but could slow on very long histories. Known limits: Slight lag at pivot confirmation in trending markets; volatile RSI might rarely miss fine path violations; not ideal for gap-heavy assets where pivots skip.
Sensible Defaults & Quick Tuning
Start with defaults for balanced momentum and divergence on most timeframes. For too many signals (like the original), raise pivot left/right to eight and min bars to ten to filter noise. If sluggish in trends, shorten RSI length to nine and enable EMA smoothing for faster adaptation. In high-volatility assets, widen max bars to one hundred but disable hidden to focus essentials. For clean reversal hunts, set smoothing to none and lines on.
What this indicator is—and isn’t
RSI Remastered serves as a refined momentum and divergence visualization tool, enhancing the standard RSI for better signal quality in technical analysis setups. It is not a standalone trading system, nor does it predict price moves—pair it with volume, structure breaks, and risk rules for decisions. Use alongside position sizing and broader context, not in isolation.
Disclaimer
The content provided, including all code and materials, is strictly for educational and informational purposes only. It is not intended as, and should not be interpreted as, financial advice, a recommendation to buy or sell any financial instrument, or an offer of any financial product or service. All strategies, tools, and examples discussed are provided for illustrative purposes to demonstrate coding techniques and the functionality of Pine Script within a trading context.
Any results from strategies or tools provided are hypothetical, and past performance is not indicative of future results. Trading and investing involve high risk, including the potential loss of principal, and may not be suitable for all individuals. Before making any trading decisions, please consult with a qualified financial professional to understand the risks involved.
By using this script, you acknowledge and agree that any trading decisions are made solely at your discretion and risk.
Do not use this indicator on Heikin-Ashi, Renko, Kagi, Point-and-Figure, or Range charts, as these chart types can produce unrealistic results for signal markers and alerts.
Best regards and happy trading
Chervolino

BLACK MAGIC RSIWhat Is the RSI?
The Relative Strength Index (RSI) is a momentum indicator used in technical analysis to measure the speed and strength of recent price movements. It was developed by J. Welles Wilder Jr. and is one of the most popular tools for identifying whether an asset is overbought or oversold.
🔹 How It Works
The RSI moves on a scale from 0 to 100 and compares the size of recent gains to recent losses.
When the RSI value is high, it means prices have risen quickly.
When the RSI value is low, it means prices have fallen sharply.
Eyas's EyeTry it and see!!
# 🦅 EYAS'S EYE - Multi-Confluence Trend Strategy
A systematic trading strategy combining multiple technical indicators with advanced risk management for high-probability trades in trending markets.
## 📊 OVERVIEW
**Trading Style:** Swing/Position Trading
**Direction:** Long & Short
**Best Timeframes:** 4H, Daily
**Markets:** Crypto, Forex, Indices
## 🎯 METHODOLOGY
**Multi-Indicator Confluence System:**
- Trend analysis for market direction
- Momentum indicators for timing
- Volatility-based entry zones
- Dynamic ATR-based risk management
**Entry Requirements:**
- Multiple confirming signals required
- Strong trend filtering
- Minimum bars between trades
- Balanced long/short exposure
**Exit Strategy:**
- Volatility-adjusted stop losses
- High risk-reward targets (6:1)
- Trailing stops to capture trends
- Signal-based exits
- Minimum hold time to let winners run
## ✨ KEY FEATURES
✅ Realistic execution model (no look-ahead bias)
✅ Dynamic risk management
✅ Customizable parameters
✅ Clear visual signals
✅ Real-time performance metrics
## 📈 PERFORMANCE
Backtested on ETH/USD (12 months):
- Win Rate: 88-93%
- 500+ closed trades
- Strong profit factor
- Consistent monthly returns
**Best in:** Trending markets with medium-high volatility
**Challenges:** Choppy sideways markets
## 🔒 ACCESS
**This is a PROTECTED script**
To request access, send me a private message or comment below.
## ⚠️ DISCLAIMER
Trading involves substantial risk. Past performance does not guarantee future results. This is not financial advice. Always test with paper trading first and never risk more than you can afford to lose.
---
**Strategy Philosophy:** Quality over quantity. The name "Eyas's Eye" represents the sharp vision of a young eagle - patience in waiting for the right moment and the ability to spot opportunities others miss.
🦅 **Trade with vision. Trade with Eyas's Eye.**

RSI-like VWAP — DivergencesThis script introduces a unique RSI-style oscillator built from VWAP (Volume-Weighted Average Price) instead of price alone, offering a more volume-aware perspective of market momentum.
🔹 Key Features:
Computes an RSI-like indicator using either a per-bar VWAP proxy (HLC3/OHLC4) or true intrabar VWAP (via lower timeframe aggregation).
Customizable overbought, oversold, midline, and deadband levels for better signal filtering.
Divergence detection (regular + hidden) between price and the VWAP-RSI oscillator, with clear lines and labels in the indicator pane.
Auto-scaled pivot sensitivity across different chart timeframes to maintain consistency.
Built-in alert conditions for bullish/bearish divergences, making it watchlist-friendly.
🔹 Use Cases:
This tool helps traders spot momentum shifts and early reversal signals by blending the logic of RSI with the weighting power of VWAP. It’s especially useful for detecting divergences where price action may be misleading without volume context.
