搜索
产品
社区
市场
经纪商
更多
CN
开始
指标和策略
/
Rsi_oversold
Rsi_oversold
所有类型
所有类型
仅限开源
仅限开源
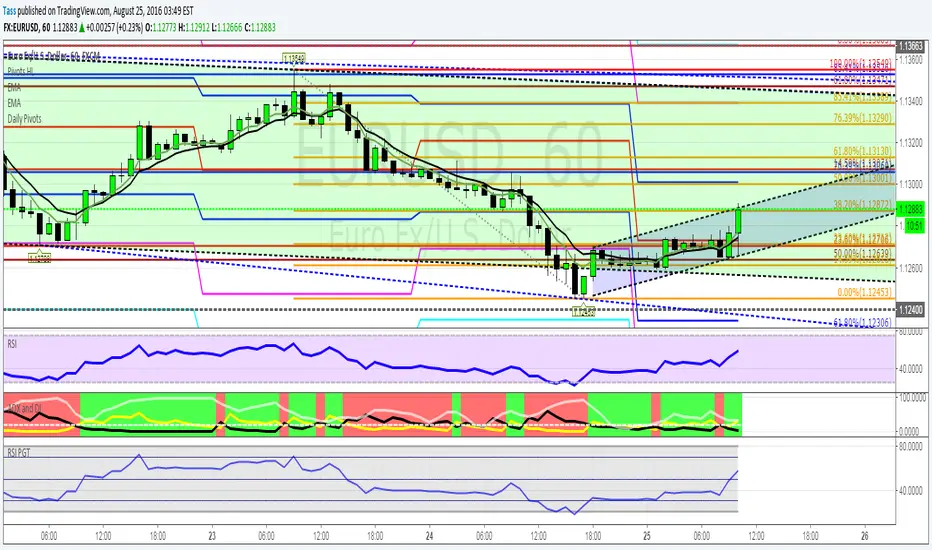
RSI by PGT
RSI with border to 70/30 and 80/20
Pine Script®指标
由Tass提供
1
1
3
1
5
1
1
2
2
3
3
4
4
5
5
6
6
7
7
…
999
999