[AlbaTherium] Structure Mapping & Order Blocks Advanced - Beta An Insight into Structure Mapping and Order Block Identification with Smart Money Concepts
Introduction:
Structure Mapping & Order Blocks Advanced - Beta serves as a fundamental pillar in the realm of Smart Money Concepts . This indicator adeptly charts the market structure based on a refined version of SMC while identifying Order Blocks. All the concepts embedded in this method are meticulously defined, offering users the ability to chart the market structure with heightened confidence. With this indicator, there is no need for excessive questioning of the accuracy of your markings; it diligently strives to perform this task effectively. There are no hidden 'magic' properties underlying this indicator, ensuring that our users can independently verify each and every feature. It is this commitment to transparency that sets us apart and makes us unique in the market.
In this discussion, we delve into the intricacies of Break of Structure , Change of Character , and SMART MONEY TRAP . We also introduce the concepts of Extreme Order Blocks , Decisional Order Blocks , and Smart Money Trap Order Blocks .
Chapter 1: Understanding Structure Mapping:
Let's begin with some definitions:
- Inside bars are candles that lie within the range of a preceding candle.
- Pullbacks occur in an uptrend when the low of a preceding candle's range (excluding inside bars) is breached, and the price continues to rise.
- Inducements (IDM) are price levels defined as the low of the latest pullback before the most recent high. They often act as liquidity points that the market revisits before continuing its move.
- Break of Structure (BoS):
In an uptrend, after surpassing an IDM , the most recent high becomes a Confirmed structure high, or a Major High . If the price then closes above this Major High , a Bullish Break of Structure (Bullish BoS) is confirmed. Similarly, the lowest point between these movements becomes a Confirmed structure low or Major Low in a downtrend.
- Change of Character (ChoCh):
In an uptrend, if the price falls below a Major Low , it indicates a shift in market bias from Bullish to Bearish, or a Bearish Change of Character .
Example of a bullish ChoCh :
Chapter 2: The Significance of Order Blocks:
Order Blocks (OB) play a pivotal role in Smart Money Concepts during entry points. Understanding what they represent and how to identify them is essential. For a Bullish/Bearish Order Block to be confirmed, specific conditions, including price imbalance and breaching the previous candle's high or low, must be met. We will delve into the finer details of identifying and trading Order Blocks, with an emphasis on the fact that price often reacts from Decisional Order Blocks, Extreme Order Blocks , and Smart Money Trap Order Blocks .
- An OB is the initial candle range of a pullback that creates a Fair value gap .
These are zones where proactive traders enter the market, resulting in significant price changes indicated by Fair value gaps . It is believed that when the price revisits these zones in the future, it tends to bounce back. This property makes Order Blocks excellent potential entry points.
Order Blocks are categorized as follows:
- Extreme OB : The first and lowest OB between the Major Low and Major High.
- Decisional OB : The most recent OB lower than the current IDM.
- Smart Money Traps : All OBs between Extreme and Decisional OB.
- Demand above IDM / Supply below IDM
Chapter 3: Understanding SMART MONEY TRAP (SMT):
SMART MONEY TRAP is a concept that brings clarity to the distinction between Structure and Order Blocks within Smart Money Concepts and is a unique feature of this indicator. While many Smart Money Traders base their trades on Structure and Order Blocks, it's crucial to recognize that Order Blocks serve as an additional confirmation for buy or sell decisions. Blindly trading based on Order Blocks is not advisable. Instead, traders should exercise patience and await other confirmations like inducement or Liquidity sweep before executing trades on Order Blocks. We will illustrate how this concept works in practice.
In the example above, the market largely disregards all the SMT s and responds favorably to the Extreme OB . This presents a promising trading opportunity, with a stop loss placed below the OB and a take profit set at the fill of the Fair value gap.
Conclusion:
Structure Mapping & Order Blocks Advanced - Beta embodies the essence of Smart Money Concepts , serving as a powerful tool for traders. This indicator effectively combines the elements of structure mapping and Order Blocks to guide trading decisions. By comprehending the dynamics of Impulsive Moves and Corrections, distinguishing between Bearish and Bullish Order Flow, and mastering the identification and trading of Order Blocks while considering SMART MONEY TRAP, traders can gain a competitive edge in the dynamic landscape of financial markets.
This document serves as a comprehensive guide to Structure Mapping & Order Blocks Advanced - Beta, highlighting its significance within the Smart Money Concepts framework. It is essential to apply these concepts judiciously to enhance trading.
在脚本中搜索"BOS"

Bist Manipulation [Projeadam]
OVERVIEW | GENEL BAKIŞ
ENG: Indicator that detects manipulation candles according to changing market conditions.
TR: Değişen piyasa koşullarına göre manipülasyon mumlarını tespit eden gösterge.
ENG: IMPORTANT NOTE: This indicator works in BIST Market and only in Future Parities.
Example ->> PETKM1! --SASA1!
TR: ÖNEMLİ NOT: Bu indikatör BİST Piyasasında ve sadece Future Paritelerde Çalışır.
Örnek- >> PETKM1! -- SASA1!
ENG: Market makers manipulate the market because most people who trade on the stock exchange act with their emotions and are forced to close the transaction at a loss.
TR: Piyasada market yapıcı oluşumlar manipülasyon yaparlar çünkü borsada işlem alan insanların birçoğu duygularıyla hareket eder ve zararla işlem kapatılmaya zorlanır.
ENG: If we detect manipulation candles in the market, we can control our fragile psychology and close our transactions in profit by trading with market-making formations in these areas.
TR: Marketde manipülasyon mumlarını tespit edersek kırılgan psikolojimizi kontrol edebilir ve bu alanlardan market yapıcı oluşumlarla beraber işlem alarak işlemlerimizi karda kapatabiliriz.
ALGORITHM | ALGORİTMA
ENG: With the help of this indicator, you can detect manipulation candles in the BIST exchange with the help of the algorithm I created by using volumetric data and wicks created by the price.
When there is excessive volatility in price movement, the algorithm in this indicator notices this price volatility and calculates a manipulation value by dividing it by the volatility value in past price movements.
TR: Bu indikatör yardımıyla hacimsel veriler ve fiyatın oluşturduğu fitillerden yararlanarak oluşturduğum algoritma yardımıyla siz de BİST borsasında manipülasyon mumlarını tespit edebilirsiniz.
Fiyat hareketinde aşırı derece oynaklık olduğunda bu indikatördeki algoritma bu fiyat oynaklığını fark eder ve geçmiş fiyat hareketlerindeki oylanklık degerine bölerek bize bir manipülasyon degeri hesaplar.
How does the indicator work? | Gösterge nasıl çalışır?
ENG: The manipulation candle does not give us information about the direction of price movement, it is only used as an auxiliary indicator.
TR: Manipülasyon mumu bize fiyat hareketinin yönü hakkında bilgi vermez sadece yardımcı bir gösterge olarak kullanılır.
ENG: We show our manipulation values as columns. We draw a channel over the values we show and we understand that there is manipulation in the candle of our values above this channel.
TR: Manipülasyon degerlerimiz kolonlar şeklinde gösteriyoruz. Gösterdiğimiz değerlerimizin üzerine bir kanal çizdiriyoruz ve bu kanalın üzerinde kalan değerlerimizdeki mumda manipülasyon yapıldığını anlıyoruz.
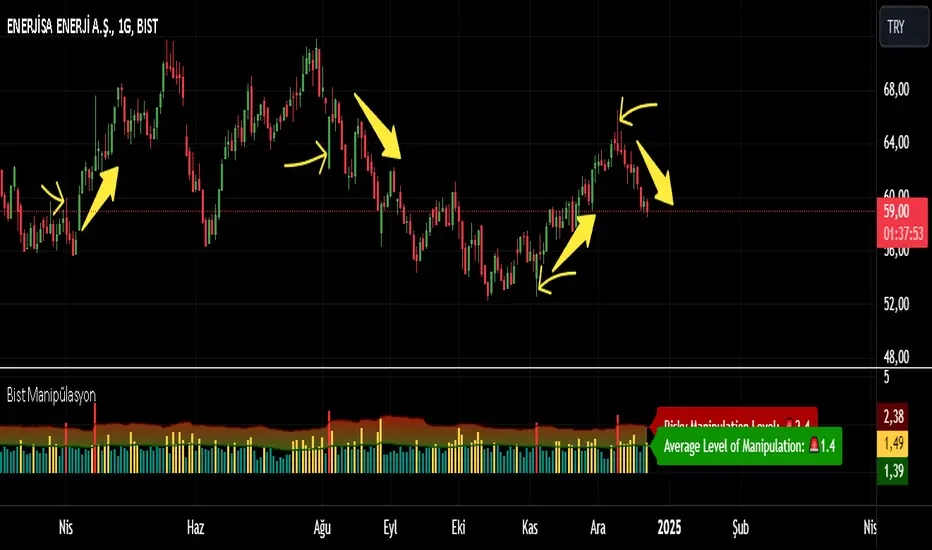
ENG: The indicator shows the manipulation value in the form of columns. Our manipulation value that goes outside the channel we have determined is colored red, within the channel it is colored yellow, and below the channel it is colored green. Red columns indicate candles that are manipulations.
TR: İndikatör manipülasyon degerini kolonlar şeklinde gösteriyor. Bizim belirlediğimiz kanal dışına çıkan manipülasyon degerimiz kırmızı, kanal içerisinde sarı, kanal altında yeşil olarak renklendiriliyor. Kırmızı kolonlar manipülasyon olan mumları göstermektedir.
Example | Örnek
ENG: In our example above, we see a manipulation candle that clears the price gaps, while the market maker clears the orders in the price gaps at the bottom to move the price up.
TR: Yukarıdaki örneğimizde oluşan fiyat boşluklarını temizleyen bir manipülasyon mumu görmekteyiz, alt kısımdaki fiyat boşluklarındaki emirleri temizleyen market maker fiyatı yukarı taşımak için buradaki emirleri temizliyor.
SETTINGS PANEL | AYARLAR PANELİ
ENG: We have only one setting in this indicator.
TR: Bu indikatörde tek ayarımız vardır.
ENG: Our multiplier value determines the width of the band value formed above our manipulation value. In the chart above, our multiplier value is 3.3. If we reduce our multiplier value, our manipulation sensitivity will decrease as there will be much more candles on the band.
TR: Çarpan değerimiz manipülasyon değerimizin üstünde oluşşan band değerinin genişliğini belirlemektedir.Yukarıdaki grafikte çarpan değerimiz 3.3, Eğer çarpan değerimizi azaltırsak band üstünde çok daha fazla mum olacağı için manipülasyon hassasiyetimiz azalacaktır.
ENG: When we set our multiplier value to 2.3, we have a more sensitive manipulation skin and it gives signals in more candles.
TR: Çarpan değerimizi 2.3 yapınca daha hassas manipülasyon derimiz oluyor ve daha fazla mumda sinyal veriyor.
If you have any ideas what to add to my work to add more sources or make calculations cooler, suggest in DM .
SMTV IndicatorThis indicator uses the ATR set to 2 to indicate Dynamic Support and Resistance levels. It also uses VWAP set to Weekly and a 50 Moving Average to indicate additional trend and support and resistance levels.
ATR x 2
View the Indicator on the 1H to Identify the Daily Support and Resistance levels.
This will be the Green and Red channel lines.
Red Line will indicate the daily Resistance Level.
Green Line will indicate the daily Support Level.
This is where prices are most likely to go to and either reverse or breakthrough, if it breaks either the Support or Resistance level then the next Support and Resistance Level will be marked out.
VWAP
The indicator is set to weekly, and it will indicate a Key Support or Resistance Level.
If price is above the VWAP it will indicate a Bullish Bias.
If price is below VWAP it will indicate a Bearish Bias.
You will often see bounces from this level, depending on if the Market is Bullish or Bearish.
If the VWAP is broken through and a bounce takes places then you can often see Trend reversal
Break of Structure
The indicator will also indicate when a Bullish or Bearish break off structure has occurred, which generally will indicate a trend change.
Green meaning Bullish.
Red meaning Bearish.
There is also an option to check the Buy and Sell signals box in the input, these signals will occur when a Break of Structure has taken place and the next candle after the BOS closes in the same direction as the BOS signal.
You can use this indicator on anytime frame, however you will get more false signals on lower time frames, if you wish in these times, you can set the ATR to 3 or 4 to get less false signals. It is important to view the Daily Support and Resistance levels and the VWAP and 50MA these will be the main levels with highest Risk to Reward entries. You can then use lower time frames like the 5 or 1min to find break of structure indication to indicate the direction around the daily support and resistance, VWAP and 50MA.

Liquidity Engulfing & Displacement [MsF]Japanese below / 日本語説明は英文の後にあります。
-------------------------
*This indicator is based on upslidedown's "Liquidity Engulfing Candles ". It's a very cool indicator. thank you.
It has 2 functions: show the Liquidity Engulfing on HTF and candle color change when displacement occurs.
=== Function description ===
1. Liquidity Engulfing on HTF
This indicator gives Liquidity Engulfing signals not only for the current candle, but also for H4 and H1 on HTF.
You can use that a bullish engulfing on H1 is a BOS on m5 and on H4 is a BOS on m15. It uses the theory of stop hunt from ICT.
Also, It's possible to fire alert.
2. Displacement
Change the color display of the candlesticks when a bullish candleStick or bearish candleStick is attached. Furthermore, by enabling the "Require FVG" option, you can easily discover the FVG (Fair Value Gap). It is a very useful function for ICT trading.
When H1 candle takes liquidity from one side and moves with an explosive move to the other side of the previous candle (displacement), it creates break of market structure on M5. Entry on discount FVG or OTE with stop loss at or below the stop hunt wick.
=== Parameter description ===
- Liquidity engulfing candles(LEC) SETTING
- Show H1 LEC … Whether to show LEC for H1
- Show H4 LEC … Whether to show LEC for H4
- Show Current LEC … Whether to show LEC for current timeframe
- Apply Stop Hunt Wick Filter … Require candle wick into prior candle retracement zone
- Apply Close Filter … Require LL/HH on candle in order to print a valid engulfing signal
- DISPLACEMENT SETTING
- Require FVG … Draw only when FVG occurs
- Displacement Type … Displacement from open to close? or from high to low?
- Displacement Length … Period over which to calculate the standard deviation
- Displacement Strength … The larger the number, the stronger the displacement detected
-------------------------
2つの機能があります: 上位足のLiquidity engulfing(流動性獲得)を表示することと、大きな変位が発生したときにローソク足の色を変更することです。
=== 機能説明 ===
1. 上位足のLiquidity engulfing
このインジケーターは、現在のローソク足だけでなく、上位足の H4 および H1 に対してもLiquidity engulfingシグナルを提供します。
H1はm5、H4はm15での使用を推奨します。これはICTのストップハント理論を活用しています。また、アラートを発することも可能です。
2. 変位(DISPLACEMENT)
大きな陽線、陰線を付けた場合に、そのローソク足をカラー表示を変更します。
さらに"Require FVG"オプションを有効にすることで、FVG(Fair Value Gap)を容易に発見することができます。ICTトレードにを行うにあたり大変有用な機能となっています。
=== パラメータの説明 ===
- Liquidity engulfing candles(LEC) SETTING
- Show H1 LEC … H1のLECを表示するかどうか
- Show H4 LEC … H4のLECを表示するかどうか
- Show Current LEC … 現在の期間の LEC を表示するかどうか
- Apply Stop Hunt Wick Filter … ハラミ足、もしくは包み足になっている場合のみに検知させる
- Apply Close Filter … 1つ前のローソクよりも終値で超えていた場合のみに検知させる
- DISPLACEMENT SETTING
- Require FVG … FVG発生時のみ描画する
- Displacement Type … openからcloseまでの変位か?highからlowまでの変位か?
- Displacement Length … 標準偏差を計算する期間
- Displacement Strength … 変位の強さ(数字が大きいほど強い変位を検出)

SMC Toolkit |ASE|This indicator provides 10+ features all-in-one. Focusing on price action and Smart Money concepts, we have provided automated multi-timeframe features such as Market Structure(BOS / CHoCH) to identify trends, Fair Value Gaps to identify Imbalances, and much more.
Pure price action analysis is a preferred strategy over indicators due to their lag and noise. Many traders popularized SMC or “Smart Money” concepts to identify and trade like/with institutions or Smart Money traders. We have automated these features and made them multi-timeframe to simplify your charting process and advance your trading so you can efficiently trade.
Features:
The included price action features are listed below:
- Multi-Timeframe Market Structure (BOS, CHoCH, MSS, IDM)
- Trend based Candle Coloring
- Multichart (Extra time frame on the same chart)
- Multi-Timeframe Fair Value Gaps & Balanced Price Ranges
- Trapped Market Participants (Multi-Time Frame based on Orderblocks)
- SMT Divergences
- Volume Imbalances
- Premium Discount Array
- Displacement Candles
- Previous OHLC (Daily, Weekly, Monthly)
- VWAP and Std.Dev. Waves
Benefits & Examples:
In the image below we can see plenty of trade setups that formed in confluence with the features we were using. Displayed we have higher timeframe FVGs as our point of interests, Market Structure (Trend Bar Coloring) as our entry confirmation, and Liquidity Levels as our targets.
In this image we can see the same setup as before, higher timeframe FVG with Market Structure reversal targeting a Liquidity Level. In addition we can see the Trapped Market Participants feature showing trapped sellers at the low which provides additional confluence for our long position and offers a cleaner and safer entry on the pullback.
Our goal is to provide as many useful features as possible, automating the process to make it easier and quicker for us as traders. We want to spend less time charting and more time planning proper trades.
ICT HTF Liquidity Levels /w Alert [MsF]Japanese below / 日本語説明は英文の後にあります。
-------------------------
*This indicator is based on sbtnc's "HTF Liquidity Levels". It's a very cool indicator. thank you.
It has 3 functions: visualization of HTF liquidity (with alert), candle color change when displacement occurs, and MSB (market structure break) line display.
=== Function description ===
1. HTF liquidity (with alert)
Lines visualize the liquidity pools on the HTF bars. Alerts can be set for each TF's line.
Once the price reaches the line, the line is repaint.
To put it plainly, the old line disappears and a new line appears. The line that disappeared remains as a purged line. (It is also possible to hide the purged line with a parameter)
The alert will be triggered at the moment the line disappears. An alert will be issued when you touch the HTF's liquid pools where the loss is accumulated, so you can notice the stop hunting with the alert.
This alert is an original feature of this indicator.
The timeframe of the HTF can't modify. You can get Monthly, weekly, daily and H1 and H4.
Each timeframe displays the 3 most recent lines. By narrowing it down to 3, it is devised to make it easier to see visually. (This indicator original)
2. Displacement
Change the color display of the candlesticks when a bullish candle stick or bearish candle stick is attached. Furthermore, by enabling the "Require FVG" option, you can easily discover the FVG (Fair Value Gap). It is a very useful function for ICT trading.
3. MSB (market structure break)
Displays High/Low lines for the period specified by the parameter. It is useful for discovering BoS & CHoCH/MSS, which are important in ICT trading.
=== Parameter description ===
- HTF LIQUIDITY
- Daily … Daily line display settings (color, line width)
- Weekly … Weekly line display settings (color, line width)
- Monthly … Monthly line display settings (color, line width)
- INTRADAY LIQUIDITY
- 1H … 1H line display settings (color, line width)
- 4H … 4H line display settings (color, line width)
- PURGED LIQUIDITY … Display setting of the line once the candle reaches
- Show Purge Daily … Daily purged line display/non-display setting
- Show Purge Weekly … Weekly purged line display/non-display setting
- Show Purge Monthly … Monthly purged line display/non-display setting
- Show Purge 1H … 1H purged line display/non-display setting
- Show Purge 4H … 4H purged line display/non-display setting
- MARKET STRUCTURE BREAK - MBS
- Loopback … Period for searching High/Low
- DISPLACEMENT FOR FVG
- Require FVG … Draw only when FVG occurs
- Displacement Type … Displacement from open to close? or from high to low?
- Displacement Length … Period over which to calculate the standard deviation
- Displacement Strength … The larger the number, the stronger the displacement detected
-------------------------
このインジケータはsbtncさんの"HTF Liquidity Levels"をベースに作成しています。
上位足流動性の可視化(アラート付き)、変位発生時のローソク色変更、MSB(market structure break)ライン表示の3つの機能を有します。
<機能説明>
■上位足流動性の可視化
上位足の流動性の吹き溜まり(ストップが溜まっているところ)をラインで可視化します。ラインにはアラートを設定することが可能です。
一度価格がラインに到達するとそのラインは再描画されます。
平たく言うと、今までのラインが消えて新しいラインが出現する。という事です。
消えたラインはpurgeラインとして残ります。(パラメータでpurgeラインを非表示にすることも可能です)
アラートはラインが消える瞬間に発報します。上位足の損切り溜まってるところにタッチするとアラートを発報するので、アラートにてストップ狩りに気づくことができます。
このアラート発報については本インジケータオリジナルの機能となります。
表示可能な上位足のタイムフレームは固定です。月足、週足、日足およびH1とH4を表示することができます。
各タイムフレーム、直近から3つのラインを表示します。3つに絞ることで視覚的に見やすく工夫しています。(本インジケータオリジナル)
■変位発生時のローソク色変更
大きな陽線、陰線を付けた場合に、そのローソク足をカラー表示を変更します。
さらに"Require FVG"オプションを有効にすることで、FVG(Fair Value Gap)を容易に発見することができます。ICTトレードにを行うにあたり大変有用な機能となっています。
■MSB(market structure break)ライン表示
パラメータで指定した期間のHigh/Lowをライン表示します。ICTトレードで重要視しているBoS & CHoCH/MSSの発見に役立ちます。
<パラメータ説明>
- HTF LIQUIDITY
- Daily … 日足ライン表示設定(色、線幅)
- Weekly … 週足ライン表示設定(色、線幅)
- Monthly … 月足ライン表示設定(色、線幅)
- INTRADAY LIQUIDITY
- 1H … 1時間足ライン表示設定(色、線幅)
- 4H … 4時間足ライン表示設定(色、線幅)
- PURGED LIQUIDITY … 一度到達したラインの表示設定
- Show Purge Daily … 日足ライン表示/非表示設定
- Show Purge Weekly … 週足ライン表示/非表示設定
- Show Purge Monthly … 月足ライン表示/非表示設定
- Show Purge 1H … 1時間足ライン表示/非表示設定
- Show Purge 4H … 4時間足ライン表示/非表示設定
- MARKET STRUCTURE BREAK - MBS
- Loopback … High/Lowを探索する期間
- DISPLACEMENT FOR FVG
- Require FVG … FVG発生時のみ描画する
- Displacement Type … openからcloseまでの変位か?highからlowまでの変位か?
- Displacement Length … 標準偏差を計算する期間
- Displacement Strength … 変位の強さ(数字が大きいほど強い変位を検出)

Smart Money Essentials [TFO]This indicator utilizes “Smart Money Concepts” like liquidity, order blocks, premium & discount, and more to analyze price action.
What’s included in the initial release:
Market Structure
Liquidity
Displacement
Order Blocks
Premium / Discount
Confluence Table
Alerts
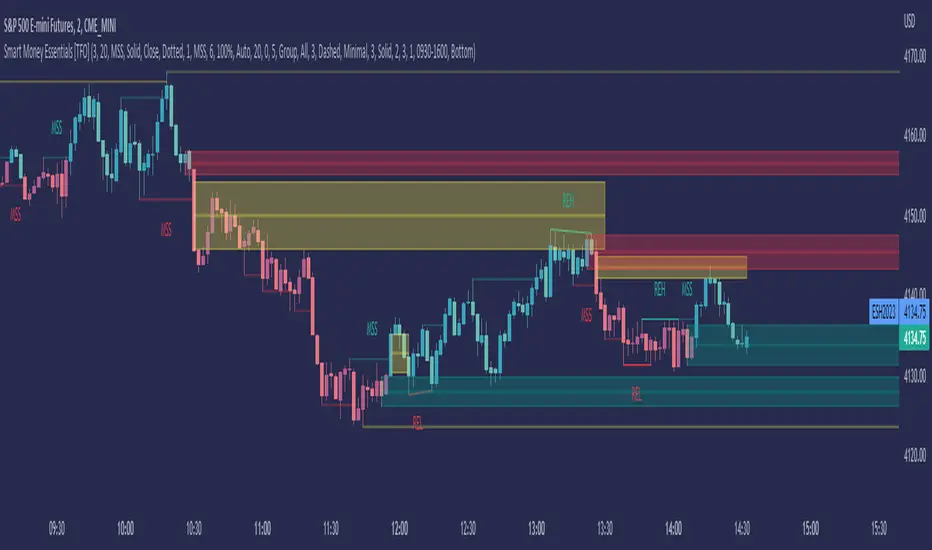
Market structure logic objectively identifies whether the current trend is bullish or bearish, based on swing highs and lows. Liquidity levels offer insight into major pivots where we can assume many traders may place their stop loss, which can also serve as areas where “Smart Money” may be accumulating or distributing positions.
Displacement adds to this by spotting rapid price movement, often accompanied by imbalances where price may come back to before continuing in the direction of the displacement. These can be filtered based on whether the imbalance is accompanied by a Break of Structure (BOS) or Market Structure Shift (MSS), which may give additional insight into the draw on liquidity.
Order blocks (OB’s) are detected and treated as areas that may offer support for price in an uptrend or resistance in a downtrend. Premium and discount zones are essentially fitted by an “auto-fib” retracement that looks at recent liquidity levels, and optionally offers areas to look for an Optimal Trade Entry (OTE) where price retraces between 62-79% of the preceding displacement leg.
The confluence table provides an organized place to visualize and identify where any of the above concepts may be present at or around the same time. We can implement a threshold where, if the number of selected factors meets or exceeds this threshold, we can potentially identify bullish and bearish opportunities where multiple layers of confluence are overlapping.
And of course, alerts are built in for all significant events related to the above concepts, for example: runs on liquidity, BOS and MSS, rejections from OB and OTE, etc.
Dashboard trendlines Price(ichimoku14642)Happy new year 2023
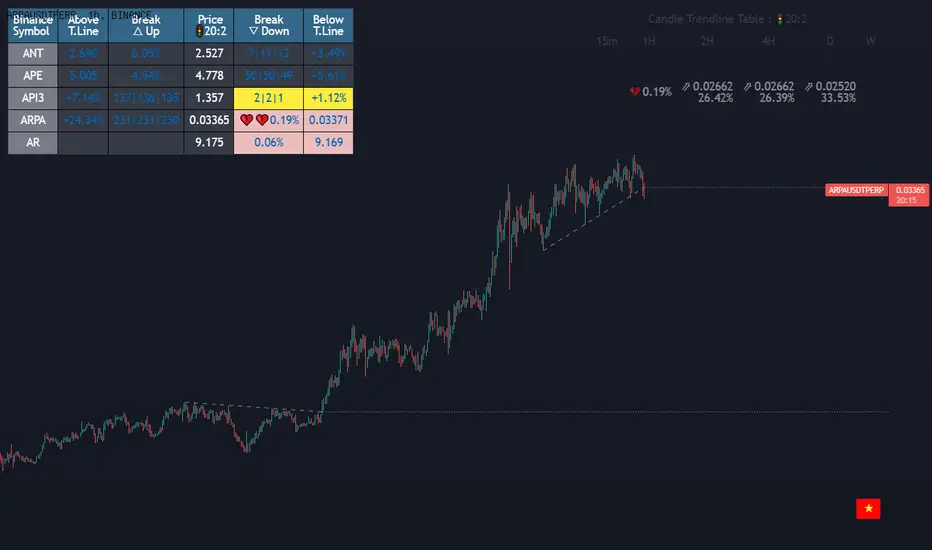
Dedicated to traders, the trendline indicator of 5 trading pairs is automatically listed in this table. Wish success
-on each chart of a trading pair, there is only one trendline pair: 1 uptrendline and 1 downtrendline
-so when the statistics on the table also show the column of the uptrend and the column of the downtrend
-When the price approaches any trendline but the ratio is 1%, that trendline will be colored blue (downtrend), red (uptrend)
-the column above T.line(below T.line) is the value of the current trendline compared to the closing price of the candle
-The Break up (Break down) column when the price breaks will show the green heart (break up), the red heart break (break down) and the percentage value when breaking through the point of the trendline.
-price column is the current price of the candle
-SYMBOL is all taken from Binance in the perpetual contract
-especially when a candle has closed above the trendline (assuming an uptrend), then from the 2nd tree to the current , it will count according to memory so that traders know when the price broke, and how many candles already.
-The breakdown parameter is displayed (for example, 3|8|10), which means that the price has broken through 10 candles, of which 8 trees are closing above the breakout point, and the last 3 are closing above. break point
-In addition, when displaying 3 parameters as above, the next column (above/below T.line) will display the percentage from when the price breaks that point to the current price of the candle.
Thank you everyone for your interest and trust
Đây là script về bảng thống kê đường trendline .
-trên mỗi biểu đồ của cặp giao dịch chỉ tồn tại duy nhất 1 cặp trendline là: 1trendline tăng và 1 trendline giảm
-vì vậy khi thống kê trên bảng cũng hiển thị cột của trend tăng và cột của trend giảm
-khi giá tiến gần đến 1 đường trendline bất kì mà tỉ lệ còn 1% thì đường trendline đó tô màu xanh(trend giảm) ,màu đỏ(trend tăng)
-cột above T.line(below T.line) là giá trị của đường trendline hiện tại so với giá đóng cửa của nến
-cột Break up(Break down) khi giá phá vỡ sẽ thể thiện trái tim xanh(phá vỡ lên),trái tim đỏ vỡ(phá vỡ xuống) và giá trị phần trăm khi phá qua điểm của trendline.
-cột giá là giá hiện tại của nến
-SYMBOL là toàn bộ lấy của sàn Binance trong hợp đồng vĩnh cửu
-đặc biệt khi 1 cây nến đã đóng cửa trên đường trendline(giả sử trend tăng) thì từ cây thứ 2 đến hiện tại nó sẽ đếm theo bộ nhớ để các trader biết được giá đã phá khi nào,và qua bao nhiêu nến rồi.
-thông số khi phá vỡ hiển thị (ví dụ là 3|8|10) thì hiểu là giá đã phá vỡ qua 10 nến, trong đó có 8 cây đóng cửa trên điểm phá vỡ,và 3 cây gần nhất đang đóng cửa trên điểm phá vỡ
-ngoài ra khi hiện 3 thông số như trên thì cột bên cạnh (above/below T.line) sẽ hiển thị được số phần trăm tính từ khi giá phá vỡ điểm đó đến giá hiện tại của cây nến.
Cảm ơn mọi người đã quan tâm và tin dùng
Fsystem Pivot 1453Hello
The purpose of this script, for long and short investments, first determines a bullish or bearish area and draws a horizontal support, resistance and level zone.
You will be able to see the alignment of the symbols you follow to the past pivot lines and all the pivots ahead at the last bar.
Whichever level the symbol comes to, it draws 3 automatic pivots on that level area.
Among the options, you can color the bars on the period you are working on, whether any period is bull or bear.
And if you tick the show terms pivot option, you can see the smallest pivots in the first entries to the bull or bear area. 1 minute period and 5 periods will also be useful for traders.
Our goal is to make the community the best in mindful graphic reading.
Our scripts never promise you gain and maybe even harm, it requires you to be self-sacrificing
Content usage details are explained on the picture.
pivot 1453 scripti uzun vadeli trade için size ayı veya boga alanı oluşturup ,alanın başlangıcı fiyatların hangi level de oldugunu gosteren ve her pivot arasına 3 adet ek pivotu fiyatın oldugunu levele gore çizen ,destek ve direnç olarak kullanmanızı saglayan , pivot sistemimizdir.
Seçenekler arasında
1 dakika ve 5 dakika periyotlarda alan değişimine gore kısa periyot çizdirme seçeneğimiz mevcuttur.
Hangi periyotun boga veya ayıda oldugunu ,çaliştiğınız herhangi periyotta barlara göre renklendirebilirsiniz.
Scriptimiz topluluğun grafik yorumlama gücünü arttırmak içindir.
Bu script sizlere kazanç vaad etmez ve maddi zarar verebilir.
You can see whether the lower period you selected is bull or bearish according to the bar color. For example, the change of 5 minutes in the day chart is red bear, blue bull.
seçtiğiniz alt periyodun bar rengine göre boğa veya ayı mı oldugunu gorebilirsiniz. örneğin ,gün grafik içinde 5 dakikanın değişimi kırmızı ayı,mavi boğa dır.
By checking the showshortterm option, you can open the first short periods of bull or bear transitions. 4% profit can be used for 1 and 5 minutes in very short time periods.
showshortterm seçeneğini işaretleyerek ,boga veya ayı alana geçişlerin ilk kısa periyotlarını açabilirsiniz. daha çok kısa zaman dilimlerinde 1 ve 5 dakika için %4 lük kar amaçlı kullanılabilir.
If you mark the showema option, it will add ema 60, ema 360 and ema 270 lines to you.
showema seçeneği işaretlerseniz,size ema 60 ema 360 ve ema 270 çizgilerini ekler,dilerseniz ema ların altında satış yönlü üzerinde alış yönlü kullanabilirsiniz.

FxCanli Harmonic SniperEN - TradingView FxCanli HARMONIC SNIPER indicator can draw 9 different patterns on your charts and also give alerts when any pattern triggered, hit Stop and TP levels.
TR - TradingView FxCanlı HARMONIC SNIPER İndikatörü , grafiklerinizde 9 ayrı formasyonu çizer ve Formasyon aktif olduğunda ve Hedef / Stop seviyelerine ulaştığında alarm verir.
PATTERNS / FORMASYONLAR
* Gartley
* Bat
* Butterfly
* Crab
* Cypher
* AB=CD
* Libra
* PRJ
* 2618
FEATURES & EXAMPLES / ÖZELLİKLER & ÖRNEKLER
**************************************************************
Multi Language / Çok Dil
EN - You can get alerts in English or Turkish language
TR - Alarmları İngilizce veya Türkçe olarak alabilirsiniz.
Wave Type / Dalga Tipi
EN - You can choose the wave types, Small or Medium or Small+Medium
TR- Dalga tipini seçebilirsiniz. Small veya Medium veya Small+Medium
Pattern Number / Formasyon Sayısı
EN - As a default it shows one Bullish and one Bearish pattern, you can set it 2 or more and also you may just want it to show just Bullish or Bearish Patterns
TR - Varsayılan olarak bir Boğa ve bir Ayı formasyonu gösterir, 2 veya daha fazla olarak da ayarlayabilirsiniz ve ayrıca sadece Boğa veya Ayı Formasyonu göstermesini isteyebilirsiniz.
Pattern and Trade Levels Settings / Formasyon ve İşlem Seviyeleri Ayarları
EN - You can set size, color, line type of any trade levels. Also you can choose to show the name and price of the patterns and trade levels.
TR - Herhangi bir işlem seviyesinin boyutunu, rengini, çizgi türünü belirleyebilirsiniz. Ayrıca Formasyonların ve işlem seviyelerinin adını ve fiyatını göstermeyi seçebilirsiniz.
Backtest / Geriye Dönük Test
EN - You can make backtest of any pattern
TR - Herhangi bir formasyonun geriye dönük testini yapabilirsiniz

FxCanli PRZEN - FxCanli PRZ indicator shows Price Reversel Zones on your charts.
TR - FxCanli PRZ indikatörü grafiklerinizde olası dönüş bölgelerini gösterir.
FEATURES & EXAMPLES / ÖZELLİKLER & ÖRNEKLER
**************************************************************
Multi Language / Çok Dil
EN - You can get alerts in English or Turkish language
TR - Alarmları İngilizce veya Türkçe olarak alabilirsiniz.
Bullish - Bearish PRZ / Boğa - Ayı yönlü PRZ
EN - You can choose Bullish and Bearish PRZ or either
TR - Boğa ve Ayı yönlü veya herhangi birini seçebilirsiniz
Buy - Sell Labels / Al -Sat Etiketleri
EN - You can see (S)ell label and (B)uy label at the end of Price Reversal Zones
TR - Olası Dönüş Bölgelerinin sonunda (S)ell-Sat etiketini ve (B)uy-Al etiketini görebilirsiniz.
Panel Properties / Panel Özellikleri
EN - In the panel settings, you can follow up with different characters and emojis when you enter the PRZ, at the PRZ and exit from PRZ.
TR - Panel ayarlarında, olası dönüş bölgesine girdiğinde, olası dönüş bölgesinde ve olası dönüş bölgesinden çıktığını faklı karakter ve emojiler ile takip edebilirsiniz
Multi Timeframe / Çoklu Zaman dilimi
EN - You can easly follow all timeframes at one chart
TR - Tüm zaman dilimlerini tek bir grafikte takip edebilirsiniz
Alerts / Alarmlar
EN - You can set only one alert for all timeframe and all prz alerts
TR - Bir alarm kurarak, tüm zaman dilimlerinde PRZ alarmlarını alabilirsiniz

Smart Money Concepts(v0.01) - SoldiSmart Money Concepts
We are very pleased to be releasing our latest addition to the Soldi tools, called Smart Money Concepts. What this indicator was built to be is a guideline and tool to help a trader develop the mental mind state of a Smart Money Trader. Picking up on the digital footprints that they might have missed! This is our first iteration of this tool but we have so so much more coming to bring to this tool! So much that we might need to release 2 scripts to be able to efficiently fit it all in. As always Soldi/MMCFX always try to raise the bar on what is possible with PineScript and what advanced concepts we can bring to the retail market with ease, this project was insanely fun trying to get together and we spent a lot of months talking with and doing sessions with very well versed traders who only specialize and solely trade live with Smart Money/ICT Concepts. After many months of talking with and working with these traders we believe we have put together a very unique tool that any SMC trader would love to have in their tool belt.
What is Smart Money Concepts?
Smart Money Concepts (SMC) is the practice of trying to track the digital footprints left by Market Makers and large money traders like Institutional bodies and brokers. I believe this concept was originally developed by Inner Circle Trading (ICT), who has some great great content for free on YouTube. To my knowledge he was the father of the concepts being taken mainstream to retail individuals. Since then, there has been many other who have released content on these theories. For the sake of congruency we have only developed these tools based off the knowledge and practices taught by ICT.
What is Included within this tool?
What is currently Included with this tool are the following.
Market Structure - This includes Break of Structures (BOS) and Change of Characters (CHoCH), It was really important for us to define the different shifts that SMC traders track and follow so we built a unique customizable system that allows the traders to track these Market Structure shifts in real-time. Part of this module includes the option to plot the High/Low labels, by putting this settings on you will mark out the swing points as their respective Higher High(HH), High Low(HL), Lower Low(LL) and Lower High(LH) . This feature is a great way to help familiarize yourself with spotting these instances, there is a slight lag due to the nature of the calculations for tracking the Swing Points. By default we track 4 left bars and 4 right bars, on the 5th bar if the swing point returns true you will see the label plot itself. If you have a higher bar count you will need to wait till x+1 to see the label be plotted. eg. 7 bar count on the left and right, you will need to wait till the 8th bar to see the label be plotted.
By changing the bar counts you also change how the Market Structure module picks up the Market shifts (BOS/CHoCH)
4 bar left, 4 bar right example:
7 bar left, 7 bar right example:
Liquidity Sweep - This part of the Market Structure module is still being worked on and built out, this feature is meant to help a trader identify potential liquidity sweeps that have taken place past or present by switching the bar color to the user defined color (default yellow). There are many different types of liquidity sweeps that can take place and we are still working on the different profiles of these! More profiles will be added to the the updates in the future to help identify these potential trade areas
Liquidity Sweep example:
Trend Bars - This part of the Market Structure module helps traders identify structure trends based on the breaks of existing structure. Again this will shift as you play with the bar count settings, low bar count will identify faster swing points and shifts where as higher bar counts will identify longer term structures. By having this setting on it will change the bar colors to Red(Bearish) or Blue(Bullish) by default, we recommend to change your candles border settings to make this more visible.
7 bar left, 7 bar right. With High Low Labels and Trend Bars
Fair Value Gaps - This module will track the Fair Value Gaps and Imbalances that will take place in real-time. Once the final candle closes it will plot the FVG. Unlike other FVG indicators on TradingView we hold and store ALL the FVG's that take place, other indicators will only hold on to x amount of the FVG's and as new ones enter the list the old ones get bumped out. We didn't like this idea, so what we did was instead store all of the FVG's but create a threshold to where they would be plotted, eg. if you set the threshold to 4% it will only show you the FVG's within a 4% range from the current price. This way you still have access to all the data with out compromising but it helps you focus on the current data at hand.
Fair Value Gap/Imbalance - 3% threshold example
Fair Value Gap/Imbalance - 8% threshold example
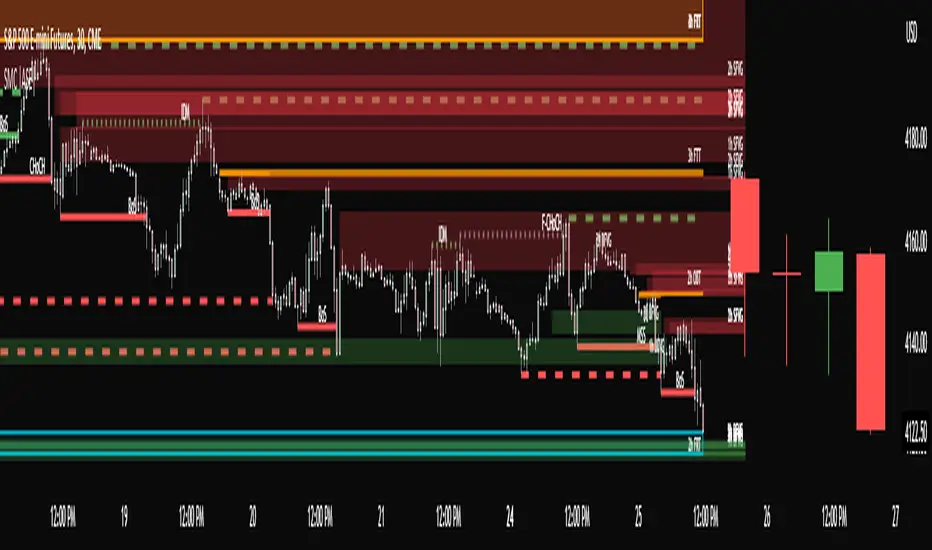
Order Blocks - This was an especially interesting module to build, just like the FVG's we found that a lot if not all the authors on TradingView haven't actually been coming close to tracking and plotting true ICT style Order blocks. We set out to change that though, again through a unique approach we have built this Order Block indicator. To also comment on the other scripts out there that claim to track Order Blocks, not a SINGLE script mentions anything about Validated Order Blocks , which was especially important to all the SMC traders I have talked to and had help from building this indicator. Just like the FVG piece this also has a 'threshold' plot, but not only that it gives you the option to look at "No Validation" and "Validated" Order Blocks. With soon another style of Validation to choose from. If you choose the "Validated" option the script will actively seek Order Blocks that have a POI/liquidity sitting above it. I also want to make it clear that based on your bar count settings the order blocks will differ, as they are also based from structure breaks!
Order Blocks with "No Validation" example
Order Blocks with "Validation" example
Advanced Session Tracking - We always seek to out do what has been done and what we have already done, that being said we built our Advanced Session Tracking module to follow each user define Session's Open, High, Low, Close, Liquidity threshold and extend that into the next session . As per our last KillZone indicator we also included the Forward Plotting feature which will plot the defined sessions 24 hours in advance vs only showing you real time. Many if not all Session tracking tools on TradingView only show you real-time and in the past when the define sessions are but we find that to be a very silly practice because as SMC traders you know how important it is the relation between time and price. Instead of reacting to the sessions you and prepare for the sessions ahead of time anticipating when price might react to time.
note: There is a small bug with tracking the crypto based sessions, this is working to be fixed for the next update, check the release notes to see when the fix occurs
Session Background plots with forward plotting example
Session Backgrounds with High/Lows and Liquidity range example
What is to come with the updates?
We are always looking to improve anything, even if it is just a fraction better. That is why we are continuing to work with our SMC traders to refine the concepts, profiles, coding as well as the logic behind the calculations.
Here is a list of what we are planning and working on to be released in the updates to come!
Intra-Day Profiling - Each day has a profile, what we want to achieve is to track and predict these profiles
Liquidity Scanner - There are different types of liquidity that form and we want to be able to find and track these
Smart Trend Alerts - We want to combine quant methods into SMC to provide high probability trade ideas
User Suggestions - We are always open to work with the community to bring features they want
If it's not Soldi, it isn't money

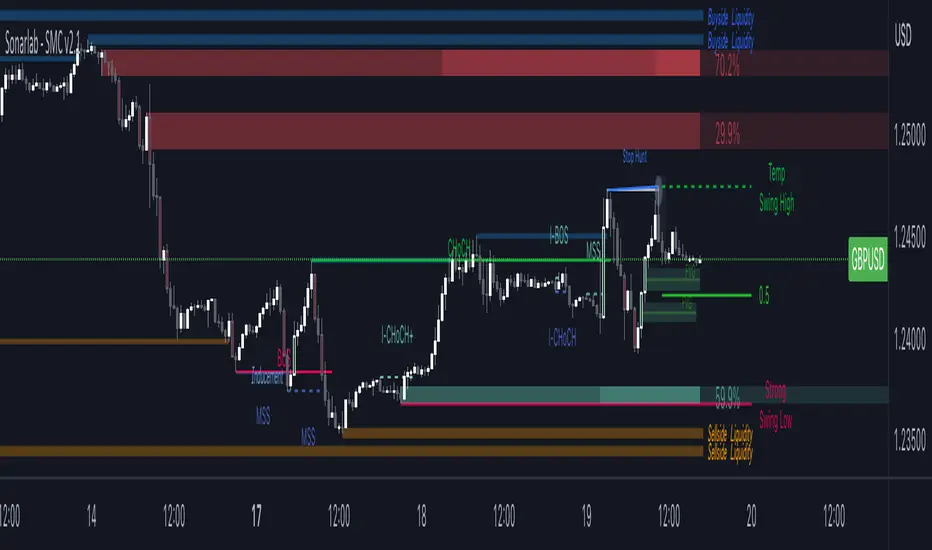
Sonarlab - Smart Money ConceptsSupply and Demand is one of the core strategies used in trading. It focuses on the ancient laws of supply and demand and how price moves in a free-flowing market. Supply and demand zones are a popular analysis technique used in all kinds of trading styles. The zones are the periods of sideways price action that come before explosive price moves, and are typically marked out using a box. We wanted to make these squares drawn automatically for you - so it will save you time spotting the zones.
Green Box
The green box defines demand - in these areas you will look for long opportunities. You can also use these zones for take profit levels when you are in a sell trade.
Blue Box
The blue box defines supply - in these areas you will look for short opportunities. You can also use these zones for take profit levels when you are in a buy trade.
Break of structure
For markets to move up and down a break in market structure must occur. A break in market structure occurs when the market begins to shift direction and break the previous HH and HL or HL and LL of the market. We also integrated the feature that you can see the BOS lines. In the indicator settings you can adjust the values:
1) Sensitivity
2) Min. candles in structure
3) BOS type: close or wick
Warning Never blindly take a position on each box - wait for a proper signal to occur before considering a position.
Comprehensive Market AnalyzerVERSION 2.0:
Notice to users: To better reflect its extensive features, this indicator has been renamed from "Tsūrubokkusu (Toolbox) 🧰" to "Comprehensive Market Analyzer". Thank you for your understanding and adaptation to this change.
Purpose and Usage:
The Comprehensive Market Analyzer is designed to provide traders with a holistic view of market conditions by integrating various technical indicators into a single,
cohesive tool. Each indicator has been carefully selected and improved to work together, offering enhanced customization and advanced market insights.
This combination allows for more comprehensive market analysis, improved decision-making, and efficient trading strategies.
📘 Machine Learning Integration
Purpose : Utilizes machine learning algorithms to analyze past market data and provides predictive insights based on historical data.
Usage : Activate machine learning features, set lookback windows, influence weighting, and start bar for improved trend predictions.
Activate Machine Learning :
Description : Enables advanced machine learning features that analyze past market data.
Details : This feature allows the algorithm to use historical data to forecast market movements, providing traders with enhanced predictive insights on historical data.
Kernel Lookback Window :
Description : Sets the number of previous bars that the algorithm will analyze.
Details : A higher number provides a broader view of market trends, while a lower number makes the model more sensitive to recent changes.
Kernel Influence Weighting :
Description : Adjusts the emphasis on recent versus older data.
Details : Increasing this value gives more importance to recent data, potentially making predictions more responsive to new trends.
Kernel Calculation Start Bar :
Description : Specifies the bar number from which to start the machine learning calculations.
Details : Avoids early data which may contain excessive noise and less reliable market signals.
Kernel Functions :
Gaussian Kernel :
Description : Uses a Gaussian distribution to weight historical data, focusing on more recent data points for trend analysis.
Details : Calculates weights based on the Gaussian distribution, emphasizing data points closer to the present.
Laplacian Kernel :
Description : Applies Laplacian distribution, emphasizing data points closer to the current time more heavily.
Details : Uses the Laplacian function to provide a different perspective on data weighting.
RBF Kernel :
Description : Utilizes a Radial Basis Function for smoothing and analyzing data, providing a different approach to trend prediction.
Details : Applies the RBF function to smooth data and enhance the accuracy of trend predictions.
Wavelet Kernel :
Description : Applies wavelet transform for analyzing frequency components, helping to detect patterns in the price movements.
Details : Uses wavelet-based calculations to focus on specific frequency components within the data, aiding in pattern recognition.
📘 Enhanced Ichimoku Kinkō Hyō Integration
Purpose : Provides a comprehensive overview of market trends and momentum using the Ichimoku Kinkō Hyō indicator.
Usage : Display various components of the Ichimoku Kinkō Hyō, customize their appearance, provides additional calculations for trend analysis.
Display Ichimoku Kinkō Hyō :
Description : Toggle to show or hide the Ichimoku Kinkō hyō indicator.
Details : This indicator helps traders see support and resistance levels, trend direction, and potential future movements.
Activate Heikin-Ashi Source :
Description : Switches between regular price data and Heikin-Ashi candles for analysis.
Details : Heikin-Ashi candles smooth price data, making trends easier to spot.
Display Tenkan-Sen Line :
Description : Shows the Tenkan-Sen line, a key short-term trend indicator.
Color Customization : Set the color of the Tenkan-Sen line for better visibility.
Minimum Length : Determine the shortest period for calculating the Tenkan-Sen line.
Maximum Length : Determine the longest period for calculating the Tenkan-Sen line.
Dynamic Length Adjustment : Automatically adjusts the length of the Tenkan-Sen based on market conditions.
Display Kijun-Sen Line :
Description : Shows the Kijun-Sen line, a key medium-term trend indicator.
Color Customization : Set the color of the Kijun-Sen line for better visibility.
Minimum Length : Determine the shortest period for calculating the Kijun-Sen line.
Maximum Length : Determine the longest period for calculating the Kijun-Sen line.
Dynamic Length Adjustment : Automatically adjusts the length of the Kijun-Sen based on market conditions.
Kijun-Sen Divider Tool : Adjust the sensitivity of the Kijun-Sen calculation.
Display Chikou Span :
Description : Shows the Chikou Span, which lags behind the current price to help confirm trends.
Bear Phase Color : Set the color for bearish periods.
Bull Phase Color : Set the color for bullish periods.
Consolidation Color : Set the color for consolidation periods.
Minimum Length : Determine the shortest lag period for the Chikou Span.
Maximum Length : Determine the longest lag period for the Chikou Span.
Dynamic Length Adjustment : Automatically adjusts the length of the Chikou Span based on market conditions.
Display Senkou Span A and B :
Description : Shows the Senkou Span A and B, which form the Ichimoku Cloud indicating future support and resistance levels.
Bear Color : Set the color for bearish clouds.
Bull Color : Set the color for bullish clouds.
Neutral Color : Set the color for neutral periods.
Minimum Length : Determine the shortest period for calculating the Senkou Span.
Maximum Length : Determine the longest period for calculating the Senkou Span.
Dynamic Length Adjustment : Automatically adjusts the length of the Senkou Span based on market conditions.
Projection Offset : Set how far ahead the Senkou Span is projected.
Kumo Cloud Settings :
Enable Kumo Cloud Fill : Toggle to fill the space between Senkou Span A and B with color.
Cloud Fill Transparency : Adjust the transparency of the cloud fill.
Apply WMA Smoothing :
Description : Smooths the indicator lines using a Weighted Moving Average to clarify trends.
Bar Coloring Based on Ichimoku Signals :
Description : Colors the bars based on Ichimoku signals to provide a quick visual indication of market sentiment.
Bearish Signal Bar Color : Set the color for bars during bearish signals.
Bullish Signal Bar Color : Set the color for bars during bullish signals.
Consolidation Signal Bar Color : Set the color for bars during consolidation periods.
Neutral Bar Color : Set the color for bars during neutral conditions.
Enhanced Calculations :
Heikin Ashi Values : Smooths price movements to make trends more visible.
Alternative Source Calculation : Uses a different method for calculating the indicator based on user settings.
Volume Calculations : Enhanced functions for calculating volume based on different candlestick patterns.
Dynamic Length Adjustment : Automatically adjusts the length of Ichimoku components based on market volatility.
Gaussian Kernel Calculations : Uses advanced calculations for smoother and more accurate trend analysis.
Chikou Span Adaptation : Improved calculation for the Chikou Span using dynamic lengths and advanced methods.
Visual Enhancements : Adds color gradients to the Senkou Span and dynamic coloring for the Chikou Span to improve trend visibility.
Plotting Ichimoku Components :
Tenkan-Sen : Plots the Tenkan-Sen line with dynamic adjustments.
Kijun-Sen : Plots the Kijun-Sen line with dynamic adjustments.
Senkou Span A and B : Plots these lines with dynamic projections and advanced smoothing.
Chikou Span : Plots the Chikou Span with dynamic offsets and coloring.
📘 Enhanced Candlestick Patterns Integration
Purpose : Identifies and displays various candlestick patterns to help traders spot key market movements and potential reversals.
Usage : Toggle the display of patterns, select specific pattern types, and customize pattern labels for improved visual analysis.
Display Patterns :
Description : Toggle to enable or disable the display of all candlestick patterns.
Details : When enabled, all selected candlestick patterns will be displayed on the chart, aiding traders in identifying key market movements and potential reversals.
Select Pattern Type :
Description : Select the type of candlestick patterns to detect.
Details : Options include Bullish (indicating potential upward trends), Bearish (indicating potential downward trends), or Both.
Trend Filter Method :
Description : Select the method to filter trends.
Details : Options include True Range (based on price range), Fractals, Volume, Combined, or None (no filtering).
Pattern Label Colors :
Bullish Pattern Color : Choose the color for labeling Bullish patterns, indicating potential upward trends.
Bearish Pattern Color : Choose the color for labeling Bearish patterns, indicating potential downward trends.
Indecision Pattern Color : Choose the color for labeling Indecision patterns, indicating no clear trend direction.
Base Line and Patterns Display Options :
Show Base Line in Place of Labels : Toggle to display a base line instead of labels for detected patterns. This helps visualize the general trend.
Show Counterattack Lines : Toggle to display Counterattack Lines patterns, indicating potential reversal points.
Show Dark Cloud Cover : Toggle to display Dark Cloud Cover patterns, a bearish pattern suggesting a potential reversal from an uptrend to a downtrend.
Show Engulfing Patterns : Toggle to display Engulfing patterns. Bullish Engulfing patterns suggest a potential upward reversal, while Bearish Engulfing patterns suggest a potential downward reversal.
Show Hammer Patterns : Toggle to display Hammer patterns, a bullish pattern indicating a potential reversal from a downtrend to an uptrend.
Show Hanging Man Patterns : Toggle to display Hanging Man patterns, a bearish pattern indicating a potential reversal from an uptrend to a downtrend.
Show Harami Patterns : Toggle to display Harami patterns. Bullish Harami patterns suggest a potential upward reversal, while Bearish Harami patterns suggest a potential downward reversal.
Show In-Neck Patterns : Toggle to display In-Neck patterns, indicating a potential continuation of the current trend.
Show On-Neck Patterns : Toggle to display On-Neck patterns, indicating a potential continuation of the current trend.
Show Piercing Patterns : Toggle to display Piercing patterns, a bullish pattern suggesting a potential reversal from a downtrend to an uptrend.
Show Three Black Crows : Toggle to display Three Black Crows patterns, a bearish pattern suggesting a potential reversal from an uptrend to a downtrend.
Show Thrusting Patterns : Toggle to display Thrusting patterns, a bearish pattern suggesting a potential continuation of the downtrend.
Show Upside Gap Two Crows : Toggle to display Upside Gap Two Crows patterns, a bearish pattern suggesting a potential downward reversal after an upward gap.
Show Evening Star : Toggle to display Evening Star patterns, a bearish pattern suggesting a potential reversal from an uptrend to a downtrend.
Show Inverted Hammer : Toggle to display Inverted Hammer patterns, a bullish pattern suggesting a potential reversal from a downtrend to an uptrend.
Show Morning Star : Toggle to display Morning Star patterns, a bullish pattern suggesting a potential reversal from a downtrend to an uptrend.
Show Shooting Star : Toggle to display Shooting Star patterns, a bearish pattern suggesting a potential reversal from an uptrend to a downtrend.
Show Doji Patterns : Toggle to display Doji patterns, indicating market indecision and potential reversals.
Show Dragonfly Doji : Toggle to display Dragonfly Doji patterns, a bullish pattern suggesting a potential reversal from a downtrend to an uptrend.
Show Evening Doji Star : Toggle to display Evening Doji Star patterns, a bearish pattern suggesting a potential reversal from an uptrend to a downtrend.
Show Gravestone Doji : Toggle to display Gravestone Doji patterns, a bearish pattern suggesting a potential reversal from an uptrend to a downtrend.
Show Long-Legged Doji : Toggle to display Long-Legged Doji patterns, indicating high market indecision and potential reversals.
Show Morning Doji Star : Toggle to display Morning Doji Star patterns, a bullish pattern suggesting a potential reversal from a downtrend to an uptrend.
Show Rising Three Methods : Toggle to display Rising Three Methods patterns, a bullish pattern suggesting a continuation of the uptrend.
Show Falling Three Methods : Toggle to display Falling Three Methods patterns, a bearish pattern suggesting a continuation of the downtrend.
Show Tasuki Patterns : Toggle to display Tasuki patterns, indicating potential trend continuation after a gap.
Show Marubozo : Toggle to display Marubozo patterns, indicating strong trend continuation, either bullish or bearish.
Show Long Lower Shadow : Toggle to display Long Lower Shadow patterns, indicating strong buying pressure and potential upward movement.
Show Long Upper Shadow : Toggle to display Long Upper Shadow patterns, indicating strong selling pressure and potential downward movement.
Show Three Inside Up/Down : Toggle to display Three Inside Up/Down patterns, indicating potential bullish or bearish reversals.
Show Kicker Pattern : Toggle to display Kicker patterns, indicating significant potential reversals.
Show Tweezer Tops/Bottoms : Toggle to display Tweezer Tops/Bottoms patterns, indicating potential reversals at the tops or bottoms.
Show Mat Hold Pattern : Toggle to display Mat Hold patterns, a bullish pattern suggesting a continuation of the uptrend.
Candle Body/Shadow Comparison Options :
Candle Body/Shadow Comparison : Choose the criteria to compare candle sizes: Shadows (larger shadows), Body (larger body), Both (larger shadows and body), Either (larger shadows or body), or None (no comparison).
Look-back Period for Candle Comparison : Specify the number of periods to look back when comparing the current candle size to determine if it is significant.
Period for Body Length Average : Specify the period for calculating the average body length of candles to help identify significant patterns.
Period for Candle Length Average : Specify the period for calculating the average length of candles to help identify significant patterns.
Specific Pattern Thresholds :
Doji Body Percentage Threshold : Set the percentage threshold for identifying Doji patterns based on the candle body size compared to its range.
Upper Shadow Percentage Limit : Set the maximum allowed upper shadow percentage of the candle’s range for identifying specific Doji patterns.
Lower Shadow Percentage Limit : Set the maximum allowed lower shadow percentage of the candle’s range for identifying specific Doji patterns.
Price Deviation Tolerance : Specify the price deviation tolerance for pattern recognition, which helps in identifying patterns within a certain price range.
Thrusting Neck Percentage : Set the percentage threshold for identifying Thrusting Neck patterns, indicating a potential continuation of the current trend.
Base Line Settings :
Base Line EMA Length : Specify the length of the EMA for the Base Line, helping to visualize the general trend.
Enhanced Calculations :
Wavelet Transform : If machine learning is enabled, calculates the wavelet transform for smoother and more accurate pattern detection.
Candle Body and Shadows Calculation : Detailed calculations for candle body and shadow lengths to improve pattern detection.
Average Calculations : Calculate averages for body and candle sizes to help identify significant patterns.
Fractals Calculation : Identify fractal highs and lows to aid in trend detection.
Trend Filters : Apply user-selected trend filters based on True Range, Fractals, Volume, or a combination.
Pattern Detection and Labeling : Detects and labels various candlestick patterns, including Doji, Engulfing, Hammer, and more, with options for displaying labels or base lines.
Alerts and Notifications : Set alerts for detected patterns and base line colors to notify traders of significant market events.
Plotting Candlestick Patterns :
Pattern Detection : Automatically detects and labels various candlestick patterns based on user settings.
Label Customization : Customize the labels for different patterns, including color and text.
Base Line Plotting : Option to plot a base line instead of labels for detected patterns, enhancing trend visualization.
Alerts for Patterns : Set alerts for detected patterns to keep traders informed of significant market changes.
📘 Enhanced Fibonacci Retracement Integration
Purpose : Provides a tool for identifying potential support and resistance levels using Fibonacci retracement.
Usage : Toggle the display of Fibonacci levels, adjust the lookback period, and customize the appearance of Fibonacci levels for better market analysis.
Auto Mode :
Description : Toggle to enable or disable automatic detection of price points.
Details : When enabled, the highest and lowest price points within a specified period will be automatically detected to set Fibonacci levels. Disable to manually set the top and bottom prices.
Period :
Description : Set the lookback period for detecting price points.
Details : Defines the number of bars to look back when detecting the highest and lowest prices in Auto Mode, used for calculating Fibonacci levels.
Manual Top :
Description : Manually set the top price level.
Details : Adjust this setting to reflect the peak price of interest when Auto Mode is disabled.
Manual Bottom :
Description : Manually set the bottom price level.
Details : Adjust this setting to reflect the low price of interest when Auto Mode is disabled.
Display Fibonacci :
Description : Toggle to show or hide Fibonacci retracement levels.
Details : When enabled, the calculated Fibonacci levels will be displayed on the chart, overlaying the price data.
Baseline Levels :
Description : Select Fibonacci levels to highlight as baselines.
Details : Choose specific levels to be visually distinct, emphasizing their significance in the analysis.
Fibonacci Levels Colors :
Upper Levels Color : Set the color for Fibonacci levels above the baseline, indicating potential resistance levels.
Lower Levels Color : Set the color for Fibonacci levels below the baseline, indicating potential support levels.
Baseline Levels Color : Set the color for highlighted baseline Fibonacci levels, making them stand out from other levels.
Display Individual Fibonacci Levels :
Show Level : Toggle to enable or disable the display of specific Fibonacci levels.
Level Value : Set the multiplier used to calculate each specific Fibonacci level relative to the price range.
Reverse Levels :
Description : Toggle to switch the calculation direction of Fibonacci levels.
Details : When enabled, levels are calculated in reverse, useful for analyzing downtrends.
Line Extension :
Description : Choose how Fibonacci level lines are extended on the chart.
Details : Options include extending lines to the left, right, or both, affecting their visual presentation.
Text Size :
Description : Adjust the font size of the labels for Fibonacci levels.
Details : Options range from large to tiny, allowing for readability adjustments according to user preference.
Line Style :
Description : Select the line style for Fibonacci levels.
Details : Options include solid, dotted, and dashed, providing visual distinction.
Line Width :
Description : Set the thickness of the Fibonacci level lines.
Details : A higher value makes the lines more prominent on the chart.
Baseline Line Style :
Description : Choose the line style specifically for the baseline levels.
Details : This can differ from other Fibonacci levels to emphasize their importance.
Baseline Line Width :
Description : Adjust the thickness of the baseline level lines.
Details : Can be set differently from other levels for visual emphasis.
Enhanced Calculations :
Automatic and Manual Top/Bottom Setup : Detect or manually set the highest and lowest price points.
Price Range Calculation : Determine the range between the highest and lowest prices.
Fibonacci Level Values : Calculate the values for each Fibonacci level.
Visual and Label Configuration : Configure visual aspects and labels for each level.
Plotting and Labeling :
Level Plotting :
Description : Plot each Fibonacci level on the chart.
Details : Draw lines representing each calculated level.
Label Customization :
Description : Customize the labels for Fibonacci levels.
Details : Include text, colors, and positioning for clarity.
📘 Supports and Resistances Integration
Purpose : Identifies key support and resistance levels to aid in market analysis.
Usage : Toggle the display of support and resistance lines, customize their appearance, and use Bollinger Bands for additional insights.
Display Supports and Resistances :
Description : Toggle to enable or disable the display of support and resistance lines.
Details : When enabled, support and resistance lines will be shown on the chart, providing key levels for market analysis.
Swing Period :
Description : Set the retrospective period for identifying swing points.
Details : A longer period captures more significant trends but may reduce sensitivity. The default value is 10.
Support Line Color :
Description : Set the color for support lines.
Details : Choose a color that enhances chart readability. Default is green.
Resistance Line Color :
Description : Set the color for resistance lines.
Details : Choose a color that makes resistance lines easily distinguishable. Default is red.
Trend-Based Line Color :
Description : Toggle to enable dynamic coloring based on trend direction.
Details : When enabled, the color of the lines will change according to the trend, aiding visual analysis.
Line Thickness :
Description : Adjust the thickness of the support and resistance lines.
Details : Choose a thickness value between 1 and 5 for better visibility.
Line Style :
Description : Select the style of the lines.
Details : Options include Solid, Dotted, or Dashed lines for visual distinction.
Number of Lines to Display :
Description : Set the maximum number of support/resistance lines to display.
Details : Adjust the number of lines to avoid clutter or to show more levels.
Display Bollinger Bands :
Description : Toggle to show or hide Bollinger Bands on the chart.
Details : Bollinger Bands provide a visual representation of volatility and potential price ranges.
Bollinger Bands Integration :
Description : Enable the integration of Bollinger Bands for S/R calculation.
Details : This feature adjusts the placement of S/R lines based on the market volatility captured by the Bollinger Bands.
Bollinger Bands Color Settings :
Description : Set colors for different Bollinger Band conditions.
Details :
Green: Prices above the median but below the upper band (potential overbought area).
Dark green: Prices above the upper band (strong upward momentum).
Light red: Prices below the median but above the lower band (potential oversold area).
Dark red: Prices below the lower band (strong downward momentum).
Fill Opacity Adjustment :
Description : Adjust the fill opacity between Bollinger Bands.
Details : Set the opacity level to balance visibility with other chart elements.
BB Sensitivity Level :
Description : Adjust the sensitivity for determining S/R levels near Bollinger Bands.
Details : A higher value increases the consideration of levels near the bands.
Band Width Multiplier :
Description : Control the width of the Bollinger Bands.
Details : Adjust the multiplier to expand or contract the bands based on market volatility.
Uniform BB Coloring :
Description : Apply a consistent color to Bollinger Bands.
Details : Simplify visual interpretation with a uniform color.
Plotting and Alerts :
Plotting Bollinger Bands :
Description : Plot the Bollinger Bands on the chart.
Details : The bands are colored based on the conditions set for market volatility and price ranges.
Alerts and Notifications :
Description : Set alerts for support/resistance breaks and Bollinger Band breakouts.
Details : Notify traders of significant market events related to these levels.
📘 Enhanced Trend Lines Integration
Purpose : Identifies and plots trend lines based on market structure to help traders understand market direction and potential buy/sell points.
Usage : Toggle the display of trend lines, customize their appearance, and use enhanced calculations for trend analysis.
Display Trend Lines :
Description : Enable or disable the display of trend lines on the chart.
Details : These trend lines are calculated based on market structure, specifically through the detection of Breaks of Structure (BOS). If enabled, the trend lines will help in identifying the market overall trend and potential buy and sell points.
Trend Line Colors :
Upper Line Color : Set the color for the upper trend lines to enhance visual distinction.
Lower Line Color : Set the color for the lower trend lines, aiding in easy identification of support levels.
Pivot Labels :
Show Pivots Labels : Control the display of pivot labels on the chart.
Pivot Label Size : Select the size of the pivot labels displayed on the chart. Options include Tiny, Small, Normal, Large, and Huge.
Trend Line Calculations :
Pivot Depth : Adjust the depth for pivot calculation based on the selected timeframe to capture significant price movements.
Pivot Deviation : Set the deviation for pivot calculation to identify key turning points.
Pivot Backstep : Define the backstep for pivot calculation to ensure accurate detection of pivot points.
Enhanced Calculations :
Market Structure Detection : Utilize advanced algorithms to identify key market structures, improving trend line accuracy.
Adaptive Parameters : Automatically adjust pivot depth, deviation, and backstep based on the selected timeframe for better relevance.
Zigzag Calculation : Implement zigzag patterns to dynamically adjust trend lines, ensuring they reflect current market conditions.
Slope and Intercept Calculation : Compute the slope and intercept for trend lines to enhance precision in trend detection.
Dynamic Updates : Continuously update trend lines as new data becomes available, ensuring real-time accuracy.
Alerts and Notifications : Set alerts for new high and low pivots, as well as for when the price crosses upper or lower trend lines, keeping traders informed of significant market changes.
Plotting Trend Lines :
Trend Line Plotting : Automatically draw trend lines based on detected BOS, helping traders visualize the market trend.
Diagonal Support/Resistance Lines : Plot diagonal lines to indicate support and resistance levels, enhancing the understanding of market dynamics.
Pivot Label Customization : Customize pivot labels for clear identification of high and low points in the trend.
Alerts for Trend Lines : Set alerts for when price crosses trend lines, ensuring timely notifications of potential trading opportunities.
📘 Enhanced Linear Regression Integration
Purpose : Uses linear regression to analyze price movements and identify trends.
Usage : Display the linear regression projection line, customize its appearance, and use enhanced calculations for better trend analysis.
Display Projection Line :
Description : Toggle to display or hide the linear regression projection line on the chart.
Details : This line represents the best fit line that predicts future prices based on historical data.
Data Source :
Description : Select the data source for the linear regression projection.
Details : This is typically the closing price but can be any price point such as open, high, or low. The selected source will be used to calculate the linear regression projection line.
Trend-Based Line Color :
Enable Trend-Based Line Color : Toggle to automatically color the projection line based on the trend direction. When enabled, the line will be red for a downward trend and green for an upward trend, providing a visual indication of market direction.
Uptrend Line Color : Select the color for the projection line when the trend is upward. This color will be used when "Enable Trend-Based Line Color" is active.
Downtrend Line Color : Select the color for the projection line when the trend is downward. This color will be used when "Enable Trend-Based Line Color" is active.
Enhanced Calculations :
Standard Deviation Calculation : Calculate the standard deviation for a given length to understand the volatility around the linear regression line.
Pearson's Correlation Calculation : Compute Pearson's R to measure the strength of the linear relationship between the price points and the linear regression line.
Slope and Intercept Calculation : Calculate the slope and intercept for the regression line, providing the basis for the projection.
Kernel Application : Optionally apply the RBF Kernel to the selected source data for smoothing and enhancing the regression calculations.
Dynamic Length Selection : Automatically select the optimal regression period based on the highest Pearson's R value, ensuring the most accurate trend representation.
Real-Time Updates : Continuously update the regression line and related calculations as new data becomes available, maintaining accuracy in real-time.
Alerts and Notifications : Set alerts for when the price crosses the linear regression projection line, notifying traders of significant market events.
Plotting Linear Regression Components :
Projection Line Plotting : Automatically draw the linear regression projection line based on historical data and the selected data source.
Label Customization : Customize the label for the projection line, including color and text, for clear identification on the chart.
Alerts for Projection Line : Set alerts for when the price crosses the projection line, ensuring timely notifications of potential trading opportunities.
📘 POC Analysis Integration
Purpose : Identifies the Point of Control (POC) to highlight price levels with the highest trading volume.
Usage : Toggle the display of the POC, customize its appearance, and use enhanced calculations for better market analysis.
Display POC :
Description : Toggle to display or hide the Point of Control (POC) on the chart.
Details : The POC is the price level at which the highest volume of trading occurred, indicating a focal point of market activity.
Data Source :
Description : Select the price source for POC analysis.
Details : This is typically the closing price but can be any price point such as open, high, or low. The selected source will be used to calculate the POC.
POC Line Colors :
Color Above POC : Set the line color when the closing price is above the POC.
Color Below POC : Set the line color when the closing price is below the POC.
Width Multiplier :
Description : Adjust the width around the price for POC analysis.
Details : A higher value broadens the calculation range.
POC Calculation and Visualization :
Price Level Initialization : Calculate the initial spacing between price levels based on the first candlestick and user settings.
Volume Data Accumulation : Accumulate volume data at specified price levels for each candlestick to determine the POC.
Dynamic Array Expansion : Expand price levels array to accommodate new price data outside the current range.
POC Determination : Determine and visualize the POC at the last candlestick if enabled by the user.
Alerts and Notifications : Set alerts for when the price crosses the POC, notifying traders of significant market events.
Plotting POC Components :
POC Line Plotting : Automatically draw the POC line based on historical data and the selected data source.
Label Customization : Customize the label for the POC line, including color and text, for clear identification on the chart.
Alerts for POC : Set alerts for when the price crosses the POC, ensuring timely notifications of potential trading opportunities.
📘 Enhanced Divergences Integration
Purpose : Detects and displays divergences between price movements and indicators to identify potential reversal points.
Usage : Toggle the display of divergences, select data sources, customize divergence colors, and use enhanced calculations for better trend analysis.
Display Divergences :
Description : Toggle to display or hide the detected divergences on the chart.
Details : Divergences occur when the price movement of an asset and a related indicator (e.g., volume or momentum) move in opposite directions. They are used to identify potential reversal points in the market. Regular divergences signal possible reversals, while hidden divergences can indicate continuation.
Data Source :
Description : Defines the timeframe from which to fetch data for analysis.
Details : Typically lower than the chart current timeframe for multi-timeframe analysis.
Divergence Colors :
Bearish Divergence Color : Sets the color for bearish divergence lines. Bearish divergences typically suggest potential downward price movement.
Bullish Divergence Color : Sets the color for bullish divergence lines. Bullish divergences typically indicate potential upward price movement.
Pivot Bars :
Left Bars : Number of bars to the left of the pivot point to consider. Helps in identifying the pivot high or low by looking back these many bars.
Right Bars : Number of bars to the right of the pivot point to consider. Assists in confirming a pivot point by ensuring no higher high or lower low is present within this range.
Display Hidden Divergences :
Description : When enabled, this setting reveals hidden divergences on the chart.
Details : Hidden divergences are a subtler form of divergence that often signal continuation rather than reversal. A hidden bullish divergence occurs when price makes a higher low while the indicator makes a lower low, suggesting the continuation of an uptrend. Conversely, a hidden bearish divergence occurs when price makes a lower high while the indicator makes a higher high, indicating the continuation of a downtrend. These divergences are particularly useful for identifying the strength of the current trend.
Dynamic Line Width Based on Divergence Count :
Description : When enabled, adjusts the width of the divergence line dynamically based on the count of divergences detected.
Details : This provides visual emphasis on stronger signals.
Enhanced Calculations :
Standard Deviation Calculation : Calculate the standard deviation for a given length to understand the volatility around the linear regression line.
Pearson's Correlation Calculation : Compute Pearson's R to measure the strength of the linear relationship between the price points and the linear regression line.
Slope and Intercept Calculation : Calculate the slope and intercept for the regression line, providing the basis for the projection.
Kernel Application : Optionally apply the RBF Kernel to the selected source data for smoothing and enhancing the regression calculations.
Dynamic Length Selection : Automatically select the optimal regression period based on the highest Pearson's R value, ensuring the most accurate trend representation.
Real-Time Updates : Continuously update the regression line and related calculations as new data becomes available, maintaining accuracy in real-time.
Alerts and Notifications : Set alerts for when the price crosses the linear regression projection line, notifying traders of significant market events.
Plotting Divergence Components :
Divergence Line Plotting : Automatically draw divergence lines based on historical data and the selected data source.
Label Customization : Customize the label for the divergence lines, including color and text, for clear identification on the chart.
Alerts for Divergences : Set alerts for when a divergence is detected, ensuring timely notifications of potential trading opportunities.
📘 Enhanced Average True Range Integration
Purpose : Measures market volatility using the Average True Range (ATR) to assist in identifying potential buy and sell points.
Usage : Set the ATR period, minimum tick filter, upper and lower coefficients, and customize ATR colors for better market analysis.
Show Labels :
Description : Enable or disable the display of labels for the Average True Range (ATR) indicator.
Details : This option controls whether the ATR signals (buy and sell) are shown on the chart with respective labels.
ATR Period :
Description : Sets the period for calculating the Average True Range (ATR).
Details : The ATR measures market volatility by calculating the average range of price movement over a specified period. A shorter period makes the ATR more sensitive to recent price movements, while a longer period smooths out short-term volatility.
Minimum Tick Filter :
Description : Sets the minimum tick filter for buy and sell signals.
Details : This filter ensures that the price movement is significant enough to be considered a valid signal. For example, a value of 20 means that the price must move at least 20 ticks from the open to the close to generate a signal.
Upper Coefficient :
Description : Sets the upper coefficient for band calculation.
Details : This value adjusts the sensitivity of the upper band used to detect high points. A higher coefficient makes the band wider, capturing more significant price movements, while a lower coefficient makes the band narrower, making it more sensitive to smaller price changes.
Lower Coefficient :
Description : Sets the lower coefficient for band calculation.
Details : This value adjusts the sensitivity of the lower band used to detect low points. A higher coefficient makes the band wider, capturing more significant price movements, while a lower coefficient makes the band narrower, making it more sensitive to smaller price changes.
ATR Colors :
Bullish Color : Sets the color for the bullish signal, helping to visually distinguish bullish trends.
Bearish Color : Sets the color for the bearish signal, helping to visually distinguish bearish trends.
Enhanced Calculations :
Dynamic Coefficient Calculation : Calculates dynamic coefficients based on market volatility, adjusting the sensitivity of ATR bands accordingly.
Band Calculation : Computes high and low bands using dynamic coefficients to detect significant price movements.
High/Low Point Detection : Identifies potential high and low points based on ATR band calculations and price thresholds.
Real-Time Updates : Continuously updates ATR calculations and signals as new data becomes available, ensuring accuracy in real-time.
Plotting ATR Components :
Signal Plotting : Plots bullish and bearish ATR signals on the chart based on calculated conditions.
Label Customization : Customize the labels for ATR signals, including color and text, for clear identification on the chart.
Alerts for Signals : Set alerts for detected bullish and bearish signals, ensuring timely notifications of potential trading opportunities.
📘 Enhanced ATR Visualization Parameters
Purpose : Provides a visual representation of market volatility using the ATR Strength Meter.
Usage : Toggle the display of the ATR Strength Meter, set thresholds, and customize its appearance for better market analysis.
Display ATR Strength Meter :
Description : Toggle to display or hide the ATR Strength Meter, a visual representation of market volatility.
Details : The meter is based on the Average True Range (ATR) and helps identify volatility trends.
High ATR Threshold :
Description : Set the threshold for high volatility.
Details : ATR values above this threshold indicate increased market volatility.
Low ATR Threshold :
Description : Set the threshold for low volatility.
Details : ATR values below this threshold indicate decreased market volatility.
Progression Bar Position :
Description : Select the position of the ATR Strength Meter on the chart.
Details : Options are "Top" or "Bottom", affecting where the volatility meter is displayed relative to price action.
Progress Bar Length :
Description : Set the horizontal length of the ATR Strength progression bar.
Details : Adjust to increase or decrease the bar's width, accommodating different chart sizes and user preferences.
Enhanced Calculations :
ATR Strength Calculation : Calculate the ATR strength to measure market volatility.
Dynamic Coefficients : Use dynamic coefficients based on volatility for more accurate calculations.
Progress Bar Calculation : Determine the position and color of the progression bar based on ATR strength.
Label Positioning : Dynamically position labels for minimum and maximum values to avoid overlap.
Plotting ATR Strength Meter :
Progression Bar Plotting : Plot the progression bar to represent the ATR strength.
Label Customization : Customize labels for the ATR strength, minimum, and maximum values.
📘 Enhanced Relative Strength Index Integration
(A special thanks to RumpyPumpyDumpy for allowing the private reuse of his script.)
Purpose : Measures market momentum using the Relative Strength Index (RSI) and Stochastic RSI to assist in identifying potential buy and sell points.
Usage : Set the RSI and StochRSI parameters, toggle the display of the RSI Meter, and customize its appearance for better market analysis.
RSI Calculation Parameters :
RSI Length : Defines the length of the RSI calculation.
Details : A longer period captures more data points but may reduce sensitivity.
RSI Overbought Level : Sets the overbought level for RSI.
Details : Values above this level indicate overbought conditions.
RSI Oversold Level : Sets the oversold level for RSI.
Details : Values below this level indicate oversold conditions.
StochRSI Length : Defines the length of the StochRSI calculation.
Details : A longer period captures more data points but may reduce sensitivity.
StochRSI %K Length : Defines the length of the %K line of the StochRSI.
StochRSI %D Length : Defines the length of the %D line (SMA of %K) of the StochRSI.
RSI Visualization Parameters :
Display RSI Meter : Toggle the display of the RSI Meter on the chart.
RSI Meter Size : Adjust the size of the RSI Meter displayed on the chart.
Details : Measured as the diameter of the meter. Increase the value for larger display size, enhancing visibility and making it easier to read the RSI trend at a glance.
Horizontal Offset : Move the RSI Meter horizontally across the chart.
Details : Positive values shift the meter to the left, allowing for placement adjustments relative to the chart's current view or specific visual preferences.
RSI Meter Components :
Sectors and Ticks : Draw sector arcs and tick marks around the RSI Meter to represent different RSI levels and thresholds.
Needle : Draw the needle on the RSI Meter to indicate the current RSI value.
Sector Labels : Label each sector of the RSI Meter to indicate market conditions like "Strong Buy," "Buy," "Neutral," "Sell," and "Strong Sell."
Title Label : Draw the title label for the RSI Meter displaying the RSI value and its period.
Enhanced Calculations :
RSI Calculation : Calculate the RSI using the built-in function with the specified length and source.
StochRSI Calculation : Calculate StochRSI values using the specified lengths for RSI, %K, and %D.
Dynamic Line Management : Efficiently manage and update dynamically created line objects to prevent potential memory leaks.
Optimized Sector and Needle Drawing : Enhanced the drawing functions for sectors, needles, and ticks to improve visual clarity and performance.
Plotting RSI Meter :
Sector Plotting : Draw the sectors on the RSI Meter using specified colors and widths to represent different RSI levels and thresholds.
Needle Plotting : Plot the needle on the RSI Meter based on the calculated RSI value to visually indicate the current RSI level.
Tick Plotting : Plot tick marks around the RSI Meter to denote key RSI levels and thresholds for better readability.
Label Plotting : Draw sector labels and a title label on the RSI Meter to provide context and information about the RSI levels and their corresponding market conditions.
📘 Market Sentiment Integration
Purpose : Analyzes market sentiment using various indicators to provide an overall sentiment score.
Usage : Enable or disable individual sentiment indicators, set account type, and customize sentiment calculations for better market analysis.
Volatility Index (IV) :
Description : Enable or disable the use of the Volatility Index in sentiment calculation.
Details : When enabled, the Volatility Index (IV) provides insight into market sentiment by measuring market volatility. The selected Volatility Index varies based on your TradingView account type.
Account Type :
Description : Select your TradingView account type.
Details : Free accounts use SPX, while Premium accounts use VIX.
Put/Call Ratio (PCR) :
Description : Enable or disable the use of the Put/Call ratio in sentiment calculation.
Details : The Put/Call ratio is a sentiment indicator that measures the volume of put options traded relative to call options, indicating market sentiment towards bearish or bullish expectations.
Fear and Greed Index :
Description : Enable or disable the use of the Fear and Greed Index in sentiment calculation.
Details : The Fear and Greed Index gauges the prevailing emotions in the market, indicating whether investors are inclined towards fear (bearish sentiment) or greed (bullish sentiment).
Momentum Indicators :
Description : Enable or disable the use of momentum indicators like MACD and RoC in sentiment calculation.
Details : Momentum indicators help identify the strength and direction of price movements, assisting in sentiment analysis.
Adaptive Periods for Shorter Timeframes :
Description : Toggle this option to use shorter periods for sentiment indicators when analyzing lower timeframes.
Details : Enabling this option allows for more responsive and sensitive analysis when working with shorter timeframes.
Calculation Details :
Normalization Function : Normalize the values of the indicators over a 252-period range.
Set Periods Function : Set periods based on user preference for faster or slower periods, adjusting the analysis sensitivity.
IV Calculation : Calculate the IV value based on the selected Volatility Index (SPX for Free accounts, VIX for Premium accounts).
Put/Call Ratio Calculation : Calculate the Put/Call ratio using volume data, where put volume is proportional to the trading range, and call volume is proportional to the price change.
RoC Calculation : Calculate the Rate of Change (RoC) as a momentum indicator, measuring the percentage change in closing prices over a specified period.
Dynamic Thresholds : Define dynamic thresholds based on historical data, calculating mean and standard deviation to determine upper and lower thresholds for IV, PCR, and RoC.
📘 Enhanced Market Trend Dashboard Integration
Purpose : Provides a summary of key market indicators and signals in a single dashboard for quick and easy reference.
Usage : Customize the dashboard settings to display relevant market information, including Ichimoku components, Linear Regression, Support/Resistance levels, MACD, RSI, and Market Sentiment.
Market Trend Dashboard Parameters :
Display Market Trend Dashboard : Toggle to show or hide the market trend dashboard, providing a summary of key indicators and signals.
Panel Position : Select the position of the dashboard on the chart for optimal viewing.
Panel Text Size : Choose the text size for the information displayed in the dashboard, ensuring readability.
Panel Background Color : Set the background color of the market trend dashboard, enhancing contrast with the chart.
Ichimoku Dashboard Parameters :
Display Ichimoku Dashboard : Toggle to show or hide the Ichimoku section in the dashboard.
Display Tenkan-Sen Price Cross : Indicate when the price crosses the Tenkan-Sen line, signaling potential trade opportunities.
Display Kijun-Sen Price Cross : Indicate when the price crosses the Kijun-Sen line, often considered a stronger signal than Tenkan-Sen crosses.
Display Chikou Span Price Cross : Indicate Chikou Span price crosses, providing insight into potential trend reversals.
Display Kumo Breakout : Indicate Kumo (cloud) breakouts, which can signify major trend shifts.
Display Kumo Twist : Indicate Kumo twists, suggesting changing market dynamics and potential reversals.
Linear Regression Projection Dashboard Parameters :
Display LR Projection Dashboard : Toggle to show or hide the Linear Regression Projection section in the dashboard.
Display Linear Regression Period : Indicate the period used for Linear Regression Projection analysis.
Display Pearson R Details : Show the Pearson R value in the dashboard, indicating the strength and direction of the correlation in the Linear Regression Projection.
Supports and Resistances Dashboard Parameters :
Display S/R Dashboard : Toggle to show or hide the Support and Resistance section in the dashboard.
Display S/R Break Prices : Show the latest break prices of support and resistance levels in the dashboard.
MACD Dashboard Parameters :
Display MACD Dashboard : Toggle to show or hide the MACD section in the dashboard.
RSI Dashboard Parameters :
Display RSI Dashboard : Toggle to show or hide the Relative Strength Index section in the dashboard.
Display RSI Details : Show the RSI value and status in the dashboard.
Display StochRSI Details : Show the StochRSI %K, %D values and status in the dashboard.
Market Sentiment Dashboard Parameters :
Display Market Sentiment Dashboard : Enable or disable the display of the Market Sentiment Dashboard, which summarizes key market sentiment indicators like Implied Volatility, Put/Call Ratio, and Fear and Greed Index.
Display Implied Volatility Details : Show or hide the Implied Volatility details in the Market Sentiment Dashboard.
Display Put/Call Ratio Details : Show or hide the Put/Call Ratio details in the Market Sentiment Dashboard.
Display Fear and Greed Index Details : Show or hide the Fear and Greed Index details in the Market Sentiment Dashboard.
Enhanced Calculations :
Ichimoku Cloud Trend Calculation : Calculates trend based on the relationship between Ichimoku Cloud components, identifying bullish or bearish trends.
Support and Resistance Break Detection : Detects breaks in support and resistance levels and updates the dashboard accordingly.
Linear Regression Projection Calculation : Calculates Linear Regression Projection and Pearson R value for trend analysis.
MACD Signal Calculation : Determines MACD status based on histogram values.
RSI and StochRSI Calculation : Calculates RSI and StochRSI values and updates their statuses in the dashboard.
Market Sentiment Score Calculation : Calculates overall market sentiment score based on individual sentiment indicators.
Dynamic Alert Management : Manages alerts for various dashboard signals to prevent repeated alerts.
Real-Time Data Integration : Continuously updates the dashboard with real-time data for accurate and current trend analysis.
Plotting Market Trend Dashboard Components :
Ichimoku Components Plotting : Plots Tenkan-Sen, Kijun-Sen, Chikou Span, and Kumo cloud with dynamic adjustments.
Support and Resistance Levels Plotting : Plots support and resistance levels and updates them dynamically based on market data.
Linear Regression Projection Plotting : Plots the Linear Regression Projection line and labels with trend-based colors.
MACD and RSI Plotting : Plots MACD and RSI signals on the dashboard, including status updates.
Market Sentiment Indicators Plotting : Plots Market Sentiment indicators like IV, PCR, and Fear and Greed Index with dynamic updates.
Alert Notifications Plotting : Plots alert notifications for significant market changes based on dashboard signals.
Summary
This comprehensive market analyzer integrates multiple technical indicators, including machine learning, Ichimoku Kinkō Hyō, candlestick patterns, Fibonacci retracement, support and resistance levels, trend lines, linear regression, POC analysis, divergences, ATR, RSI, and market sentiment. Each section includes detailed descriptions and usage instructions to help traders understand how to effectively utilize the indicator in their trading strategies.

Custom MyMA Contrarian IndicatorThis indicator was inspired on the Sofien Kaabar's Moving Average Contrarian Indicator - MACI. It is actually a (K,1,1) stochastic indicator built on top of the distance from the price to, what a I call, a Base Moving Average.
What I have found insteresting is that, instead of only paying attention to 0% and 100% moments, I put two K stochastic lines together and observe their relative behavior. My intention, as much as Mr Kaabar's, is to detect mean-reversion moments. I am particularly interested in detecting trends ending and, while I am not able to make the Hurst exponent useful for that purpose, I have found very insightful situations with this Contrarian Indicator.
The Base Moving Average can be chosen between EMA and MyMA. MyMA is a Moving Average that tries to mimic Bo William's MIMA. Due to the close resemblance between MyMA and MIMA, I do not feel comfortable to open this script source code.
Base Moving Average default length is set to 305, and the two stochastic K lines default lengths are 17 and 72. These default lengths come from one of the Fibonacci Phi^3/2 sub series (17, 72, 305), but they can be changed to any values, particularly to the traditionally used 20, 50 and 200. Up to my knowledge, Fibonacci Phi^3 and Phi^3/2 sub series lengths were first proposed by Bo Williams.
This indicator has shown to be particularly useful when used together with the PVPC indicator at moments when the price is above 3 green lines. On these situations we must choose between keeping in the trend or inverting our position due to a potential mean-reversion. The PVPC indicator can be found on my published scripts list under the name CMyMA + Fibo.
I have noticed that when the price is above 3 PV (green) lines, but the smallest K line is below the largest K line, then the up trend does not persist. I have not used with it to check for down trends but the smallest K line above the largest K line should suggest the start of a, possibly small, upward movement.
As Kaabar suggests, when both K lines are at 100%, the price will eventualy start to fall. On the other hand, when both are at 0% it will start to rise. Things get interesting when they separate from each other, as described right abaove.
This script has also a smothing option that I have not found very useful but could work as stochastic D line.

Super EMA PrismThis script implements the Binary Trade Logic (BTL) algorithm to calculate two distinct scores that range from 0 to 7. One score is calculated assigning a power of 2 weight to the positive sign of 3 Phi^3 distant Moving Average (MA) slopes. The other score is calculated assigning a power of 2 weight to the sign of the difference between the price and the value of 3 Phi^3 distant Moving Average (MA).
For the first score, hereafter called as the angle score (AS), the largest MA slope positive sign receives weight 4, the middle length MA slope positive sign receives weight 2 and the shortest MA slope positive sign receives weight 1. The positive sign of an MA is defined as 1 if the slope of the MA is positive and 0, otherwise. Therefore, for MAs 305, 72 and 17, if slope(MA305) > 0, slope(MA72) < 0 and slope(MA17) > 0, then score will be 4*1 + 2*0 + 1*1 = 5. Up to my knowledge, this score was first proposed by Bo Williams and named by him as Prisma.
For the second score, hereafter called as the value score (VS), if the price > largest MA, it receives weight 4. If the price > the middle length MA, it receives weight 2 and if the price > the the shortest MA, it receives weight 1. Therefore, for MAs 305, 72 and 17, if price < MA305, price > MA72 and price > MA17, then score will be 4*0 + 2*1 + 1*1 = 3. Up to my knowledge, this score was first proposed by Bo Williams and named by him as Prisma.
Both AS and VS are calculated for Phi^3 lengths (610, 144, 34) and for Phi^3/2 lengths (305, 72, 17). The scores of the same kind calculated for each set of length are combined multiplying the Phi^3 length score by 10 and adding with with the Phi^3/2 score, therefore providing a 2 digit score ranging from 0 to 77. For instance, if we have AS(610, 144, 34) = 7 and AS(305, 72, 17) = 5, we have AS=75. At the same time, if we have VS(610, 144, 34) = 6 and VS(305, 72, 17) = 4, we have VS=64.
VS score is plotted by default in black, but it can be on white for dark themes. AS is plotted with the color of the longest MA used.
Chart background is colored according to the range of values for AS and VS, checked in the following order:
if AS >= 13 and VS <= 13 then back color = red
if AS >= 13 or VS <= 13 then back color = orange
if AS >= 64 and VS >= 64 then back color = green
if AS >= 64 or VS >= 64 then back color = blue
otherwise back color = none (white o black)

Phicube EMASAR ( EMA Support and Resistance )Indicator based on the Concept created by Bo Williams. But unlike the original that uses MIMAs, EMAs are used here.
Exponential moving averages will be shown according to fractal alignment, in order to show the important support and resistance levels ( SAR ).
When the fractals are aligned to become support,
we will have the EMA in the graph with a bright color.
When the fractals are aligned to become resistance, we will have EMA in the graph with a matte color.
Available exponential moving averages: 17,34,72,144,305,610,1292 and 2584
____________________________________________________//_____________________________________________________________________
Indicador baseado no Conceito criado pelo Bo Williams. Mas diferente do original que utiliza MIMAs, aqui é utilizado EMAs.
As médias móveis exponenciais serão mostradas de acordo com o alinhamento dos fractais, com objetivo de mostrar os níveis importantes
de suporte e resistência( SAR ).
Quando estiver com os fractais alinhados virando suporte, teremos no gráfico a EMA com uma cor em tom brilhante.
Quando estiver com os fractais alinhados virando resistência, teremos no gráfico a EMA com uma cor em tom fosco.
Médias móveis exponenciais disponíveis: 17,34,72,144,305,610,1292 e 2584

MyMA PrismThis script implements the Binary Logic Trading (BLT) algorithm to calculate a score from 0 to 7. This score is calculated assigning a power of 2 weight to the positive sign of 3 Phi^3 distant Moving Average (MA) slopes. The largest MA slope positive sign receives weight 4, the middle length MA slope positive sign receives weight 2 and the shortest MA slope positive sign receives weight 1. The positive sign of an MA is defined as 1 if the slope of the MA is positive and 0, otherwise. Therefore, for MAs 305, 72 and 17, if slope(MA305) > 0, slope(MA72) < 0 and slope(MA17) > 0, then score will be 4*1 + 2*0 + 1*1 = 5. Up to my knowledge, this score was first proposed by Bo Williams and named by him as Prisma.
The used Moving Averages can be chosen between EMA and MyMA. MyMA is a Moving Average that tries to mimic Bo William's MIMA. Due to the close resemblance between MyMA and MIMA, I do not feel comfortable to open this script source code. In order to learn how this script operates with EMAs, please refer to my Custom EMA Prism indicator that has its source code open.
Due too sampling issues, this script ONLY WORKS with graphic time of 1d. I would like to thanks to MrBitmanBob for showing me how to get quotations from a graphic time distinct from the current one.
This script also gets sampling data from graphic times 2h and 30m to calculate their score. As, even for smaller graphic times, price data is sampled at the current time frequency, the MA lengths for those smaller graphic times needed to be proportionally decreased, meaning that when calculating the score for 1d with lengths 305, 72 and 17, the score for 2h must be calculated with lengths 72, 17 and 4, and the score for 30m must be calculated with lengths 17, 4 an 1. I understand that some precision may be lost but it is the best that is possible.
There is an optional setting for Crypto Currencies that instead of calculating the score for 1d, 2h and 30m, it calculates the score for 1d, 4h and 60m. This is due to the fact that Crypto Currencies are traded 24x7. Despite of this setting, the labels at the Style tab of the settings window remains 2h and 30m, because they must be constants.
This script with the corresponding MyMAs chart and the MyMAs Angle chart provides a broader view of the trading scenario.
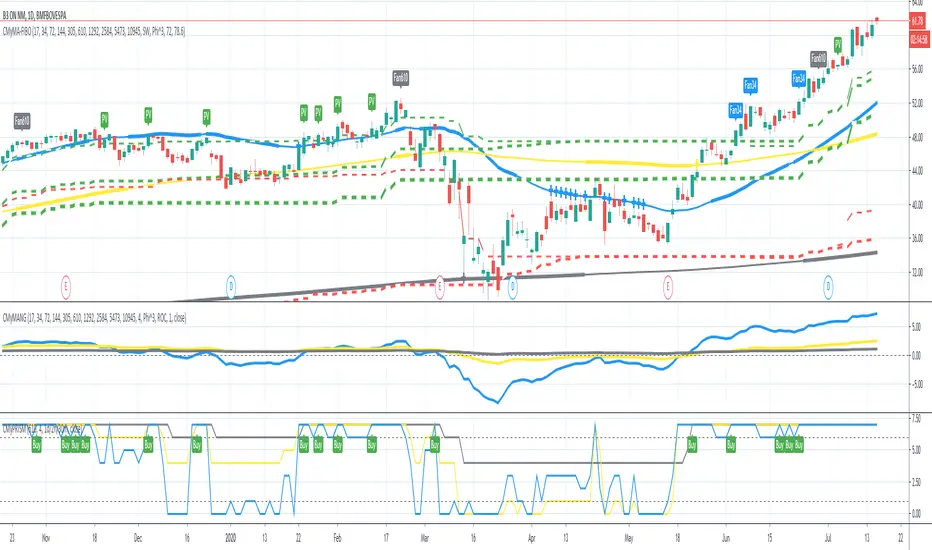
MyMA AngleThis script shows the angle of 6 Moving Averages (MAs) to perform trade analysis. The MA angle is also known as its Rate Of Change ( ROC ). The 6 MAs (I, II, III , IV, V and VI ) default lengths come from one of the Fibonacci Phi^3 and Phi^3/2 sub series (17, 34, 72, 144, 305 and 610), but can be changed to any values, particularly to the traditionally used 20, 40, 50, 100, 200 and 300. Up to my knowledge, Fibonacci Phi^3 and Phi^3/2 sub series lengths were first proposed by Bo Williams.
The used Moving Averages can be chosen between EMA and MyMA. MyMA is a Moving Average that tries to mimic Bo William's MIMA. Due to the close resemblance between MyMA and MIMA, I do not feel comfortable to open this script source code. In order to learn how this script operates with EMAs, please refer to my Custom EMA + FIBO indicator that has its source code open.
Angle calculation is performed by calculating the tangent over a delta interval. Normalization is required to make the angle independent of the price range.
This script is meant to be used together with the corresponding MAs on the candle pane. Non normalized view shows a more realistic angle condition but, if intended to be used with the MyMAS indicator, normalized view should be used.

MyMA StrategyThis script combines 3 Moving Averages (MAs) with Bollinger Bands to build a trend based trading strategy. The 3 MAs (I, II and III ) default lengths come from one of the Fibonacci Phi^3/2 sub series (17, 72 and 305), but can be changed to any values, particularly to the traditionally used 20, 50 and 200.
The used Moving Averages can be chosen between EMA and MyMA. MyMA is a Moving Average that tries to mimic Bo William's MIMA. Due to the close resemblance between MyMA and MIMA, I do not feel comfortable to open this script source code. In order to learn how this script operates with EMAs, please refer to my Custom EMA Strategy indicator that has its source code open.
Bollinger Band length is set to the same length as MA I. Up to my knowledge, Fibonacci Phi^3/2 sub series lengths were first proposed by Bo Williams.
Buy Recommendations happen when src (close) > MA I > MA II, MA I angle > 0 degree, MA II angle > -1 degree and MA III angle > -1 degree. My simulations have show that -1 degree usage results in better returns than zero degree.
Top Buy Recommendations happen when, besides Buy recommendation conditions are met, src (close) > HBand, the Bollinger Band High Band.
Sell Recommendations come in 3 flavors: Short Term (close < MA I), Medium Term (close < MA2) and Long Term (MA I < MA II).
Angle calculation is performed by calculating the "normalized" tangent over a delta interval. Normalization is required to make the angle independent of the price range.

Custom EMA + FIBOThis script combines 6 EMAs with 3 Donchian Channel 78.6% and 21.4% intermediary level lines to perform trade analysis. The 6 EMAs (I, II, III , IV, V and VI ) default lengthes come from one of the Fibonacci Phi^3 and Phi^3/2 sub series (17, 34, 72, 144, 305 and 610), but can be changed to any values, particularly to the traditionally used 20, 40, 50, 100, 200 and 300. Up to my knowledge, Fibonacci Phi^3 and Phi^3/2 sub series lengthes were first proposed by Bo Williams.
The 3 Donchian Channels used have default lengthes 72, 305 and 1292, calculated after the first length default value of 72. For each of the 3 Donchian Channels only an upper line, set by default at 78.6%, is plotted in green and its complement, set to 21.4%, is plotted in red. When the closing price is above 3 green lines, we say it is Forbidden to Sell ( PV ), and when the closing price is below 3 red lines, we say it is Forbidden to Buy ( PC ). Those conditions are flagged on the chart. These PV-PC conditions were, up to my knowledge, first proposed by Bo Williams.

Hicham XAUUSD Key Levels PRO (1H / 4H + Psychological)🔑 XAUUSD Key Levels PRO | 1H / 4H Structure + Psychological Levels
This indicator is designed specifically for Gold (XAUUSD) traders who want clean, institutional-grade key levels without chart clutter.
It combines market structure levels with true psychological price levels used by institutions, making it ideal for scalping, intraday, and swing trading.
📌 Features
🔹 Market Structure Key Levels
Automatic 1H & 4H High / Low detection
Based on swing pivots (configurable strength)
Solid lines for clear structure visibility
🔹 Gold Psychological Levels (XAUUSD)
Major levels: every 500$ (strong institutional zones)
Medium levels: every 250$
Minor levels: every 10$
Dynamic levels around current price
No line spam, optimized performance
🔹 Visual Clarity
Solid / dashed / dotted line styles
Custom colors & line thickness
Optional price labels
Works perfectly on M1 → H4
🎯 Best Use Cases
Liquidity sweeps & reactions
Premium / discount zones
Stop-loss & take-profit placement
Confluence with BOS / CHoCH
London & New York sessions
⚙️ Fully Customizable
Toggle 1H / 4H levels
Adjust psychological level spacing
Enable / disable labels
Clean & lightweight (no lag)
⚠️ Notes
Optimized for XAUUSD (Gold)
Best results when combined with price action & structure
Not a trading signal indicator
If you want:
Session-based levels
Alerts on key levels
Smart Money Concepts integration
Feel free to comment or DM 👊
Happy trading 💛📈
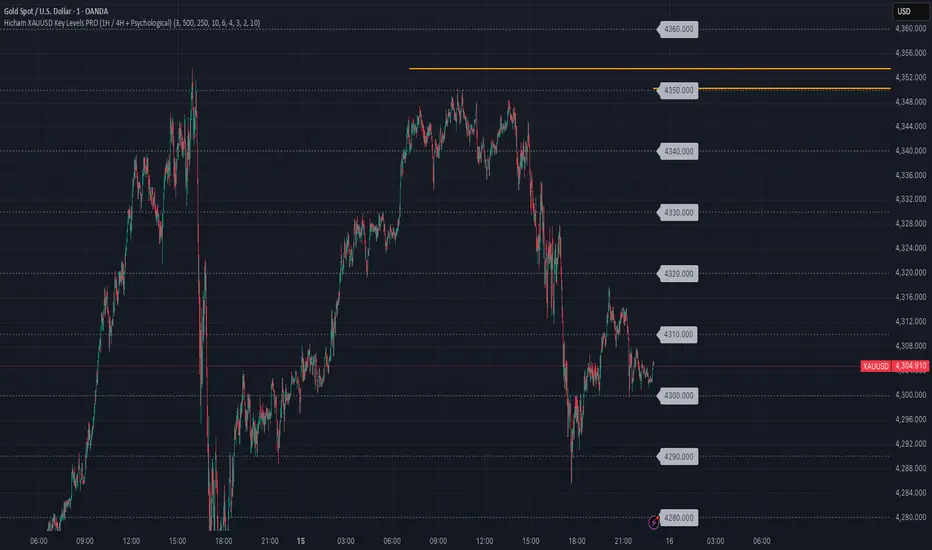
RMI Valid FVG & IFVGRMI • Valid FVG & iFVG (Smart Money Concept)
RMI • Valid FVG & iFVG is a precision-focused Fair Value Gap indicator designed for traders who follow Smart Money Concepts (SMC) / ICT logic and want to filter out low-quality, random gaps.
This indicator does not plot every FVG.
It highlights only structurally relevant FVGs that form in the direction of the trend and have a high probability of being filled.
Core Features
Bullish & Bearish Fair Value Gaps
Inverse Fair Value Gaps (iFVG)
Trend-aligned FVG filtering
Automatic invalidation after mitigation
Clean background zones for clear visibility
Optimized for intraday trading
Adjustable settings for scalping, intraday & swing trading
Smart Filtering Logic
FVGs are validated using market structure context
Only FVGs that form within the active trend are displayed
Weak or low-probability gaps are ignored
Inverse FVGs appear after strong displacement and rejection
Zones are visually faded once mitigated
This helps reduce chart noise and keeps the focus on high-probability reaction zones.
Best Use Cases
Entry refinement after BOS / CHoCH
Confluence with liquidity grabs
Premium / discount zone trading
Intraday & session-based trading
Works well with ICT, SMC, price action & structure-based strategies
Recommended Timeframes
Scalping: M1 – M5
Intraday (default): M5 – M15
Swing Trading: M15 – H1
(Default settings are optimized for intraday trading.)
Important Notes
This is not a signal indicator
No repainting
No buy/sell arrows
Designed as a decision-support tool, not an automated system
Always combine with proper risk management and confirmation.
RMI • Precision over noise.
Trade structure, not randomness.
