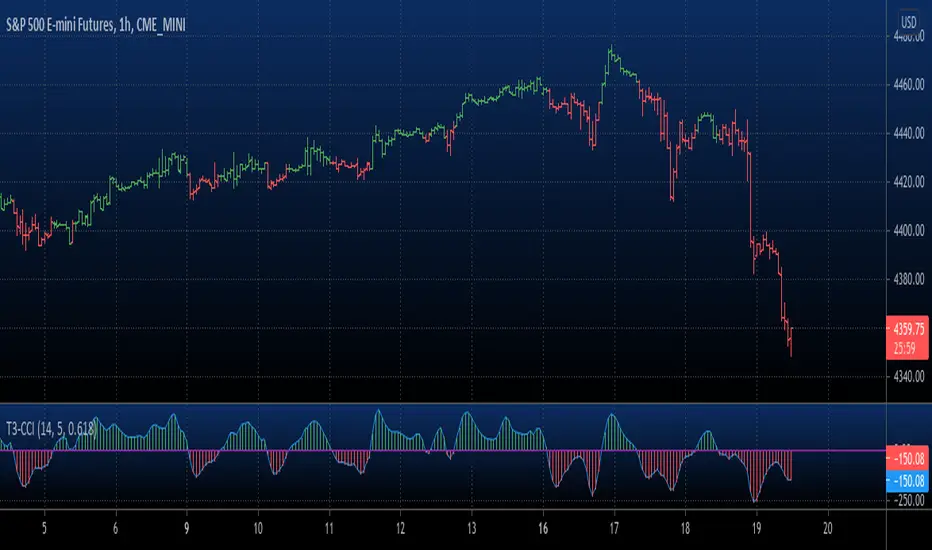
FX Sniper: T3-CCI Strategy With Alerts This simple indicator gives you a lot of useful information - when to enter, when to exit
and how to reduce risks by entering a trade on a double confirmed signal.
You can use in the xPrice any series: Open, High, Low, Close, HL2, HLC3, OHLC4 and ect...
Added Alerts when signal changes.
在脚本中搜索"CCI"
Arbitrage MACD/CCIArbitrage MACD/CCI
It's always important to know where to expect floors and ceilings in a trade.
If you're already using Arbitrage Bands, this is a great tool to help you see who is winning the fight when those pesky candles turn white and the stock is trading sideways.
If the navy line is on top a down trend is winning the fight!
If the orange line is on top an up trend is winning the fight!
Happy Trading From Arbitrage Trade Analytics!

FX Sniper: T3-CCI Strategy Backtest This simple indicator gives you a lot of useful information - when to enter, when to exit
and how to reduce risks by entering a trade on a double confirmed signal.
You can use in the xPrice any series: Open, High, Low, Close, HL2, HLC3, OHLC4 and ect...
You can change long to short in the Input Settings
Please, use it only for learning or paper trading. Do not for real trading.

Stochastic CCI MTF w/ UP/DOWN colours - squattterStoch CCI has a nicer divergence than Stoch RSI.
Enjoy!
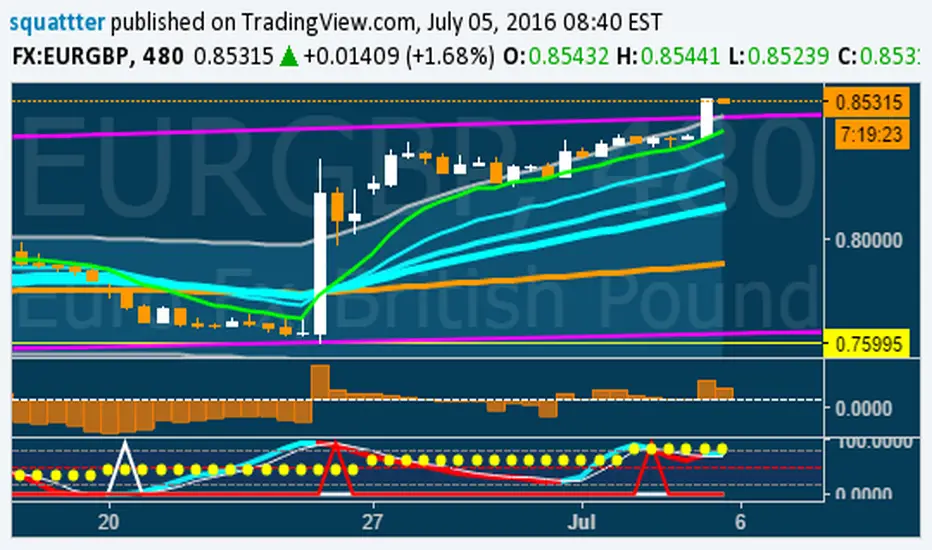
Stochastic CCI MTF w/ UP/DOWN colours - squattterStoch CCI has nicer divergences than Stoch RSI.
Enjoy.

Volume CCIHere simply calculate the CCI of the volume, this will use to measure the strength of the trend of the volume
Background:
I think the volume as the price could be represented by candles or other graphic to use indicators and strengthen their analysis, due to lack of registration of this it is first necessary to calculate a volume graph, if the candle traditionally negative price brand then the total volume is taken as negative for the period. An example of this is in the On Balance Volume indicator, the problem is that there is no way to analyze the volume using other methods. An approximate volume of the spread could be the use of the price spread to make a synthetic behavior
As traditionally is observed if Open> Close then the candle and the volume will be negative and vice versa; the next step, is estimate the amounts of the candle necessary to calculate the ratio to use for the volume and thus idealize their spread within the candle:
VLOW = Volume x Low
vHigh = x High Volume
VOpen = vClose
vClose = Volume x Close
This graph can show a stable synthetic form of fluctuations in the volume trend affected by price.
ideas, comments and suggestions (or corrections).They are always welcome


FX Sniper: T3-CCI Copy Strategy This simple indicator gives you a lot of useful information - when to enter, when to exit
and how to reduce risks by entering a trade on a double confirmed signal.
You can use in the xPrice any series: Open, High, Low, Close, HL2, HLC3, OHLC4 and ect...
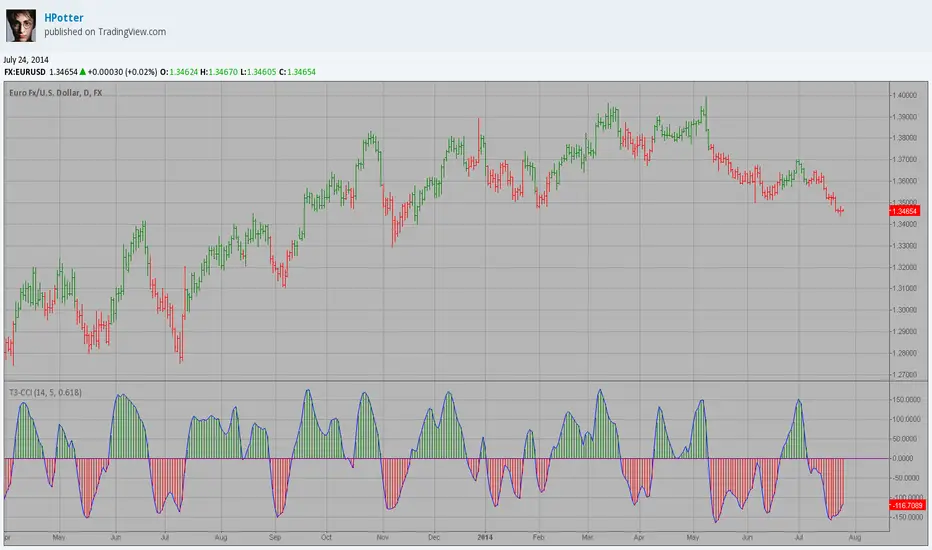
FX Sniper: T3-CCIThis simple indicator gives you a lot of useful information - when to enter, when to exit
and how to reduce risks by entering a trade on a double confirmed signal.
You can use in the xPrice any series: Open, High, Low, Close, HL2, HLC3, OHLC4 and ect...

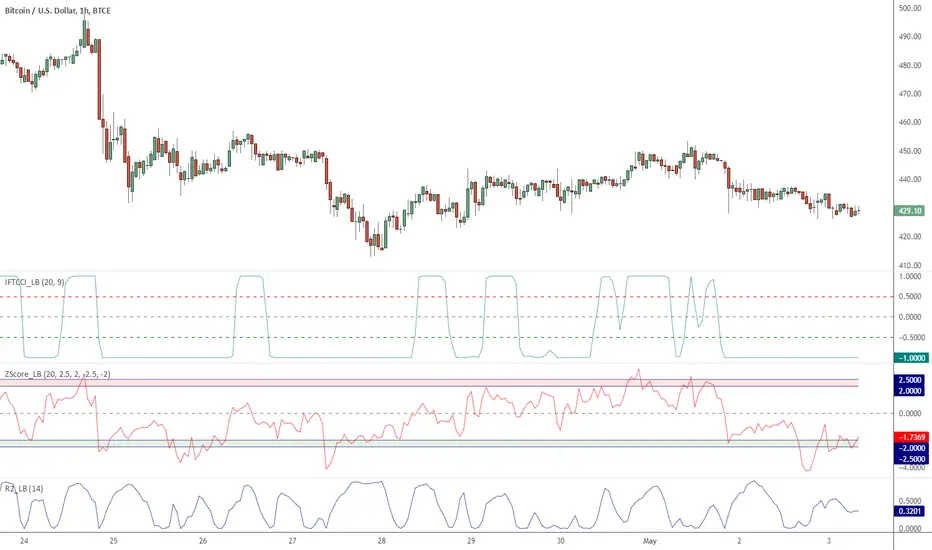
Indicators: Three included :: IFT on CCI, Z-Score and R-Squared*** Full description in the comment below ******
This chart has 3 indicators:
- Chande's R2
- Zscore
- Inverse Fisher Transform on CCI
Feel free to "make mine" (click on the SHARE button) and use these indicators in your charts.


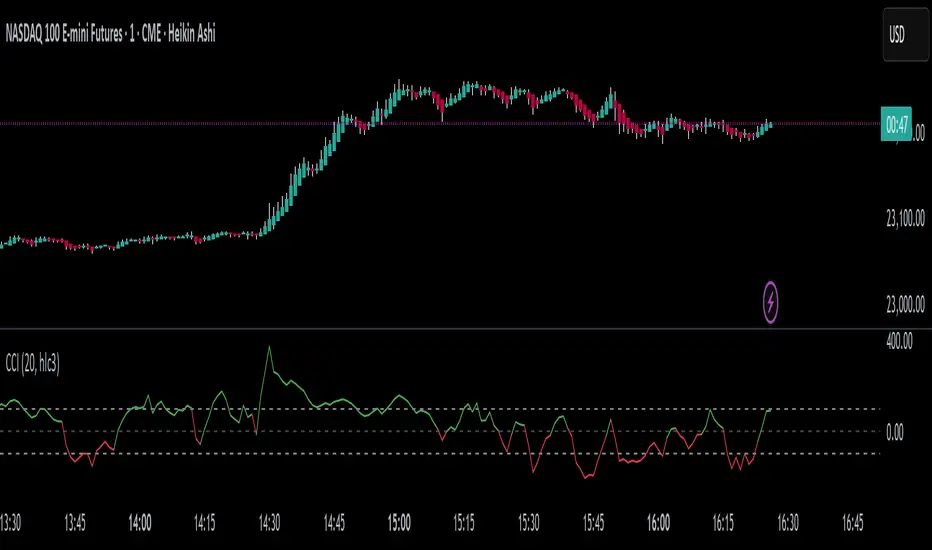
CCI MTF: Multi-timeframe CCIThis script can be quite useful to get a quick glance at momentum readings in the 3 main timeframes I use: Daily, Weekly and Monthly.
It helps, together with RgMov and the MTPC tool, to know how a market is moving and what to expect, without having to cycle through two or three timeframes constantly.
Cheers,
Ivan Labrie.

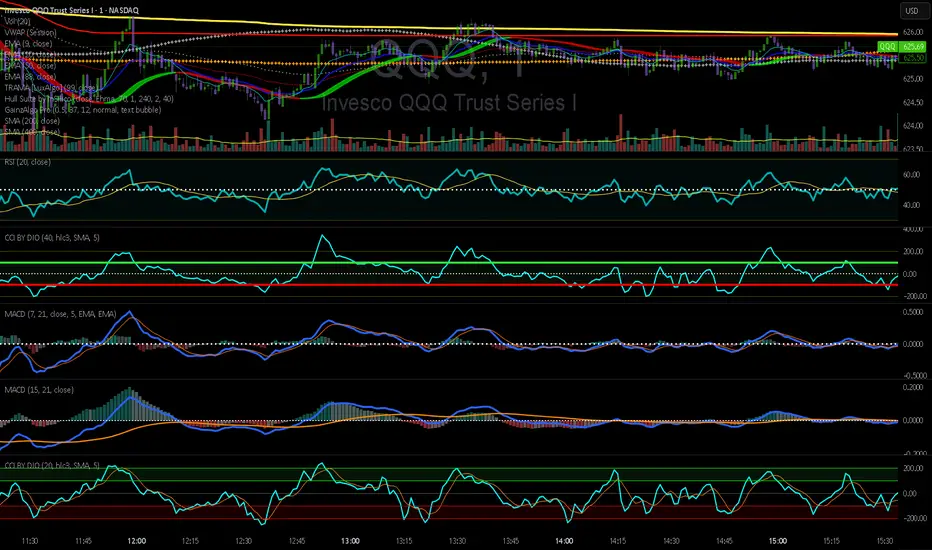
CCI by DioAdded background color to entry points of the channel for easy observation to levels I am looking at.
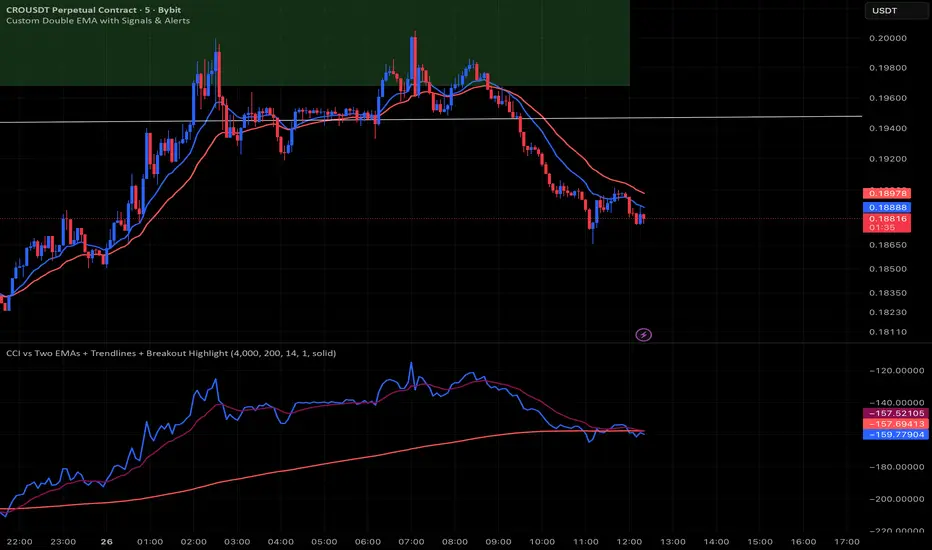
CCI vs Two EMAs + Trendlines + Breakout HighlightPerfect indicator which analyzes the cci4000 & 2 EMAS.
CCI Bearish BullishCommodities Channel Index and Bearish Harami, Bearish Engulfing, Bullish Harami, Bullish Engulfing.

CCI Investment strategyAn investment strategy that identifies investment opportunities when momentum is in favour on the upside and exits when momentum is increasing on the downside.
Applicable to all stocks across all markets.
Timeframe: Weekly
What is missing here is a pyramiding strategy to make the winners really big. Do not risk more than 1% of your capital on a single stock based on this strategy.

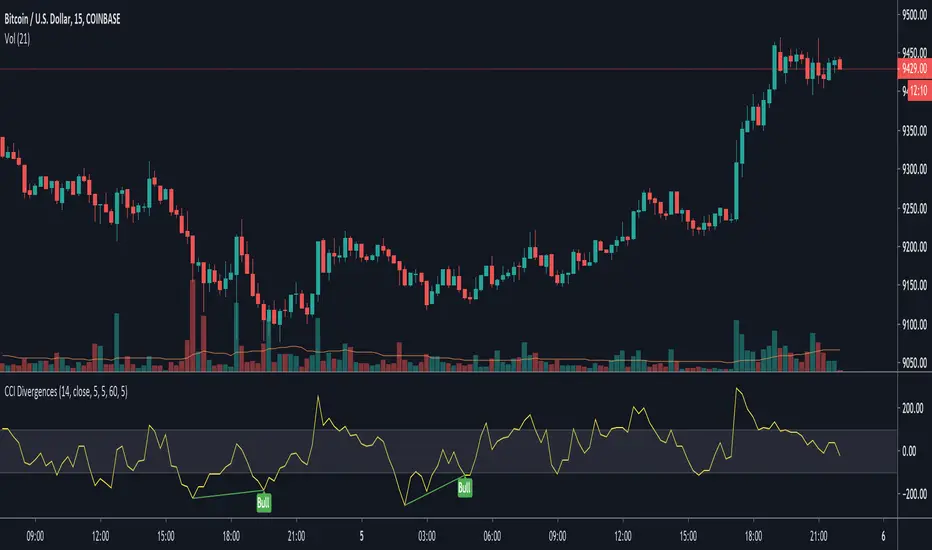
CCI DivergencesEasily identify divergences. Modified from Tradingview's Divergence Indicator script. Alerts are available.
Commodity Channel Indexcci in trading view is based on close price but the real formula Developed by Donald Lambert is based on typical price so I modified a formula little bit , and the result now are little smoothed

CCI by Minh DucCommodity Channel Index by Minh Duc
- Fast Line Cross
- Master Trendline
Use for all time frame.
Price: 50$ for a month with user guide trading system.
Contact me: Telegram @minhduc1712
