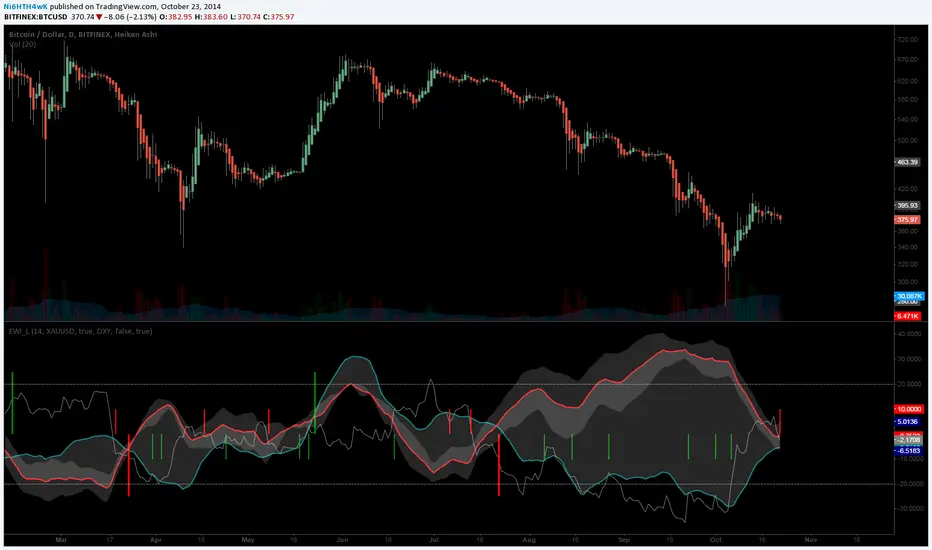
[LAVA] Early Warning IndicatorCombined the RSI inverse of gold to USD with the Dollar index (or whatever stock symbol that may be inverted/complementary) with another asset/currency, like bitcoin, you can basically be well informed when a potential move is on the horizon. Settings allow for inverse settings and de-combining the two pairs as well as a nice cloud look if all the lines get annoying.
在脚本中搜索"GOLD"
BoaBias 3RSI(Custom) + Stats3RSI(Custom) + Stats
3RSI(Custom) + Stats is an advanced multi-RSI indicator for professional and active traders. It visualizes overbought/oversold conditions using three independently configured, smoothed RSI lines (defaults: 24, 14, 9), and provides unique statistics on how long your chosen asset stays in these extreme zones.
Key Features
Triple RSI Display: Simultaneously plots three customizable RSI lines, each with its own period and smoothing.
Dynamic Overbought/Oversold Highlights: Background color highlights only when any RSI is above the overbought level or below the oversold level—no clutter, just the key moments.
In-Panel Statistics Table: See current RSI values, and average streak length in overbought and oversold zones for each RSI, calculated over your chosen historical window (default: 360 bars). Table font size can be adjusted in settings for maximum readability.
Configurable Levels: Set your preferred levels for overbought/oversold zones, as well as additional mid-levels for more nuanced analysis.
Alerts: Instantly set up alerts for when any (or each) RSI enters an extreme zone. Never miss a key reversal setup.
How to Use
Use the indicator to objectively spot exhaustion and reversal points on any timeframe and asset.
The average streak statistics help you judge whether the market is behaving “normally” or if an extreme condition is being sustained.
Table with live RSI and stats makes your decision process faster and more data-driven.
Alerts allow you to stay informed even when you’re not watching the chart.
Settings
RSI Periods & Smoothing: Adjust all three lines independently to suit your strategy.
Overbought/Oversold Levels: Customize thresholds to fit your asset or timeframe.
Statistical Window: Define how many bars to use for calculating streak averages.
Font Size: Make the stats table readable on any screen size with adjustable font.
Summary
All-in-one solution for tracking momentum exhaustion with real statistical support.
Visual clarity: only shows what matters, when it matters.
Fully compatible with TradingView alerts for ultimate automation and risk management.
Questions or suggestions? Leave feedback in the comments!

Williams FractalsBoaBias Fractals High & Lows is an indicator based on Bill Williams' fractals that helps identify key support and resistance levels on the chart. It displays horizontal lines at fractal highs (red) and lows (green), which extend to the current bar. Lines automatically disappear if the price breaks through them, leaving only the relevant levels. Additionally, the indicator shows the price values of active fractals on the price scale for convenient monitoring.
Key Features:
Customizable Fractals: Choose between 3-bar or 5-bar fractals (default: 3-bar).
Period: Adjust the number of periods for calculation
Visualization: Red lines for highs (resistance), green for lows (support). Lines are fixed on the chart and persist during scrolling or scaling changes.
Alert System: Notifications for the formation of a new fractal high/low and for level breaks (Fractal High Formed, Fractal Low Formed, Fractal High Broken, Fractal Low Broken).
How to Use:
Add the indicator to the chart.
Configure parameters: select the fractal type (3 or 5 bars) and period.
Set up alerts in TradingView to receive notifications about new fractals or breaks.
Use the lines as levels for entry/exit positions, stop-losses, or take-profits in fractal-based strategies.
Troubleshooting: If Levels Are Not Fixed on the Chart
If the levels (fractal lines) do not stay fixed on the chart and fail to move with it during scrolling or scaling (e.g., they remain stationary while the chart shifts), this is typically due to the indicator's scale settings in TradingView. The indicator may be set to "No scale," causing the lines to desynchronize from the chart's price scale.
What to Do:
Locate the Indicator Label: On the chart, find the indicator label in the top-left corner of the pane (or where "BoaBias Fractals High & Lows" is displayed).
Right-Click the Label: Click the right mouse button on this label.
Adjust the Scale:
In the context menu, look for the "Scale" or "Pin to scale" option.
If it shows "Pin to scale (now no scale)" or similar, select "Pin to right scale" (or "Pin to left scale," depending on your chart's main price scale—usually the right).
Refresh the Chart: After changing the setting, refresh the chart (press F5 or reload the page), or toggle the indicator off and on again to apply the changes.
After this, the lines should move and scale with the chart during scrolling (horizontal or vertical) or zooming. If the issue persists, check:
TradingView Limits: The indicator may draw too many lines (maximum ~500 per script). If there are many historical fractals, older lines might not display.
Chart Settings: Ensure the chart is not in logarithmic scale (if applicable) or that auto-scaling is enabled.
Indicator Version: Verify you are using the latest script version (Pine Script v6) and check for errors in the TradingView console.
This indicator is ideal for traders working with Bill Williams' chaos theory or those seeking dynamic support/resistance levels. It is based on standard fractals but with enhancements for convenience: automatic removal of broken levels and integration with the price scale.
Note: The indicator does not provide trading signals on its own — use it in combination with other tools. Test on historical data before real trading.
Code written in Pine Script v6. Original template: Mit Nayi.

FVG Zones (Remove Filled) + AlertA powerful TradingView indicator that automatically identifies Fair Value Gap (FVG) zones, removes them once price “fills” the gap, and sends you crystal-clear alerts specifying Bull or Bear zones—so you never miss a market imbalance.
🔍 Key Features
Automatic FVG Detection
Spots three-candle imbalance patterns (low > high for Bull, high < low for Bear) and draws colored boxes on your chart.
Auto-Remove Filled Zones
Once price enters a gap, the corresponding box is deleted—keeping your chart clutter-free.
Dedicated Alerts
Two separate alert conditions with constant messages:
“Price filled Bull FVG zone”
“Price filled Bear FVG zone”
On-Chart Labels
Enable debugging to display Bull FVG or Bear FVG tags above the triggering candle.
Performance-Tuned
Supports up to 500 active zones without slowing down your chart.
⚙️ Inputs & Customization
Show Alert Labels (Boolean) – Toggle on-chart text labels.
Max Boxes Count (Integer) – Control the maximum number of zones displayed.

SMA Channel AlertsThe "SMA Channel with Alerts" indicator is designed to help traders visualize dynamic support and resistance zones based on a simple moving average (SMA). It computes the SMA on a user-specified timeframe and then applies user-configurable percentage deviations to generate a price channel. The channel consists of five lines:
Central SMA: The primary moving average (default is 12-period on a daily timeframe).
Upper Lines: Two lines plotted above the SMA, representing small and large positive percentage offsets.
Lower Lines: Two lines plotted below the SMA, representing small and large negative percentage offsets.
Key Features:
Customizable SMA:
Choose the SMA length.
Select the timeframe for the SMA calculation.
Specify the data source (default is closing price).
Adjustable Percentage Offsets:
Configure the upward offsets (small and large) as percentages.
Configure the downward offsets (small and large) as percentages.
Versatile Alert System:
Set alerts for price crossing any channel line upward or downward.
Receive individual alerts for each line when crossed in either direction.
A consolidated alert option for any crossing across all channel lines.
How to Use the Indicator:
Configuration:
Adjust the SMA settings (length, timeframe, source) to match your trading strategy.
Set your desired percentage deviations for the channel lines.
Alert Setup:
Open TradingView's alert creation window.
Choose the specific alert condition from the indicator (e.g., “Any Cross Upper Large (+)” or “Any Cross ANY Line”).
Configure your alert preferences (notification type, sound, etc.).
Trading Application:
Use the channel lines to gauge potential support and resistance levels.
Monitor the alerts for timely notifications when the price breaks through these key levels, signaling possible trend shifts or breakout opportunities.
This indicator is ideal for traders looking for a visual method to monitor price action relative to a moving average-based channel and to automate alert notifications for better trade timing.
Goldbach Timing Model This indicator is designed as a simple visual framework rather than a rigid signal system. It highlights time-based structure and key alignment zones to help identify when price behavior is more likely to be active or responsive. The logic is intentionally flexible, allowing the user to apply their own discretion instead of relying on strict conditions. Its primary value is visual clarity and context, not automatic entries or exits.

PriceLevels GBGoldbach Price Levels – Identify Algorithmic Key Zones
This open-source indicator is designed to help traders identify potential algorithmic key zones by highlighting price levels ending with specific numbers such as 03, 11, 29, 35, 65, and 71. These levels may act as inflection points or hesitation areas based on observed behavioral patterns in price movement.
What It Does:
📌 Scans and plots horizontal price levels where the price ends with one of the selected number combinations
🎯 Toggle on/off visibility for each number ending
🎨 Customize color and thickness for each level
🏷️ Shows price labels at the end of each line
🌗 Label styles (color/transparency) are adjustable for both dark and light chart themes
🧠 Why Use It:
This tool is ideal for discretionary traders who study market structure through static price anchors. It provides a visual reference for recurring numerical levels that may be used in algorithmic trading models or serve as psychological price zones.
⚠️ Disclaimer:
This script is open-source and intended for educational and analytical purposes only. No trading signals or performance guarantees are provided. Please use your own judgment when applying this tool in a trading context.

Gold Adaptive Surfer v42 [huntamayung]Just a trend-following optimized for minimal risk and high grip onto trend. Try to use it as a signal in 1 minute timeframe. Note that this was optimized for OANDA:XAUUSD only.

Gold M5 Scalping [Fixed Timezone]This is the M5 Scalping using Inside / Outside Bar
Only for Timezone +8 (8am - 12pm)
Scalping for king >o<

Gold M5 Scalping (Strategy)This is the New Strategy for my new Indicator for M5 Scalping.
Just to test my result.
Will release my indicator soon
GOLDEN RSI (70-50-30)The fluctuation range has been expanded. Theoriginal author only set it between 40 and 60, but arange of 30 to 70 would be more reasonableAdditionally, a 50 median line has been added withinthe fluctuation range


GOLD EMA Crossover Strategy This EMA Crossover Strategy is designed for intraday trading on the 5-minute chart.
It uses three EMAs (fast, mid, slow) to identify momentum shifts and trigger long or short entries. Risk management is dollar-based, with default settings of $100 risk per trade and $300 profit target. Entries are taken when the fast EMA crosses above/below the mid or slow EMA, with stops and targets calculated dynamically. The strategy runs across all hours and uses fixed position sizing (default 3 contracts). It is intended as a framework for traders to adapt and optimize to their own instruments and risk preferences.

Gold Master: Swing + Daily Scalp (Fixed & Working)How to use it correctly
Daily chart → Focus only on big green/red triangles (Swing trades)
5m / 15m / 1H chart → Focus on small circles (Scalp trades)
You can turn each system on/off independently in the settings
Works perfectly on XAUUSD, GLD, GC futures, and even DXY (inverse signals).


Golden CrossoverThis gives you and indication on chart whenever we have a cross over of EMAs of choice...

Gold Magic 1. Watch for the Icon
When you see the 💰 icon appear above or below the Bollinger Bands, it’s your first signal.
• An icon above the upper band means price has broken out to the upside.
• An icon below the lower band means price has broken out to the downside.
2. Wait for the Fair Value Gap
After the icon appears, the indicator will highlight the first Fair Value Gap (FVG) that forms.
• The FVG will show you exactly where a potential entry point is.
• It will also mark the suggested stop-loss level on the chart.
3. Prepare to Enter the Market
With the FVG and stop-loss levels in place, you have a clear idea of where to buy or sell and where to place your stop.
• This makes it easier to enter the market with confidence.

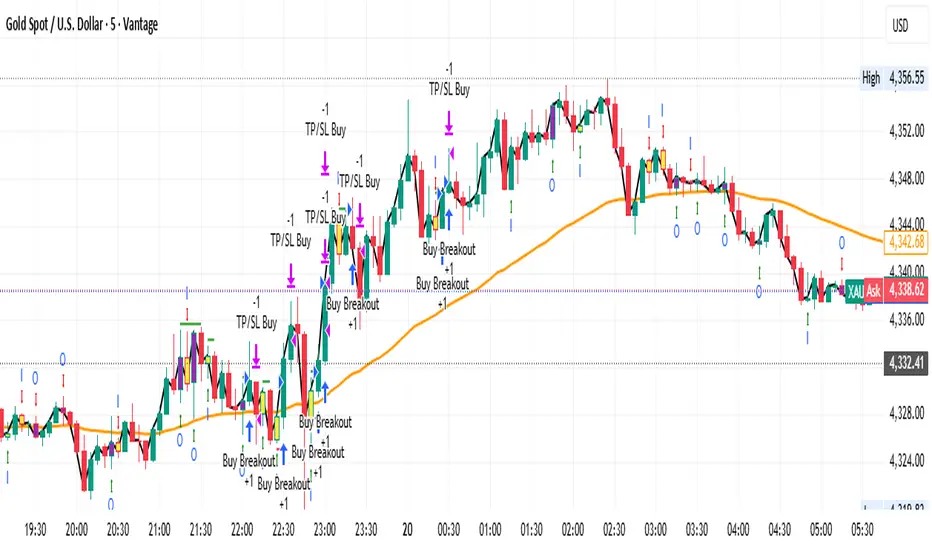
Gold 1&5 Min Trading Strategy [TradingFinder] XAU Scalper Signal🔵 Introduction
Scalping in financial markets is based on immediate price reactions and precise analysis of price action behavior. In this trading approach, the trader must identify signals that originate directly from market structure, momentum shifts, candlestick formations, and the position of price relative to key zones.
Supply and demand areas serve as the primary regions of order concentration and form the foundation of scalping analysis, since they provide the most accurate representation of balance or imbalance between buyers and sellers as well as the active flow of liquidity in the market.
In demand zones, price reactions usually begin with the formation of reversal or continuation candlestick patterns. These patterns include structures such as Pin Bar, Engulfing, Doji, Failure, Rejection, and other forms of false breakout behavior, each of which can indicate a potential short term change in direction.
Liquidity plays a central role in these reactions, because price entering a demand zone typically coincides with the absorption of sell side liquidity and the restoration of order flow. This process often leads to rapid movements that are suitable for scalping. Therefore, combining candlestick confirmation with the location of price inside a supply or demand zone is one of the most reliable methods of identifying low risk scalping signals.
Demand zones include several structural variations, each representing a different form of liquidity behavior. One of the most well known examples is the order block, which is the final bearish candle before a strong bullish movement and indicates the presence of unfilled buy side interest.
Another important structure is the Fair Value Gap, which appears when a price void forms across three consecutive candles due to a lack of liquidity during the moment of displacement. The market often returns to this area to restore balance. Imbalance structures also represent one sided pressure in order flow where the market reacts later to correct these inefficiencies.
Breaker structure is another key element in demand analysis. A breaker is formed when an order block is violated and price returns to the same level after collecting liquidity, then continues in the opposite direction. This pattern often appears near liquidity based highs or lows and reflects a shift in the strength of market participants.
Together, order blocks, Fair Value Gaps, imbalances, and breakers form the core of demand analysis in price action and are widely used in precise scalping strategies due to their strong connection with liquidity and the high predictability of price reactions within them.
Bullish Setup :
Bearish Setup :
🔵 How to Use
This strategy is built on price action analysis, market reactions inside supply and demand zones, and confirmation through candlestick patterns. The first step is to identify key areas such as order blocks, Fair Value Gaps, imbalances, or breakers.
After these zones are located, price behavior within them is examined using candlestick structure and momentum direction. Entries are taken only when price reaches a validated zone, a clear sign of liquidity absorption or injection appears, and a confirming candlestick forms inside the zone.
This approach allows the trader to capture fast and precise entries during moments when the market is actively reacting to decision points.
🟣 Long Setup
In the buy setup, a valid demand zone must first be identified. This can be a bullish order block, an unfilled bullish Fair Value Gap, an imbalance at the lower part of structure, or a bullish breaker. When price enters this zone and shows signs of absorbing sell side liquidity, candlestick behavior must be examined.
Formation of reversal signals such as a Pin Bar with a long lower wick, bullish Engulfing, Rejection Candle, or a false breakout of the low, indicates a favorable shift in order flow. After receiving candlestick confirmation, a buy entry is taken within the same zone and the stop level is placed below the liquidity boundary. Targets are typically based on filling gaps, reaching supply zones, or returning to structural means.
🟣 Short Setup
In the sell setup, a valid supply zone must be recognized. This may include a bearish order block, a bearish Fair Value Gap, an imbalance at the upper part of structure, or a bearish breaker. When price enters this zone and liquidity accumulates above nearby highs, the probability of a fast momentum shift increases.
Confirmation occurs when a bearish reversal pattern forms such as Engulfing, Pin Bar with a long upper wick, indecisive Doji followed by rejection, or a false breakout of the high. After confirmation, the sell entry is placed and the stop level is set above the liquidity zone. Targets are selected based on filling lower Fair Value Gaps, reaching demand zones, or returning to structural midpoints.
🔵 Settings
Last Candle in Signal Direction : When On, a signal is issued only if the last candle moves in the direction required by the signal.
Signal in Nearly Zone : When enabled, the signal becomes valid even if the candle is near the zone rather than strictly inside it. When disabled, only signals formed inside the zone are allowed.
Allow Both Side Signals : When On, signals from both sides of the structure can be issued even if a limiting level exists. When disabled, only signals that do not violate the limiting level are allowed.
🔵 Conclusion
Using price action, supply and demand zones, and candlestick confirmation alongside liquidity analysis creates an effective framework for identifying fast market reactions in scalping conditions. Focusing on structures such as order blocks, Fair Value Gaps, imbalances, and breakers allows the trader to recognize shifts in momentum and changes in order flow with greater precision.
In this approach, entries are taken only when price reaches a validated zone, liquidity behavior is observable, and the confirming candle forms at the correct location. This leads to organized, low risk scalping signals that are aligned with the real time behavior of the market.

golden owl 1HR- 1MIN setupmarks 1 hour interval or change in setting to fixed and 1 hr htf.... once cisd signal forms in the first 10 candles after 1 hour close go for it. 1:3 strict.. after price reaches 1:1 strictly move sl to entry. enjoy!

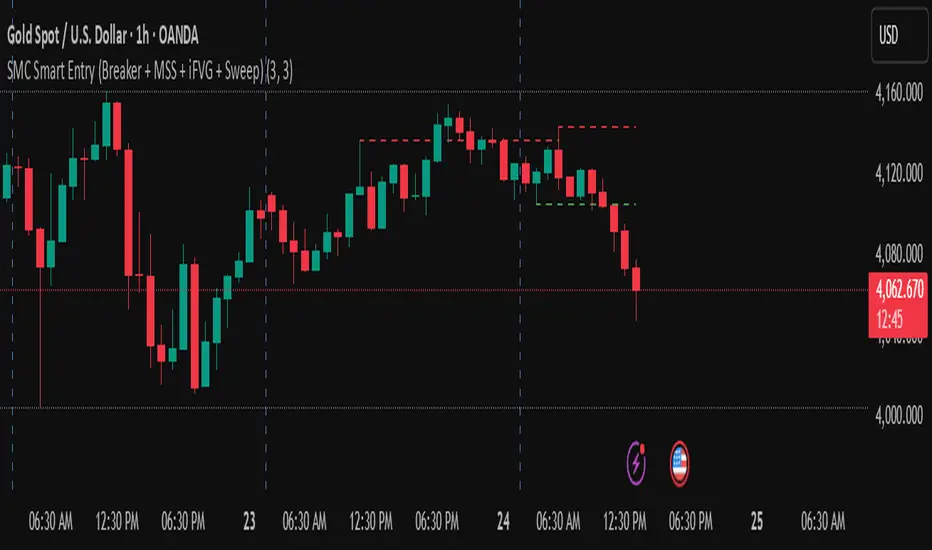
golden smart entrySmart Money Concepts (SMC) is a trading methodology that focuses on understanding and following the behavior of institutional investors—often referred to as "smart money." The goal is to identify high-probability trade setups by analyzing how these large players move the market.
Golden Cross & Death Cross DetectorThis script will:
Plot both moving averages on your chart
Show triangle markers when crossovers occur
Allow you to set up alerts
Let you choose between SMA and EMA
Customize the periods for both moving averages
