Squeeze Momentum Indicator mod#3 This is a corrected version of Squeeze Indicator that initially was authored by LazyBear and modified by KıvanÇ @fr3762 (twitter)
Indicator description: www.forextrading-pips.com
Interpretation:
When both the upper and lower Bollinger Bands go inside the Keltner Channel, the squeeze is on.
When the Bollinger Bands (BOTH lines) start to come out of the Keltner Channel, the squeeze has been released (off).
When one of the Bollinger Bands is out of Keltner Channel, no highlighting is done.
List of all my indicators: www.tradingview.com
在脚本中搜索"KELTNER"

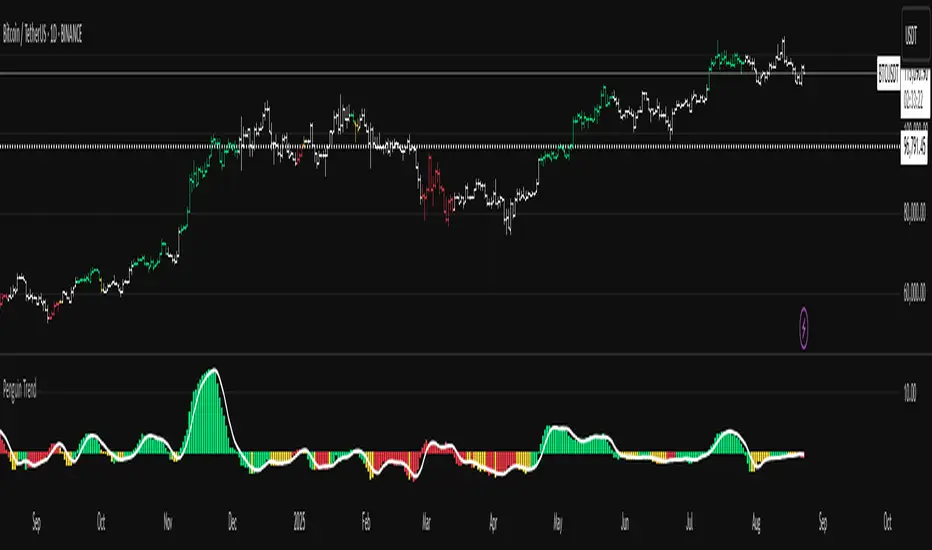
Penguin TrendMeasures the volatility regime by comparing the upper Bollinger Band to the upper Keltner Channel and colors bars with a lightweight trend state. Supports SMA/EMA/WMA/RMA/HMA/VWMA/VWAP and a selectable calculation timeframe. Default settings preserve the original look and behavior.
Penguin Trend visualizes expansion vs. compression in price action by comparing two classic volatility envelopes. It computes:
Diff% = (UpperBB − UpperKC) / UpperKC × 100
* Diff > 0: Bollinger Bands are wider than Keltner Channels -> expansion / momentum regime.
* Diff < 0: BB narrower than KC -> compression / squeeze regime.
A white “Average Difference” line smooths Diff% (default: SMA(5)) to help spot regime shifts.
Trend coloring (kept from original):
Bars are colored only when Diff > 0 to emphasize expansion phases. A lightweight trend engine defines four states using a fast/slow MA bias and a short “thrust” MA applied to ohlc4:
* Green: Bullish bias and thrust > fast MA (healthy upside thrust).
* Red: Bearish bias and thrust < fast MA (healthy downside thrust).
* Yellow: Bullish bias but thrust ≤ fast MA (pullback/weakness).
* Blue: Bearish bias but thrust ≥ fast MA (bear rally/short squeeze).
Note: By default, Blue renders as Yellow to preserve the original visual style. Enable “Use true BLUE color” if you prefer Aqua for Blue.
How it works (under the hood):
* Bollinger Bands (BB): Basis = selected MA of src (default SMA(20)). Width = StdDev × Mult (default 2.0).
* Keltner Channels (KC): Basis = selected MA of src (default SMA(20)). Width = ATR(kcATR) × Mult (defaults 20 and 2.0).
* Diff%: Safe division guards against division-by-zero.
* MA engine: You can choose SMA / EMA / WMA / RMA / HMA / VWMA / VWAP for BB/KC bases, Diff smoothing, and the trend components (VWAP is session-anchored).
* Calculation timeframe: Set “Calculation timeframe” to compute all internals on a chosen TF via request.security() while viewing any chart TF.
Inputs (key ones):
* Calculation timeframe: Empty = use chart TF; if set (e.g., 60), all internals compute on that TF.
* BB: Length, StdDev Mult, MA Type.
* KC: Basis Length, ATR Length, Multiplier, MA Type.
* Smoothing: Average Length & MA Type for the “Average Difference” line.
* Trend Engine: Fast/Slow lengths & MA type; Signal (kept for completeness); Thrust length & MA type (defaults replicate original behavior).
* Display: Paint bars only when Diff > 0; optional Zero line; optional true Blue color.
How to use:
1. Regime changes: Watch Diff% or Average Diff crossing 0. Above zero favors momentum/continuation setups; below zero suggests compression and potential breakout conditions.
2. State confirmation: Use bar colors to qualify expansion: Green/Red indicate expansion aligned with trend thrust; Yellow/Blue flag weaker/contrarian thrust during expansion.
3. Multi-timeframe analysis: Run calculations on a higher TF (e.g., H1/H4) while trading a lower TF chart to smooth noise.
Alerts:
* Diff crosses above/below 0.
* Average Diff crosses above/below 0.
* State changes: GREEN / RED / YELLOW / BLUE.
Notes & limitations:
* VWAP is session-anchored and best on intraday data. If not applicable on the selected calculation TF, the script automatically falls back to EMA.
* Default parameters (SMA(20) for BB/KC, multipliers 2.0, SMA(5) smoothing, trend logic and bar painting) preserve the original appearance.
Release notes:
v6.0 — Rewritten in Pine v6 with structured inputs and guards. Multi-MA support (SMA/EMA/WMA/RMA/HMA/VWMA/VWAP). Calculation timeframe via request.security() for multi-TF workflows. Safe division; optional zero line; optional true Blue color. Original visuals and behavior preserved by default.
License / disclaimer:
© waranyu.trkm — MIT License. Educational use only; not financial advice.
(JS) Squeeze Pro OverlaysSo this was something I planned on doing in the future, I knew it would take some time to put together but here it is, the Squeeze Pro 2 Overlays.
On my original Squeeze Pro, I had made several overlay indicators to go along with it, this time my goal was to combine all that stuff into a single indicator and allow the user to turn on and off the specific features they'd prefer to use. The version illustrated in the preview has everything turned on. What is "everything"? Here's the breakdown...
First of all - the color schemes in the Squeeze Pro match the color schemes in the Overlays indicator, so you can match them up (Color Scheme 3 in example). There are 6 schemes, option 1 is the original Squeeze colors.
There's also an option to make the light squeeze black, rather than white. This is for people who aren't using Dark Mode. It will flip all white to black, to make your charts better to read!
So there are 4 main overlays that can be switched on and off with this indicator, they include;
1. Early Signal Candles
2. BBMA Basis Line
3. Bollinger Bands/Keltner Channel Breaches
4. Signal Arrows
Early Signal Candles
The Early Signal Candles have two parameters, the entry smoothing period and the exit smoothing period.
There is a different type of early entry signal for each type of squeeze.
Low Squeeze generates white dots on the highs of the candles.
Mid Squeeze generates a lime green candle (or purple candle in color scheme 3).
High Squeeze generates a bigger purple circle on the high of the candle.
These three signals are made to mimic the original Early In/Out Candles from John Carter and represent the same thing (they work the same way).
As for the early exit, that would be determined by the color of the candle vs the color of the squeeze, works the same way as the original as well.
BBMA Basis Line
The BBMA (Bollinger Bands Momentum Average) was a moving average I had made to use with the squeeze on the previous version.
It is the basis line of the BB and KC used to make up the Squeeze (a 20 SMA). There are 4 different colors to it on this version.
1. Orange - This means no squeeze.
2. White/Black - Low Squeeze
3. Red - Mid Squeeze
4. Yellow - High Squeeze
You'll also notice these colors are light and dark in different spots - this is a representation of whether the Bollinger Bands are expanding or contracting. Dark means expanding, light means contracting.
Bollinger Bands/Keltner Channel Breaches
This is a pretty simple feature. If there is an ongoing squeeze, and a candle closes above or below the Bollinger Bands or Keltner Channels, a circle appears at the top or the bottom of the chart telling you which way the channel has been breached.
Signal Arrows
This is what makes up most of the overlay indicator. If you turn it on, the default is set to work just like the original. There are lots of options with this though.
First, you can turn each type of Squeeze Arrow on or off by checking/unchecking the boxes for them.
Now allow me to explain the "Signal Length", as there are several options.
The default is "6 Dots", this generates a signal when a particular type of Squeeze reaches the 6th dot ("12 Dots" works the same way).
"End of Squeeze" generates a signal once a type of Squeeze has concluded.
"End of Early Signal" generates a signal when the early dots (or candle) finishes.
"Custom" allows you to select your own dot duration to produce a signal, you select that number in the field below.
The other portion of this is the "Signal Type", this is where you select how each signal is generated once the selected amount of time takes place.
The default is the same as the original "+/-", this generates a signal based on whether Squeeze momentum is positive or negative.
"Rising/Falling" will only generate a signal if the Squeeze momentum maintains consistently over the last 6 bars.
"Crossed Zero" only generates a signal if the Squeeze momentum crosses above or below the zero line.
"Basis Line Momentum" is based on the BBMA. A signal is generated based on whether the current candle closes above or below the basis line.
"Divergence" only generates a signal if there is a divergence signal present at the time of the signal.
"Current Momentum" generates a signal based simply on the current direction of Squeeze momentum.
"Sum of Change" generates a signal based on the sum of the change in the Squeeze momentum being positive (long) or negative (short) over the length of time you select in the "Sum of Change Length" field.
Then "Combo" tries to take a look at everything and generates a score based on these parameters. Positive score = long, negative = short.
I hope I gave a detailed enough explanation on how everything works, let me know if you have any questions! Hope you like it!

Hyper Squeeze Sniper (Dual Side: Long + Short)Hyper Squeeze Sniper (Dual Side Strategy)
This script is a comprehensive Volatility Breakout System designed to identify and trade explosive price moves following periods of consolidation. It combines the classical "Squeeze" theory with Linear Regression Momentum, Volume Analysis, and an ATR-based Trailing Stop to filter false signals and manage risk effectively.
The script operates on a logic of "Compression -> Explosion -> Trend Following" suitable for both Long and Short positions.
🛠 Detailed Methodology (How it works)
1. The Squeeze Detection (Consolidation) The core concept relies on the relationship between Bollinger Bands (BB) and Keltner Channels (KC).
Condition: When the Bollinger Bands (Standard Deviation) contract and fall inside the Keltner Channels (ATR based), it indicates a period of extremely low volatility (The Squeeze).
Visual: The background turns Gray to indicate "Do Not Trade / Wait Mode".
2. Momentum Confirmation (Linear Regression) Instead of using standard lagging indicators, this script utilizes Linear Regression of the price deviation to determine the direction of the breakout.
If the Linear Regression Slope > 0, the bias is Bullish.
If the Linear Regression Slope < 0, the bias is Bearish.
3. Volume Validation To avoid fake breakouts, a Volume Spike filter is applied. A signal is only valid if the current volume exceeds its moving average by a defined multiplier (Default x1.2).
4. Risk Management: ATR Trailing Stop Once a trade is entered, the script calculates a dynamic Trailing Stop based on the Average True Range (ATR).
- Long: The stop line trails below the price and never moves down.
- Short: The stop line trails above the price and never moves up.
- Exit: The position is closed immediately when the price breaches this volatility-based safety line.
How to Use
1. Wait: Look for the Gray Background. This is the accumulation phase.
2. Entry:
LONG: Wait for a Green Triangle ▲ (Price breaks Upper BB + Vol Spike + Bullish Momentum).
SHORT: Wait for a Red Triangle ▼ (Price breaks Lower BB + Vol Spike + Bearish Momentum).
3. Exit: Close the position when the "X" mark appears or when candles cross the trailing safety line.
Settings
- BB Length/Mult: Adjust the sensitivity of the squeeze detection.
- Vol Spike Factor: Increase this to filter out low-volume breakouts.
- ATR Period/Mult: Adjust the trailing stop distance (Higher = Wider stop for swing trading).

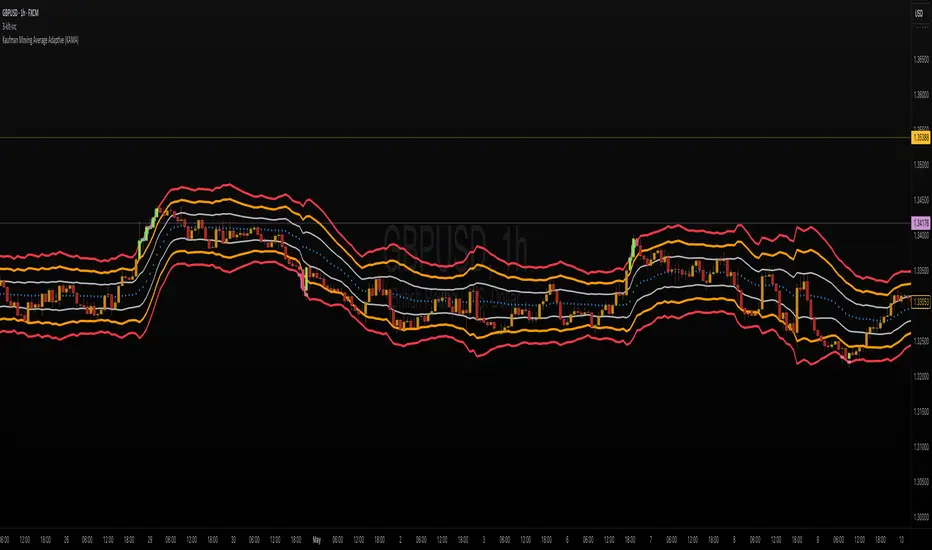
ka66: Triple Keltner Around SourceThis is an indicator-on-indicator which draws Keltner Bands (ATR Bands) around any selected Basis Source, instead of hardcoding a moving average, etc. This allows you to put bands around any sort of esoteric moving average of your choice, or even just around price data like OHLC, HLC3, and so on.
It's an enhancement on my prior Multi ATR Channels script at
Written in Pine v6 and allowing custom timeframe selection.
For example, the published chart shows the bands place around a Kaufman Adaptive Moving Average (KAMA), plotted in blue dots.
You would use it for anything that you would use plain Keltners for:
Mean Reversion
Breakouts
Take Profit and Stop Loss Estimation
But with any basis that you deem more suitable for your purposes.
VWMA Keltner BandsKind of like Keltner Channel/Bands (stockcharts.com) but using VWMA instead so that volume is taken in to account.
Outside the upper band can considered to be 'overbought' and outside the lower band can be considered to be 'oversold'
Has option to highlight signals (i.e. when price closes outside a channel) and also the option to only display signals if the price is on the correct side of VWAP (i.e. no sell signals if price is above VWAP)
BBKC Combined Channels OverlayBBKC Combined Channels Overlay (Volatility & Mean Reversion)This indicator provides a clean, single-view envelope combining the Bollinger Bands (BB) and Keltner Channels (KC) directly onto your price chart. It is an essential tool for traders operating with Volatility Compression (The Squeeze) and Mean Reversion strategies in fast-moving markets like Futures, High BTC Beta Equities, and Crypto. The goal of this tool is twofold: to visually frame the market's current volatility state and to identify high-probability entry points based on expansion or extreme contraction. How to Use the BBKC Overlay: Spotting the Squeeze (Accumulation Phase):The Squeeze is identified when the Bollinger Bands (BB) contract and fit inside the Keltner Channels (KC).The area is clearly marked with a subtle Orange Background Highlight on the main chart. This is the Accumulation phase, signaling low volatility before a potential large directional move. Trading Mean Reversion: When price pushes aggressively outside the outermost bands (the BB Upper/Lower), it signals an extreme volatility expansion and over-extension. This is a strong setup for mean reversion—a high-probability trade targeting a snap-back towards the central Basis Line (SMA).Customizing for Extreme Compression: For traders looking only for the tightest, highest-probability Squeezes, adjust the following setting: KC Multiplier (ATR): Lower this value from the default of 1.5 down to 1.25 or 1.0. This narrows the KC, forcing the Bollinger Bands to contract even further to trigger the Squeeze signal, thus filtering for only the most minimal volatility. Recommended Synergy: For a complete volatility system, pair this BBKC Combined Channels Overlay (your visualization tool) with the BBKC Squeeze Indicator (the sub-pane momentum histogram).Overlay (Main Chart): Shows where the Squeeze is occurring and identifies mean reversion targets. Squeeze Indicator (Lower Pane): Shows if the Squeeze is active and the directional momentum building up, helping you time the breakout entry for the Manipulation/Distribution phase.

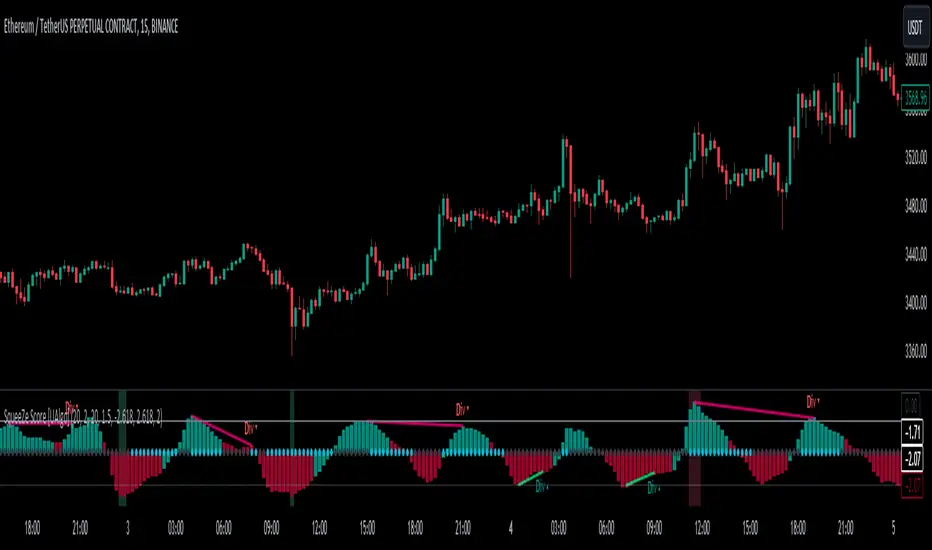
SqueeZe Score [UAlgo]The "SqueeZe Score" is a script based on the "Squeeze Momentum Indicator". It utilizes Bollinger Bands (BB) and Keltner Channels (KC) to identify periods of low volatility, indicating potential upcoming price movements. The Z-Score method is employed to measure deviations from the mean, highlighting extreme price movements within the context of the current volatility environment. This script provides traders with visual cues for potential bullish and bearish divergences, aiding in decision-making during trading activities.
🔶Key Features:
SqueeZe Settings: Users can customize parameters such as the length and multiplier factors for Bollinger Bands and Keltner Channels, providing flexibility to adapt the indicator to different trading strategies and market conditions.
Divergence Detection: The script includes options to detect and display both bullish and bearish divergences, providing additional insights into potential trend reversals or continuations.
Customizable Z-Score Thresholds: Thresholds for the Z-Score are user-defined, enabling traders to set levels at which extreme price movements are highlighted on the chart, facilitating quick identification of significant market conditions.
🔶Credit:
This script is inspired by the work of @LazyBear, who contributed to the original concept and development of the Squeeze Momentum indicator.
🔶Disclaimer:
- The information provided by this script is for educational and informational purposes only and should not be construed as financial advice.
- Users are encouraged to conduct their own research and analysis before making any investment decisions.
Trend IndicatorThis indicator has different features:
1. Ichimoku = this indicator can plot Ichimoku calculated both in the common formula and with the volume average, you can choose the calculator method for each line.
2. Channel and Bands = this mode allows the user to choose from channel and band, "channel" shows the Keltner channel, and "band" shows the Bollinger bands. Both the indicators are calculated including the volume in the formula of the average midpoint.
3. Color candle = this function allows the user to see two different colors of candles on the chart, the positive color occurs when both the long-term average and the short team average of price calculated using the volume is above the two averages calculated without the volume. This function is great to analyze the volume pressure, useful to identify trend continuation and exhaustion.
4. Extreme reversal zones = this is a version of the Keltner channels calculated over a high number of candles and with high deviation, to identify the potential zones of reversal.
Note that in the "Ichimoku" indicator, the backline is the T.R.A.M.A. indicator, created and published open source by Lux Algo, which I thank for the script.

Squeeze Momentum Indicator [LazyBear] added Alerting + webhookA modified version of Squeeze Momentum Indicator visualizing on Price Chart.
author: @LazyBear, modified by @KivancOzbilgic, and by @dgtrd
I took in all of the information as the script below is based on the V2 Script that @LazyBear posted and then added Alerting based on the math and the conditions that @dgtrd added.
Per the description here:
The Squeeze Indicator measures the relationship between Bollinger Bands and Keltner's Channels to help identify consolidations and signal when prices are likely to break out (whether up or down).
The Squeeze Indicator finds sections of the Bollinger Bands which fall inside the Keltner's Channels, and in this case, the market is said to be in a squeeze (indicator turns off, displayed with grey diamond shapes in this study).
When the volatility increases, so does the distance between the bands. Conversely, when the volatility declines, the distance also decreases, and in such cases, the squeeze is said to be released (indicator turns on, displayed with triangle up or triangle down shapes)
Taking the above information and what was in the script was able to base the alert conditions:
So when the condition:
Squeeze On or No Squeeze = In Squeeze
Squeeze Off = Squeeze Release Long or Squeeze Release Long based off conditions.
There are 2 separate alert Types.
1. App, Pop-up, eMail, play sound and Send email to SMS
2. It Is dedicated to Webhook for your various applications.
Alerting Options
i.imgur.com
App Notification
i.imgur.com
i.imgur.com
Webhook test into Discord
i.imgur.com
[TTI] ATR channelsHISTORY AND CREDITS
Used by John Carter in his indicator’s toolbox. The ATR channels or the Keltner Channels represent the railroads or the natural movement of stocks.
WHAT IT DOES
Movements between the the The first multiplier lines (white) represent standard movement for the timeframe you are trading. Movements between the second multiplier (green/red lines) represent a 2stdv move of the stock in a single direction. Once a stock starts reaching the 3rd multiplier lines there’s an exponential chance that it will revert to the mean (cyan line)
Additionally, we have added the Institutional lines. These are thought in a Small Account Mastery class 2019 by John Carter, as the levels heavily watched by institutions. The default settings represent what John is teaching but they can be further customised.
HOW TO USE IT
ATRs channels or Keltner Channels can be great source for target or stop losses and can be used as a indicator for confluence with other technical tools like the Fibonacci lines.

Adaptive Squeeze Momentum +Adaptive Squeeze Momentum+ (Auto-Timeframe Version)
Overview
Adaptive Squeeze Momentum+ is an enhanced volatility and momentum indicator designed to identify compression and expansion phases in price action. It is inspired by the classic Squeeze Momentum Indicator by LazyBear but introduces automatic parameter adaptation to any timeframe, making it simpler to use across different markets without manual configuration.
Concepts and Methodology
The script combines Bollinger Bands (BB) and Keltner Channels (KC) to detect periods when volatility contracts (squeeze) or expands (release).
A squeeze occurs when BB are inside KC, suggesting low volatility and potential breakout scenarios.
A squeeze release is detected when BB expand outside KC.
Momentum is derived using a linear regression applied to the difference between price and a midrange reference level.
Original Improvements
Compared to the original Squeeze Momentum Indicator, this version offers several enhancements:
Automatic Adaptation: BB and KC lengths and multipliers are dynamically adjusted based on the chart’s timeframe (from 1 minute up to 1 month), removing the need for manual tuning.
Simplified Visualization: A clean, minimalist histogram and clear squeeze state cross markers allow for faster interpretation.
Flexible Application: Designed to work consistently on intraday, daily, and higher timeframes across crypto, forex, stocks, and indices.
Features
Dynamic Squeeze Detection:
Gray Cross: Neutral (no squeeze detected)
Blue Cross: Active squeeze
Yellow Cross: Squeeze released
Momentum Histogram:
Positive/negative momentum shown with slope-based coloring.
Timeframe-Aware Parameters:
Automatically sets optimal BB/KC configurations.
Usage
Watch for blue crosses indicating an active squeeze phase that may precede a directional move.
Use the histogram color and slope to gauge momentum strength and direction.
Combine squeeze release signals with momentum confirmation for potential entries or exits.
Credits and Licensing
This script was inspired by LazyBear’s OLD “Squeeze Momentum Indicator” (). The implementation here significantly expands upon the original by introducing auto-adaptive parameters, restructured logic, and a new visualization approach. Published under the Mozilla Public License 2.0.
Disclaimer
This indicator is for educational purposes only and does not constitute financial advice. Use at your own risk.

Auto-Length Adaptive ChannelsIntroduction
The key innovation of the ALAC is the implementation of dynamic length identification, which allows the indicator to adjust to the "market beat" or dominant cycle in real-time.
The Auto-Length Adaptive Channels (ALAC) is a flexible technical analysis tool that combines the benefits of five different approaches to market band and price deviation calculations.
Traders often tend to overthink of what length their indicators should use, and this is the main idea behind this script. It automatically calculates length based on pivot points, averaging the distance that is in between of current market highs and lows.
This approach is very helpful to identify market deviations, because deviations are always calculated and compared to previous market behavior.
How it works
The indicator uses a Detrended Rhythm Oscillator (DRO) to identify the dominant cycle in the market. This length information is then used to calculate different market bands and price deviations. The ALAC combines five different methodologies to compute these bands:
1 - Bollinger Bands
2 - Keltner Channels
3 - Envelope
4 - Average True Range Channels
5 - Donchian Channels
By averaging these calculations, the ALAC produces an overall market band that generalizes the approaches of these five methods into a single, adaptive channel.
How to Use
When the price is at the upper band, this might suggest that the asset is overbought and may be due for a price correction. Conversely, when the price is at the lower band, the asset may be oversold and due for a price increase.
The space between the bands represents the market's volatility. Wider bands indicate higher volatility, while narrower bands suggest lower volatility.
Indicator Settings
The settings of the ALAC allow for customization to suit different trading strategies:
Use Autolength?: This allows the indicator to automatically adjust the length of the dominant cycle.
Usual Length: If "Use Autolength?" is disabled, this setting allows the user to manually specify the length of the cycle.
Moving Average Type: This selects the type of moving average to be used in the calculations. Options include SMA, EMA, ALMA, DEMA, JMA, KAMA, SMMA, TMA, TSF, VMA, VAMA, VWMA, WMA, and ZLEMA.
Channel Multiplier: This adjusts the distance between the bands.
Channel Multiplier Step: This changes the step size of the channel multiplier. Each next market band will be multiplied by a previous one. You can potentially use values below 1, which will plot bands inside the first, main channel.
Use DPO instead of source data?: This setting uses the DPO for calculations instead of the source data. Basically, this is how you can add or eliminate trend from calculation of an average leg-up / leg-down move.
Fast: This adjusts the fast length of the DPO.
Slow: This adjusts the slow length of the DPO.
Zig-zag Period: This adjusts the period of the zig-zag pattern used in the DPO.
(!) For more information about DPO visit official TradingView description here: link
Also, I want to say thanks to @StockMarketCycles for initial idea of Detrended Rhythm Oscillator (DRO) that I use in this script.
The Adaptive Average Channel is a powerful and versatile indicator that combines the strengths of multiple technical analysis methods.
In summary, with the ALAC, you can:
1 - Dynamically adapt to any asset and price action with automatic calculation of dominant cycle lengths.
2 - Identify potential overbought and oversold conditions with the adaptive market bands.
3 - Customize your analysis with various settings, including moving average type and channel multiplier.
4 - Enhance your trading strategy by using the indicator in conjunction with other forms of analysis.

Oliver Velez IndicatorOliver Velez is a well-known trader and educator who has developed multiple trading strategies. One of them is the 20-200sma strategy, which is a basic moving average crossover strategy. The strategy involves using two simple moving averages (SMAs) - a short-term SMA with a period of 20 and a long-term SMA with a period of 200 - on a 2-minute timeframe chart.
When the short-term SMA crosses above the long-term SMA, it signals a potential bullish trend and traders may look for opportunities to enter a long position. Conversely, when the short-term SMA crosses below the long-term SMA, it signals a potential bearish trend and traders may look for opportunities to enter a short position.
Traders using this strategy may also look for additional confirmations, such as price action signals or other technical indicators, before entering or exiting a trade. It is important to note that no trading strategy can guarantee profits, and traders should always use risk management techniques to limit potential losses.
This script is an implementation of the 2 SMA's (can also choose other types of MA's), with Elephant Bar Indicator (EBI) and the Tail Bars Indicator in TradingView.
The Elephant Bar Indicator is a technical indicator used in trading to identify potential trend reversals in the market. It is named after the large size of the bullish or bearish candlestick that it represents. The Tail Bars Indicator is a pattern recognition technique that identifies candlestick patterns with long tails or wicks.
The script starts by defining the input parameters for both indicators. For the Elephant Bar Indicator, the user inputs the lookback period and the size multiplier. For the Tail Bars Indicator, the user inputs the tail ratio and opposite wick ratio.
Next, the script calculates the moving averages of the closing price over the defined short and long periods using the Moving Average function. The script then calculates the average candle size and volume over the lookback period.
The script then identifies the Elephant Bars and Tail Bars using the input parameters and additional conditions. For Elephant Bars, the script identifies bullish and bearish bars that meet certain criteria, such as a size greater than the average candle size and volume greater than the average volume.
For Tail Bars, the script identifies bullish and bearish bars that have long tails or wicks and meet certain criteria such as opposite wick size less than or equal to the tail size multiplied by the input opposite wick ratio.
Finally, the script plots the Elephant Bar and Tail Bar signals on the chart using different colors and shapes. The script also plots the moving averages and Keltner Channels to help traders identify potential trend reversals.
It is still under development, so please, if someone has ideas to add, more than welcome
FATL, SATL, RFTL, & RSTL Digital Signal Filter Smoother [Loxx]FATL, SATL, RFTL, & RSTL Digital Signal Filter (DSP) Smoother is is a baseline indicator with DSP processed source inputs
What are digital indicators: distinctions from standard tools, types of filters.
To date, dozens of technical analysis indicators have been developed: trend instruments, oscillators, etc. Most of them use the method of averaging historical data, which is considered crude. But there is another group of tools - digital indicators developed on the basis of mathematical methods of spectral analysis. Their formula allows the trader to filter price noise accurately and exclude occasional surges, making the forecast more effective in comparison with conventional indicators. In this review, you will learn about their distinctions, advantages, types of digital indicators and examples of strategies based on them.
Two non-standard strategies based on digital indicators
Basic technical analysis indicators built into most platforms are based on mathematical formulas. These formulas are a reflection of market behavior in past periods. In other words, these indicators are built based on patterns that were discovered as a result of statistical analysis, which allows one to predict further trend movement to some extent. But there is also a group of indicators called digital indicators. They are developed using mathematical analysis and are an algorithmic spectral system called ATCF (Adaptive Trend & Cycles Following). In this article, I will tell you more about the components of this system, describe the differences between digital and regular indicators, and give examples of 2 strategies with indicator templates.
ATCF - Market Spectrum Analysis Method
There is a theory according to which the market is chaotic and unpredictable, i.e. it cannot be accurately analyzed. After all, no one can tell how traders will react to certain news, or whether some large investor will want to play against the market like George Soros did with the Bank of England. But there is another theory: many general market trends are logical, and have a rationale, causes and effects. The economy is undulating, which means it can be described by mathematical methods.
Digital indicators are defined as a group of algorithms for assessing the market situation, which are based exclusively on mathematical methods. They differ from standard indicators by the form of analysis display. They display certain values: price, smoothed price, volumes. Many standard indicators are built on the basis of filtering the minute significant price fluctuations with the help of moving averages and their variations. But we can hardly call the MA a good filter, because digital indicators that use spectral filters make it possible to do a more accurate calculation.
Simply put, digital indicators are technical analysis tools in which spectral filters are used to filter out price noise instead of moving averages.
The display of traditional indicators is lines, areas, and channels. Digital indicators can be displayed both in the form of lines and in digital form (a set of numbers in columns, any data in a text field, etc.). The digital display of the data is more like an additional source of statistics; for trading, a standard visual linear chart view is used.
All digital models belong to the category of spectral analysis of the market situation. In conventional technical indicators, price indications are averaged over a fixed period of time, which gives a rather rough result. The use of spectral analysis allows us to increase trading efficiency due to the fact that digital indicators use a statistical data set of past periods, which is converted into a “frequency” of the market (period of fluctuations).
Fourier theory provides the following spectral ranging of the trend duration:
low frequency range (0-4) - a reflection of a long trend of 2 months or more
medium frequency range (5-40) - the trend lasts 10-60 days, thus it is referred to as a correction
high frequency range (41-130) - price noise that lasts for several days
The ATCF algorithm is built on the basis of spectral analysis and includes a set of indicators created using digital filters. Its consists of indicators and filters:
FATL: Built on the basis of a low-frequency digital trend filter
SATL: Built on the basis of a low-frequency digital trend filter of a different order
RFTL: High frequency trend line
RSTL: Low frequency trend line
Inclucded:
4 DSP filters
Bar coloring
Keltner channels with variety ranges and smoothing functions
Bollinger bands
40 Smoothing filters
33 souce types
Variable channels

LNL Pullback ArrowsBuying the dip has never been easier! LNL Pullback Arrows are here to pinpoint the best possible entries for the trend following setups. With the Pullback Arrows, trader can pick his own approach and risk level thanks to four different types of arrows. The goal of these arrows is to force the traders to scale in & out of trades which is in my opinion crucial when it comes to trend following strategies. These arrows were designed primarily for the daily & weekly time frame (swing trading).
Four Types of Pullback Arrows:
1. Aggro Arrows - Ideal for aggresive approach during parabolic trends. Sometimes trends are so strong that the price barely revisits the daily 8 EMA. This is where the aggro arrows can perfectly pinpoint the aggresive high risk entries. Ideal for halfsize or 1/4 size of the full position. Aiming for quick 1-2 day moves targeting the recent high/low. These arrows could be also named as scalping arrows for the swing traders. A quick In & Out.
2. HalfSize Arrows - Medium risk approach. First arrows to scale in. HalfSize arrows are the first sign that the pullback might be ending, yet there is still some space left for an even deeper pullback. That is the reason why they are called half-size. Ideally taken with half-sized position. When trading the HalfSize Arrows, It is better to have some "spare ammo in the gun" ready to use.
3. FullSize Arrows - Regular risk approach. These arrows represent a zone where the core of the posititon should be taken. The point of validity for the trend is not that far away, meaning the risk can be kept tight. Ideal for scailing the other halfs or quarters of the full position. Also great for more conservative traders or environments with higher volatility.
4. Rare Arrows - Offer the best risk to reward entries during the trend. Rare Arrows should be the "last kick" of the retracement, therefore stops can be positioned really tight. They either trigger the stop immidiately or they provide another juicy leg up or down in the direction of the trend. However, they really do appear rarely.
Simple EMA Cloud:
A simple cloud based on 21 and 55 exponential moving averages. This default length creates a pullback zone that is wide enough for the conservative traders but also give the opportunities to more aggresive traders. Alternatives such as 8 & 21, or 21 & 34 are forming the zone that is too aggresive and usually too thin. Of course, cloud can be fully adjusted or turned off completely. The only role of the cloud is to gauge the trend.
Tips & Tricks:
1.Importance of the Scailing
- As already stated, scailing is crucial to this since there is no way of knowing the exact level at which the price magically bounce every time. It is hard to tell where and which EMA will be respected. How can we know it will be 21 EMA every time? or 34 EMA or 10 EMA or 100 SMA or 50 DMA ... Single MA does not make a trend. This is the reason why scailing is so important. Scailing can make a difference.
2. Nothing is Perfect
- Same as any other study, nothing works 100% perfectly. Sometimes the setup will go right against you and sometimes the price will fade away sideways and breaks off the structure of the trend. This is not a magic certainty tool. This is just another probability tool.
3. Point of Validity & Other Studies
- Even though the pullback arrows can be a stand-alone strategy. It is important to use other indicators that visualize the actual trend. Whether its EMA Cloud or EMAs or DMI Bars or Keltner Channels, there should be something that validates the trend, something that tells the trend is over. (Pullback Arrows are not showing the actual stops!).
Hope it helps.

Bridge Bands ATR (Overlay) ShaneHurst-Adaptive Volatility Bands
A fractal-inspired evolution of Bollinger and Keltner bands that adapts dynamically to both volatility and trend persistence.
This indicator estimates the Hurst exponent (H) — a measure of market memory — and adjusts a standard volatility band to lean in the direction of the prevailing trend.
When H > 0.5, markets exhibit persistence (trending behavior); the bands shift in the trend’s direction.
When H < 0.5, markets are mean-reverting; the bands flatten and recent extremes become potential fade zones.
Band width scales with recent volatility (σ), expanding in turbulent conditions and contracting during calm periods.
Key Features:
Adaptive offset using the Hurst exponent
Volatility-sensitive width for dynamic market regimes
EMA baseline with directional bias
Clear visual separation between trending and choppy phases
Inspired by Benoit Mandelbrot’s The Misbehavior of Markets and H.E. Hurst’s original work on long-term memory in time series.
Use it to identify regime shifts, trend-following entries, and volatility-adjusted stop levels.
Credit for this script goes to a number of people including Steve B, MichaalAngle, doc and joecat808. 500 day DEMA (double EMA) can be used as a longer term momentum line.

Channel Based Zigzag [HeWhoMustNotBeNamed]🎲 Concept
Zigzag is built based on the price and number of offset bars. But, in this experiment, we build zigzag based on different bands such as Bollinger Band, Keltner Channel and Donchian Channel. The process is simple:
🎯 Derive bands based on input parameters
🎯 High of a bar is considered as pivot high only if the high price is above or equal to upper band.
🎯 Similarly low of a bar is considered as pivot low only if low price is below or equal to lower band.
🎯 Adding the pivot high/low follows same logic as that of regular zigzag where pivot high is always followed by pivot low and vice versa.
🎯 If the new pivot added is of same direction as that of last pivot, then both pivots are compared with each other and only the extreme one is kept. (Highest in case of pivot high and lowest in case of pivot low)
🎯 If a bar has both pivot high and pivot low - pivot with same direction as previous pivot is added to the list first before adding the pivot with opposite direction.
🎲 Use Cases
Can be used for pattern recognition algorithms instead of standard zigzag. This will help derive patterns which are relative to bands and channels.
Example: John Bollinger explains how to manually scan double tap using Bollinger Bands in this video: www.youtube.com This modified zigzag base can be used to achieve the same using algorithmic means.
🎲 Settings
Few simple configurations which will let you select the band properties. Notice that there is no zigzag length here. All the calculations depend on the bands.
With bands display, indicator looks something like this
Note that pivots do not always represent highest/lowest prices. They represent highest/lowest price relative to bands.
As mentioned many times, application of zigzag is not for buying at lower price and selling at higher price. It is mainly used for pattern recognition either manually or via algorithms. Lets build new Harmonic, Chart patterns, Trend Lines using the new zigzag?

One-Sided Gaussian Filter w/ Channels [Loxx]One-Sided Gaussian Filter w/ Channels is a Gaussian Moving Average that is calculated using a Fibonacci weighting function. Keltner channels have been added to show zones of exhaustion. A better name would be "Half Gaussian bell weighted" or "Half normal distribution weighted" indicator, since the weights for calculation of the average (similar to linear weighted average) are taken from a normal distribution curve like function--but only the half of the curve is used for calculation.
Information of the Gaussian distribution can be found here : en.wikipedia.org and once you take a look at the standard normal distribution curve, it will be much clearer what is exactly done in this indicator.
After the Gaussian Filter is applied to the source input, an Ehlers' 2-Pole Super Smoother is applied to reduce noise without significant lag.
Included:
Bar coloring
Signals
Alerts
Loxx's Expanded Source Types

Dual Mean Reversion Channel (adjusted lower band)This is a public and open-source lighter version compared to the "Overextended Price Channel" which is provided complimentaty to the Trend Insight System.
Introduction :
Channels are very useful tools to assess overextended price, volatility and upcoming retracement or impulsive moves (such as Bollinger Band squeezes). It is an indispensable addition to any trader using Mean Reversion theory for a scalp-trade or swing-trade.
This script contains :
- 2 channels Keltner-style, using the True Range for volatility
- customizable volatility (channel width) and smoothing period
- a standard selection of moving average ; SMA, EMA, VWMA
- an embedded readjustment of the lower bands to avoid the drop on a logarithmic scale (see explanation below)
Why another channel indicator ?
I have found most conventional channels to be either not based on "proper" volatility (e.g. standard deviation of price action for Bollinger Band), or the bottom channel to be ill adapted to the logarithmic scale and plunges to 0 on some high volatility periods, messing with readability on logarithmic auto-scaled chart.
Also, I find the channels to be most useful when superimposed with another one of longer length; especially a pair of channels with a 50 and 200 period moving average respectively. Mean Reversion traders that mostly trade the 50 and 200 SMA/EMA know what I am talking about as having a channel helps to have a better visual for a proper of entry and exit point.
Disclaimer :
This indicator was originally intended to be used along with the Trend Insight System to improve performance, and the default configuration mostly backtested on BTCUSD.
Please use with caution, proper risk management and along with your favorite oscillator, candlestick reading and signals system.
Some explanation :
Based on Mean Reversion paradigm, everything has a tendency to revert back to the mean :
- when the price enters the upper channel, it is supposed to be (or start getting) overbought as the market is getting overheated, thus prone to correction,
- on the other hand, when the price enters the lower channel, it is supposed to be (or getting) oversold and the market looks favorable for a buy-in.
Depending on the trading style used, a trader will usually either wait until the price leaves the channel towards the mean before taking action (conservative style) or you will set limit orders inside the channel as you expect a reversion to the mean (more agressive/risky style).
With two channels, more complex (and maybe precise) rules can be built to optimize one's trading strategy.
Important notes :
In the end, sticking with 50/200 length and a single setting on volatility might be wiser, be wary of overoptimization which is risky at best and counter productive at worst (according to legendary traders such as Mark Douglas). Even if, needless to say, the volatility needs to be adjusted between a nascent and volatile market (such as crypto) compared to standard call markets that are much less volatile.
End notes :
It will always be considered a work in progress to help bring out the best of trading with channels, any comment and suggestion are welcomed.

MA Streak Change ChannelChange Channel is like KC unless it uses percentage changes in price to set channel distance. Midline is zero-lag smoothed ROC with dynamic period based on MA Streak indicator, if MA Streak shows an ongoing trend, midline going strong and break out the channel.
Consider using ▲ green areas as a signal to buy and ▼ red areas as a sell signal. It works best in a flat market. Use in combination with other indicators.

Relative Channel BandwidthThis indicator uses different volatility channels - Bollinger Band, Donchian Channel and Keltner Channel width to measure volatility.
Indicator plots channel bandwidth percentage with respect to close price.
This is not same as Bollinger Percent B - which is measure of where price is with respect to band. Instead this indicator is similar to ATR Percent indicator published here:
Plotting is color coded to indicate volatility zone:
Red : Extreme volatility
Orange : High volatility
Lime : Low volatility
Green : Extreme low volatility
These levels are again derived by long period bollinger bands

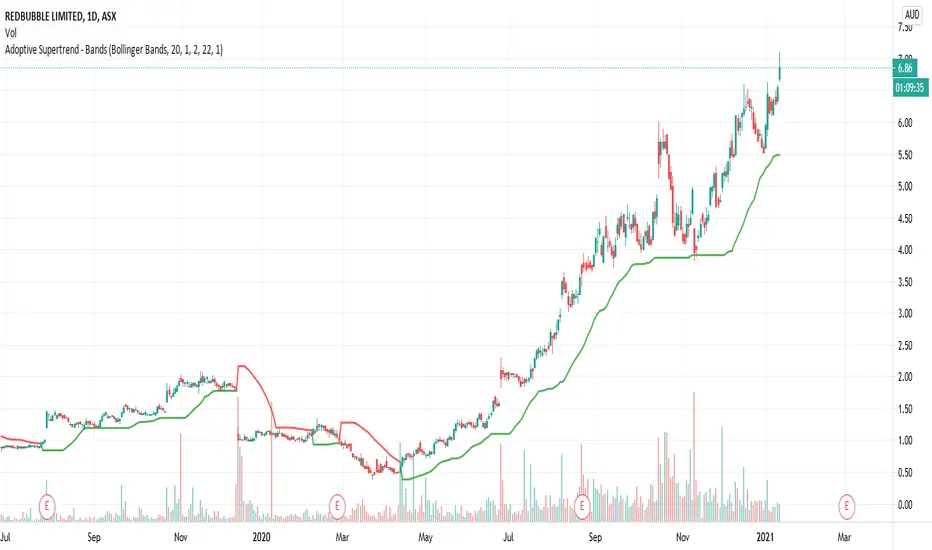
Adoptive Supertrend - BandsAnother adoption of supertrend. This time based on different channels - Bollinger Band, Keltner Channel, Donchian Channel and Pivot point based Donchian channel.
When price hits top of bands, it is considered as start or continuation of uptrend. When price hits bottom of the band it is considered as start or continuation of downtrend. Hence, supertrend is drawn based on these calculations. Use ATR Periods and ATR Multiplier to create stops certain ATR away from band's top and bottom.
Other supertrend adoptions published are here:
Pivot point based donchian channel is published here: